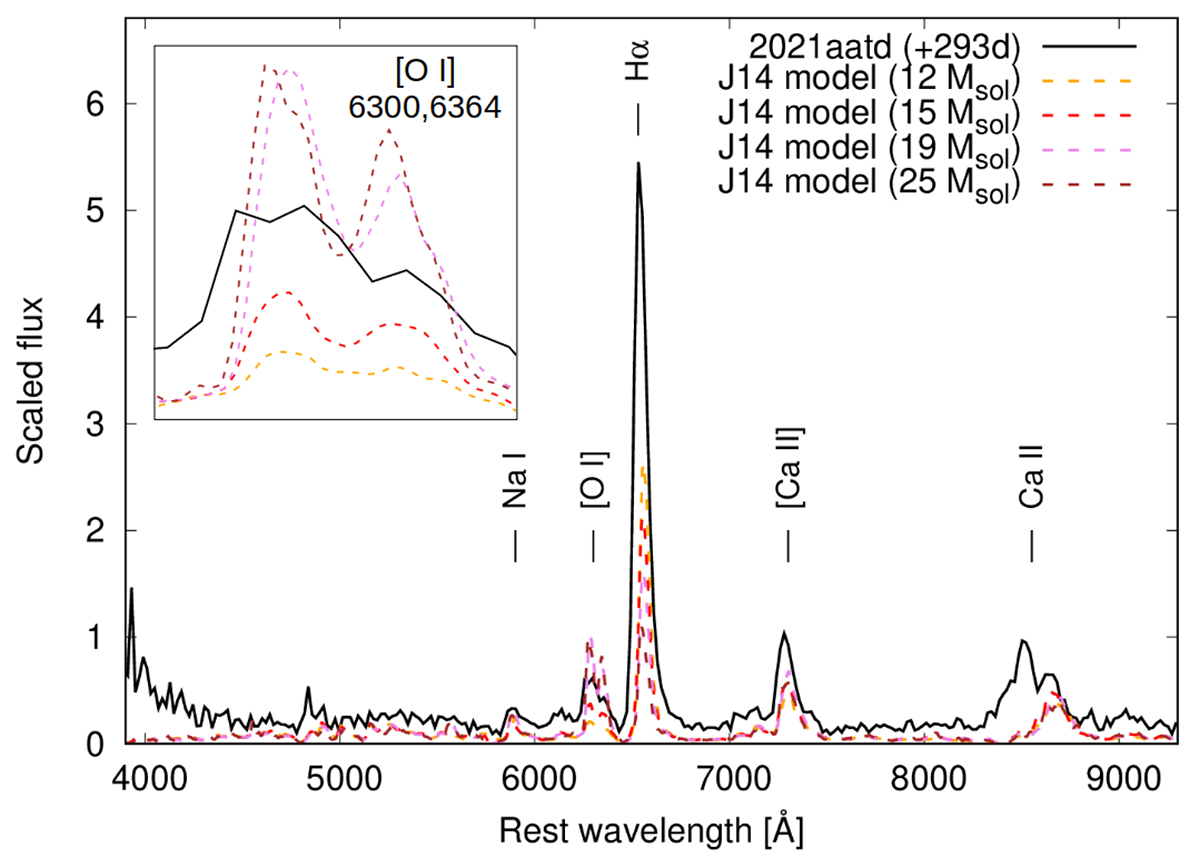
Fig. 11.
Download original image
Comparison of the +293d nebular spectrum of SN 2021aatd to the model spectra published by Jerkstrand et al. (2012, 2014). Model spectra with the closest epochs to that of the observed one (+306 days for the 12, 15, and 25 M⊙ models, and +332 days for the 19 M⊙ model) were selected; see details in text. All spectra are normalized to the flux values at 6000 Å. The [O I] line doublet (λλ6300, 6364) for the model and the observed spectra is shown in the inset; the observed line profile resembles most closely the 15 M⊙ model, suggesting that the initial mass of the progenitor is close to this value.
Current usage metrics show cumulative count of Article Views (full-text article views including HTML views, PDF and ePub downloads, according to the available data) and Abstracts Views on Vision4Press platform.
Data correspond to usage on the plateform after 2015. The current usage metrics is available 48-96 hours after online publication and is updated daily on week days.
Initial download of the metrics may take a while.