| Issue |
A&A
Volume 681, January 2024
|
|
|---|---|---|
| Article Number | A39 | |
| Number of page(s) | 19 | |
| Section | Interstellar and circumstellar matter | |
| DOI | https://doi.org/10.1051/0004-6361/202347035 | |
| Published online | 05 January 2024 | |
Laboratory investigation of shock-induced dissociation of buckminsterfullerene and astrophysical insights
1
Univ Rennes, CNRS, IPR (Institut de Physique de Rennes) – UMR 6251,
35000
Rennes,
France
e-mail: ludovic.biennier@univ-rennes.fr
2
Department of Chemistry, GITAM School of Science, GITAM Deemed-to-be-University,
Bengaluru,
India
3
Department of Physics and Astronomy, University College London,
Gower Street,
London
WC1E 6BT,
UK
4
Laboratoire de Chimie et Physique Quantiques, IRSAMC, Université Paul Sabatier,
118 Route de Narbonne,
31062
Toulouse Cedex 4,
France
5
Quantum Solid-State Physics, Department of Physics and Astronomy,
KU Leuven, Celestijnenlaan 200D,
3001
Leuven,
Belgium
6
Department of Chemistry, School of Advanced Sciences, Vellore Institute of Technology,
Vellore,
India
7
Shock Induced Materials Chemistry Lab, Solid State and Structural Chemistry Unit, Indian Institute of Science,
560012
Bangalore,
India
8
Université Paris-Saclay, CNRS, Institut des Sciences Moléculaires d’Orsay, ISMO,
91405
Orsay,
France
9
Université Grenoble Alpes/UMR CNRS 5588, Laboratoire Interdisciplinaire de Physique,
38041
Grenoble,
France
10
Laboratoire de Physique de l’École Normale Supérieure, ENS, Université PSL, CNRS, Sorbonne Université, Université Paris Cité,
75005
Paris,
France
11
Observatoire de Paris, PSL University, Sorbonne Université, LERMA,
75014
Paris,
France
12
Department of Aerospace Engineering, Indian Institute of Science,
Bangalore,
India
13
Department of Inorganic and Physical Chemistry, Indian Institute of Science,
Bangalore,
India
Received:
29
May
2023
Accepted:
6
October
2023
Fullerene C60 is one of the most iconic forms of carbon found in the interstellar medium (ISM). The interstellar chemistry of carbon-rich components, including fullerenes, is driven by a variety of energetic processes including UV and X-ray irradiation, cosmic-ray (CR) bombardment, electron impact, and shock waves. These violent events strongly alter the particle phase and lead to the release of new molecular species in the gas phase. Only a few experimental studies on the shock processing of cosmic analogs have been conducted so far. We explored in the laboratory the destruction of buckminsterfullerene C60 using a pressure-driven shock tube coupled with optical diagnostics. Our efforts were first devoted to probing in situ the shock-induced processing of C60 at high temperatures (≤ 4500 K) by optical emission spectroscopy. The analysis of the spectra points to the massive production of C2 units. A broad underlying continuum was observed as well and was attributed to the collective visible emission of carbon clusters, generated similarly in large amounts. This proposed assignment was performed with the help of calculated emission spectra of various carbon clusters. The competition between dissociation and radiative relaxation, determined by statistical analysis, alludes to a predominance of clusters with less than 40 carbon atoms. Our laboratory experiments, supported by molecular dynamics simulations performed in the canonical ensemble, suggest that C60 is very stable, and that high-energy input is required to process it under interstellar low-density conditions and to produce C2 units and an abundance of intermediate-sized carbon clusters. These results provide some insights into the life cycle of carbon in space. Our findings hint that only J-type shocks with velocities above ~100 km s−1 or C-type shocks with velocities above 9 km s−1 can lead to the destruction of fullerenes. Observational tracers of this process remain elusive, however. Our work confirms the potential of shock tubes for laboratory astrophysics.
Key words: astrochemistry / molecular processes / shock waves / methods: laboratory: molecular
© The Authors 2024
 Open Access article, published by EDP Sciences, under the terms of the Creative Commons Attribution License (https://creativecommons.org/licenses/by/4.0), which permits unrestricted use, distribution, and reproduction in any medium, provided the original work is properly cited.
This article is published in open access under the Subscribe to Open model. Subscribe to A&A to support open access publication.
1 Introduction
The propagation of shocks is frequent in astrophysical environments. Shocks accompany the birth (jets and bipolar flows; Gusdorf et al. 2015) and life of stars (stellar winds; Ioka et al. 2019), and the death (supernova and supernova remnant) of stars (Slavin et al. 2015), but also the formation of dense structures (molecular clouds) via convergent flows (Bergin et al. 2004). A better understanding of these shocks allows us to evaluate their energetic, chemical, and star formation impacts, and ultimately their role in the evolution of the interstellar medium (ISM). Although it is admitted that dust, which occupies an important place in these environments, undergoes deep alterations under the effect of shocks (Jones et al. 1996; Micelotta et al. 2010; Serra Díaz-Cano & Jones 2008; Guillet et al. 2009, 2011), the details of these processes and their extent remain poorly known. For example, large differences appear between the characteristic times of grain formation in evolved stars and rapid destruction in interstellar shocks (Bocchio et al. 2014), in particular for carbonaceous compounds (Boutéraon et al. 2019). The mechanisms that govern the evolution of carbonaceous grains (Guillet et al. 2009, 2011) or silicates (Henning 2010) unquestionably retain many gray areas. The issue is crucial because the determination of the nature of the fragments released in the gas phase could lead to the identification of new molecular tracers of shocks.
The Northern Extended Millimeter Array (NOEMA) and the Atacama Large Millimeter/sub-millimeter Array (ALMA) have opened the way to detailed studies of the molecular component of astrophysical objects such as shock regions. These measurements can now be complemented by observations from the James Webb Space Telescope (JWST), which can probe shock regions with unprecedented spatial resolution and sensitivity in the mid- and near-infrared, the preferred wavelength ranges for the detection of carbon compounds and silicates. Interstellar shocks can typically propagate with velocities between ~1 km s−1 and a few tens of thousands of km s−1, leading to post-shock temperatures ranging from a few tens of K to 109 K (Ioka et al. 2019). Early-type stars produce shock waves of velocity ≤10 km s−1. McKee & Hollenbach (1980) reported that the asymptotic giant branch (AGB) stars can generate shock waves of Mach 6 (Ludwig & Kucinskas 2012). Shock waves in circum-stellar shells of late-type stars (3 ≤ Mach ≤ 6) are considered to be key drivers for the destruction of molecules (Rudnitskij 1997). Understanding the shock processing of interstellar dust particles is essential for building up a detailed picture of dust evolution in the ISM.
Recent studies have shown that UV or energetic ion irradiation alters the physical and chemical structure of carbonaceous grain analogs and leads to the release of small hydrocarbons into the gas phase (Alata et al. 2015; Dartois et al. 2017; Pino et al. 2019). Grain alteration in shock zones, however, remains poorly understood (Guillet et al. 2009; Micelotta et al. 2010).
In the laboratory the production of shock waves can be achieved with the assistance of shock tubes. Shock tubes are widely employed to study the decomposition of chemical compounds, reaction kinetics (Bhaskaran & Roth 2002; Bauer 1965), and space weathering of solid materials (Fiege et al. 2019), but studies are often used for, and limited to, oxidizing environments related to combustion research or re-entry of spacecraft or ballistic missiles into the Earth’s atmosphere (Yasunaga et al. 2017; Vishakantaiah & Balasubramaniam 2018). However, the application of shock waves in the field of astrochemistry is scarce. Our efforts initially focused on the experimental characterization of the physico-chemical modifications of carbonaceous grain analogs induced by the passage of a shock wave in a gas mixture containing hydrogen (Biennier et al. 2017). The fullerene C60 was selected as the first target because of its emblematic character. Some other types of analogs are now being probed. Very recently, Roy et al. (2022a,b) studied the evolution of organometallic and amorphous dust particles with the aid of low-velocity shock waves.
Fullerene is an allotrope of carbon that was discovered by serendipity while performing the laser ablation of graphite to understand the formation mechanism of long-chain carbon molecules in the interstellar medium or in circumstellar shells (Kroto et al. 1985). Since their discovery, fullerenes have attracted a great deal of attention in the fields of spectroscopy, molecular electronics, medicinal chemistry, space science, among others. Recently, C60 and C70 fullerenes have been identified in the Tc1 planetary nebula and in many young stellar objects (Sellgren et al. 2009, 2010; Cami et al. 2010, 2018; García-Hernández et al. 2012; Roberts et al. 2012) through their mid-infrared emission features. Fullerenes are likely to be formed in hot hydrogen-poor and carbon-rich environments such as Wolf-Rayet stars (Cherchneff et al. 2000; Jäger et al. 2009) or R Coronae stars (Goeres & Sedlmayr 1992). However, García-Hernández et al. (2012) have shown that fullerenes can also be generated in hydrogen-rich planetary nebulae. Berné & Tielens (2012) have proposed that C60 fullerene could form in the cold environment of the ISM and that large polycyclic aromatic hydrocarbons (PAHs) can be transformed into graphene and finally to fullerenes under the influence of UV stellar radiation. Murga et al. (2022) proposed a model including these processes in ultraviolet irradiated environments. The fullerene cation  that was suspected to be the carrier of some diffuse interstellar bands (Foing & Ehrenfreund 1994) by comparison with laboratory measurements of
  in rare gas matrices (Fulara et al. 1993; Kato et al. 1991) has been firmly identified thanks to a decade of laboratory efforts and proven to be carrier of four diffuse interstellar bands (Campbell et al. 2015; Linnartz et al. 2020). Although C60 is expected in some models to be mostly neutral in the diffuse interstellar medium, C60 and
  have relatively similar abundances in that region from IR spectra considerations (see, e.g., Table 2 in Berné et al. 2017) or with an upper limit of approximately 1.3 for the
  ratio from electronic absorption bands (Rouillé et al. 2021).
For a deeper understanding of the chemical evolution of the C60 fullerenes under the influence of shock waves, ex situ and in situ chemical analyses were both performed in our group. The ex situ analysis of the solid residues using methods characterizing the physical (transmission electron microscopy and scanning electron microscopy, X-ray diffraction) and chemical structures (IR, Raman, laser desorption laser ionization mass spectrometry) were first conducted (Biennier et al. 2017) and revealed the transformation of crystalline C60 into an amorphous material. The chemical nature of the post-shock volatile products was analyzed using gas chromatography mass spectrometry (GC-MS) and cavity ringdown spectroscopy. To complete the identification of the end products, we present in the current work the in situ optical emission characterization of the shock-induced destruction of C60 at high temperature through the monitoring of some decomposition products.
The aim of this work is to contribute to the understanding of the evolution of grains, in particular in circumstellar environments, a question identified as key by the astrophysics community. The manuscript is organized as follows. The experimental methodology to investigate the in situ shock-induced chemical evolution of C60 is described in Sect. 2. The recorded emission spectra are analyzed using theoretical simulations in Sect. 3. The analysis suggests that decomposition of C60 by ejection of C2 units is a principal loss channel and that medium-sized carbon clusters are massively generated. Results of molecular dynamics simulations in the canonical approximation are provided in Sect. 4 to support the spectral investigation. This is followed by the results of statistical thermodynamic modeling in Sects. 5 and 6. The kinetics of the radiative and dissociative emission processes at stake are presented in Sect. 5, giving quantitative elements for some of the mechanisms and completing our understanding of C60 breakdown. The collective emission of carbon clusters generated by the decomposition of C60 is treated in Sect. 6. Finally, we discuss the possible astrophysical implications of our work in Sect. 7 before presenting our conclusions.
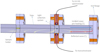 |
Fig. 1 Schematic representation of the experimental setup used to study the in situ chemical evolution of interstellar dust analogs. The emitted photons from the transient species are collected by optical fibers and directed to an optical spectrometer (STS-UV Ocean Optics) and a vacuum monochromator (Princeton VM-502). |
2 Experimental methods
The in situ chemical evolution of C60 was investigated employing a pressure-driven shock tube. The details of the shock tube apparatus are provided in a prior work (Biennier et al. 2017). Only a few elements are briefly recalled here. The shock tube used in this experiment is 8 m long with a diameter of 80 mm. The driver and driven sections are separated by a 2–3 mm thick aluminum diaphragm. The shock Mach number is determined by measuring the shock velocity with the help of three pressure transducers separated by 0.5 m each and installed on the driven section. All shock characteristics are then derived from the Mach number. The driven section is filled with ~0.025 bar of argon (Ar), while the pressure achieved in the driver section filled with helium (He) just before the diaphragm rupture is between 30 and 60 bar. A typical amount of ~10 mg of C60 micro-crystals is deposited on the sample holder 0.6 m from the end flange. The shock tube is equipped with an optical chamber designed to transversely probe in situ a slice of gas. It is connected next to the sample chamber of the shock tube farther away from the diaphragm. This optical chamber collects the emitted light through a 6 mm half-ball lens, itself connected to a STS-UV Ocean Optics micro-spectrometer and a VM-502 vacuum monochromator of Princeton series through a 200 µm bifurcated optical fiber. A schematic diagram of our in situ spectroscopic diagnostic setup is shown in Fig. 1. The spectrometer includes a photodetector array and operates between 186 and 666 nm with a low resolution of 1.4 nm, moderate signal-to-noise ratio (> 1500:1), and high dynamic range (4600:1). The recording of the spectrum is triggered by the passage on the incident shock wave. The optical emission spectra measured result from a signal integration over 10 ms. This duration exceeds the time interval during which the gas is uniformly hot, typically 2 ms, and extends into the cooling phase. Slices of gas with different temperatures are then probed. Because of the absence of a time-resolution mode of the spectrometer, no dynamic information is available from the integrated optical emission spectra. The experimental spectra obtained over an extended range of wavelengths are corrected for the spectral response of the CCD array by combining solar (300–550 nm) and halogen lamp (550– 660 nm) spectral responses. The incident and reflected shock temperatures are determined using the Gas-Eq software (Morley 2007) and are listed in Table 1. Under our experimental conditions, local thermal equilibrium (LTE) is expected because of the high pressure P reached behind the reflected shock. Adopting the simple hard-sphere model, this translates into a short mean free path Λ of C60 in argon, as calculated via the formula
 (1)
(1)
with  pm and rAr = 179 pm the kinetic radii, and kB the Boltzmann constant. The mean time between collisions τcoll can be then simply derived for C60 by
 (2)
(2)
The range of typical values of shock velocity, Mach number, incident and reflected shock temperatures, reflected shock pressure, mean free path of C60 molecules, and mean time between collisions in a selection of experiments is given in Table 1.
3 Emission spectra analysis
The first piece of the puzzle is provided by the detailed analysis of in situ emission spectra. Figure 2 presents a collection of spectra recorded under different shock conditions, as reported in Table 1. The integrated emission spectra are very rich and reveal two distinct components. The first is immediately attributed to the well known C2 Swan bands system with its very characteristic features spanning the whole 430–660 nm region (Swan 1857). The C2 radical is commonly observed in carbon vapors, plasmas, and combustion flames. To further investigate the C2 spectrum, a detailed quantum mechanical analysis was performed. The second component is a featureless broadband emission with its intensity increasing with wavelength. Molecular dynamics simulations combined with energetic considerations and spectral emission modeling of a variety of carbon species were employed to decipher the nature of this component (see Sects. 4–6). The weak features showing up between 350 and 420 nm in some spectra were assigned to CN emission. The CN radical is likely produced by the reaction of C2 with residual N2. The unwanted presence of molecular nitrogen is caused by insufficient pumping of the driven section before filling with the argon buffer gas.
Typical characteristics of the shock wave.
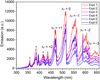 |
Fig. 2 UV–Vis emission spectra of shock-processed C60 showing C2 features and a broad continuum. The spectra were recorded under different experimental conditions, as reported in Table 1. The C2 vibronic bands were labeled according to the Herzberg (1995) notation: Δυ = υ′−υ″; υ′ and υ″ refer to the upper and lower vibrational levels, respectively. The spectral features below 420 nm flagged with an asterisk (*) were assigned to contaminants. |
3.1 Simulation of the C2 emission spectrum
The C2 radical is the simplest carbon cluster and one of the most abundant molecules in the Universe. In spite of its apparent simplicity, the electronic spectrum of C2 turns out to be very rich and complex. To date, there have been at least 19 reported electronic bands of C2 involving various electronic states of singlet, triplet, and quintet spin multiplicities. Figure 3 shows the ground (a3 Πu) and excited state (d3Πg) electronic energy levels of C2 of the Swan system along with an example of vibrational transitions. The emission spectrum of C2 was simulated under LTE using the ExoCross package developed by Yurchenko et al. (2018a). ExoCross is an open-access program1 that can simulate absorption, emission spectra, as well as various thermodynamic properties such as partition functions and specific heats from molecular line lists. It has been specifically elaborated to handle huge line lists (Tennyson & Yurchenko 2012) as a part of the ExoMol package. In this study the ExoMol molecular line lists for C2 and the associated partition function produced by Yurchenko et al. (2018b) were used, as taken from the ExoMol data base2. ExoCross allows users to include either Lorentzian, Gaussian, or Voigt line broadening parameters to incorporate the effect of pressure and temperature or both in the simulation of the absorption cross section. The Gaussian profile from Doppler broadening is expressed by the following equation (Hill et al. 2013):
 (3)
(3)
Here  is the central frequency and αfi is the half width at half maximum (HWHM). The parameter αfi in Eq. (3) is given by
 (4)
(4)
where R is the ideal gas constant and M the molar mass. In our experiment the pressure behind the reflected shock falls in the 14.4–17.4 bar range. We therefore had to include pressure broadening and employ a Voigt profile, which results from the convolution of Lorentzian and Gaussian profiles. The Lorentzian profile is expressed as
 (5)
(5)
where γL is the HWHM of the Lorentzian profile, which is given by
 (6)
(6)
with T0 and P0 the reference temperature and pressure set to 298 K and 1 bar, and nL the temperature exponent, which has been set to 1. All LTE spectra were simulated over the 4000–7500 K range as shown in Fig. 4. The simulated spectra were further convoluted with an instrumental function of Gaussian type having full width at half maximum of 1.4 nm. In order to examine the effect of pressure, we simulated the spectra of C2 at 4500 K at varying pressures over the 1–15.4 bar range, as presented in Fig. 5 for Δυ = 0. The bands exhibit many sharp features that smear out with increasing pressure.
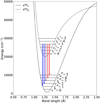 |
Fig. 3 Ground (a3Πu) and excited (d3Πg) electronic states of the Swan system of 12C2. The Δυ = +1 and +2 transitions are in blue, the Δυ = 0 transition is in purple, and the Δυ = −1 and −2 transitions are in red. |
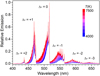 |
Fig. 4 Simulated emission spectra of C2 from 4000 to 7500 K without any convolution. All vibronic bands are labeled according to the Herzberg (1995) notation. |
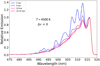 |
Fig. 5 Emission spectra of C2 for the Δυ = 0 band at 4500 K simulated for different pressures between 1 and 15.4 bar. Each spectrum is normalized to the intensity of the band-head. |
3.2 Self-absorption effects
Hot and dense media often become optically thick. As a result, emission is affected by self-absorption (Georges et al. 2019). This effect, which is clearly visible in the set of experimental spectra, strongly distorts the relative intensities of the C2 bands, and must therefore be fully taken into account. The formalism employed is detailed below. The spectral radiance of a thin slice of C2 gas of size dx can be written as
 (7)
(7)
with  the absorption cross section, n the density, and
  the blackbody radiance expressed as
 (8)
(8)
By integration over the column length l, the spectral radiance  of a column of hot C2 gas becomes
![${B_{\tilde v}}(T) = {B_{\tilde v}}^{\rm{o}}(T)\left[ {1 - \tau _{\tilde v}^{{{\rm{C}}_2}}} \right],$](/articles/aa/full_html/2024/01/aa47035-23/aa47035-23-eq18.png) (9)
(9)
with  the C2 gas transmittance, given by
 (10)
(10)
The simulation of the self-absorbed emission spectra shows that saturation effects vary strongly with both the temperature and the gas density, and affect more markedly the high-energy part of the spectrum (i.e., the Δυ = 0, +1 and +2 bands). The first task we assigned ourselves was to determine the gas temperature from the C2 spectral signature. We performed this job by comparing the rotational contour of the Δυ = −1 and −2 bands simulated for a range of temperatures with the experimental spectra. These bands were chosen because they are less impacted by saturation effects (Fig. 6). Because of the strong positive nonlinear dependence of the emission intensity on the temperature, the C2 emission of slices of gas at the highest temperature dominate the integrated spectrum. For the sake of simplicity, we therefore considered a single emission temperature. The spectroscopically determined temperature is around 4000–5200 K, which is within 10–20% below the value calculated from the determined Mach number, itself derived from the measurement of the reflected shock velocity. The observed temperature difference may in part result from heat taken from the shock for sublimating the C60 micro-crystals (Biennier et al. 2017). The insertion in the driven section of the sample holder, in the form of a thin plate, is also expected to disturb the flow and reduce the strength of the shock. The agreement between the spectroscopic and the flow temperatures is good, considering that we neglected the contribution to the integrated emission signal of slices of cooler gas (which arrive in the light collection area ~2 ms after the reflected shock rising front).
Once the temperature had been estimated, we carried out the spectral analysis to extract the C2 gas density. The inspection of the relative band intensity and profile of a collection of simulated emission spectra leads to derive best matches for C2 densities in the 1.4−2.6 × 1016 cm−3 range. Self-absorption hence gave us unique access to this parameter, difficult to quantify otherwise. Measurements reported in Table 1 were performed with a load of ~10 mg of C60. Upon complete sublimation, this leads to an estimate of C60 density of ~4.16 × 1015 cm−3, assuming that the sample occupies only a small volume between the optical chamber and the end flange. The determination of the volume in which C60 is dispersed remains a crude approximation. In our setup the distance between the detection system and the end flange is ~40 cm, which gives rise to a volume of ~2000 cm3. A complete conversion into C2 units would conduct to a concentration of 30 times the initial C60 density (i.e., 12.48 × 1016 cm−3). The derived values of C2 concentrations of 1.4−2.6 × 1016 cm−3 therefore translate into a conversion efficiency in the 10–20% range. We discuss these numbers below, together with molecular dynamics simulations.
The lower quality of the UV part of the spectra and the presence of contaminants prevent us from firmly assigning the weak and broad component near 405 nm to the C3 Swings bands, despite the recent availability of the most complete spectroscopic description (Martin-Drumel et al. 2023). Given an oscillator strength similar to that for C2, we can conclude that C3, if present, represents a very minor component, contrary to the findings by Sommer et al. (1995).
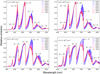 |
Fig. 6 Simulated emission spectra of C2 under LTE approximation including self-absorption for various C2 gas densities (indicated at the top left of each plot). All vibronic bands are labeled and were normalized with respect to the Δυ = 0 band at 516 nm. |
3.3 Broad emission feature
All recorded spectra exhibit a broad component whose intensity increases with the wavelength (Fig. 2), and which is reminiscent of blackbody radiation. The intensity of this broad emission peaks between 550 and 600 nm. The walls of the shock tube do not significantly heat during the passage of the shock wave and can therefore be excluded as the source of this broad emission. The source has to come from within. In terms of mathematical treatment, an additional source term therefore needs to be added to Eq. (7). By integration, the radiance hence becomes
![${B_{\tilde v}}(T) = {B_{\tilde v}}^o(T)\left[ {1 - \tau _{\tilde v}^{{C_2}} \times \tau _{\tilde v}^B} \right],$](/articles/aa/full_html/2024/01/aa47035-23/aa47035-23-eq21.png) (11)
(11)
with  the transmittance of the broad component. If we neglect the sample reflectivity, we can write
  with
with  the emissivity of this second component.
Physical and chemical considerations are used to shed some light on the nature of the emitter(s) and obtain some insights on the emissivity  . Emitters of a solid-state nature such as carbonaceous nanoparticles can be rapidly ruled out. While carbon nanostructures are commonly produced in high-temperature fast reactors, these are end-products and are generated in the cooling phase. At the temperatures of 4000–4800 K, fullerenes heavily convert into a gas of carbon clusters, as we discuss in Sect. 4. Particles, revealed by ex situ measurements, form later on behind the shock when the temperature drops through a combination of physical (condensation) and chemical (formation of covalent bonds) processes. According to recorded pressure traces, the gas remains hot (i.e., above 4500 K) for a duration of ~2 ms before the carbon vapor condenses at a rate of ~320 K ms−1. A cooler gas, as found in the expansion fan, then provides an ideal environment for promoting the formation of carbon-based particles.
Behind the reflected shock, the exposure to very high temperatures leads to the generation of carbon clusters (Sect. 4) of various sizes (from 60 carbon atoms downward) and shapes that can be classified into four main categories: cages, pretzels, flakes, and branched structures (Bonnin et al. 2019). Although we note that a few studies reveal the formation of polymeric fullerenes at high pressure and high temperature (Álvarez Murga & Hodeau 2015), this phenomenon is beyond the scope of the current study.
In the case of such carbon clusters, for high internal energies, low-lying electronic states can be populated and relax radiatively to the ground state. Because of the distribution of cluster sizes and the high number of isomers (hundreds to thousands) for each carbon cluster of a given size (medium to large), the overall emission is expected to be almost continuous. Recently, Lacinbala et al. (2022) have studied the efficiency of the infrared emission and the rates of recurrent fluorescence (Léger et al. 1988) in large carbon clusters, and Lacinbala et al. (2023a) reported that both processes are highly competitive in interstellar and circumstellar environments. Of direct implication for the current study, they showed that, at the first order in  , the emissivity
  of carbon clusters follows a second-order wavelength dependence (Lacinbala et al. 2023b)
 (12)
(12)
with  the emitted photon frequency, T the microcanonical temperature of carbon clusters, and ϵtot the total emissivity. In our study we explicitly employ the relationship below to fit the experimental results:
![${B_{\tilde v}}(T) = {B_{\tilde v}}^{\rm{o}}(T)\left[ {1 - \tau _{\tilde v}^{{{\rm{C}}_2}}\left( {1 - {_{\tilde v}}} \right)} \right].$](/articles/aa/full_html/2024/01/aa47035-23/aa47035-23-eq30.png) (13)
(13)
The total emissivities ϵtot are adjusted over the 0.05−0.1 range to reproduce the emission profiles displayed in Fig. 7.
4 Molecular dynamics simulations
Molecular dynamics (MD) simulations of the dissociation of C60 have been performed to help in the interpretation of the results and to gain some insights into the key dynamical processes. Since the discovery of buckminsterfullerene by Kroto et al. (1985), many experimental and theoretical studies have been carried out to investigate the impact of energy input on the most stable fullerene-type isomers of large carbon clusters. In this respect, structures and relative energies of different isomer were examined using different levels of theory (Zhang et al. 1992; Yi & Bernholc 1992; Zheng et al. 2005; Karton et al. 2019), while dissociation was investigated using experimental techniques (Matt et al. 1997; Vandenbosch et al. 1998; Głuch et al. 2004) and MD simulations (Xia et al. 1995; Openov & Podilivaev 2006). Several static theoretical studies focused on determining the dissociation energy of the C2 loss (Zhang et al. 1992; Diaz-Tendero et al. 2003), which is observed under all experimental conditions, were undertaken. The melting of fullerenes was also investigated by Kim & Tománek (1994), who used MD simulations with a tight-binding potential, showing in particular for C60 the appearance of a floppy phase at 3000 K and a pretzel phase at 4200 K.
In the present study, Born-Oppenheimer molecular dynamics (BOMD) simulations with a density functional tight-binding (DFTB) potential (Porezag et al. 1995) were run in the canonical ensemble. On-the-fly simulations were run up to 4 ns and extended to 6 ns in a few instances with a computation of the DFTB energy and gradient every 0.1 fs, for temperatures ranging from 3500 to 4500 K with steps of 250 K. A stochastic velocity-rescaling thermostat (Bussi et al. 2007) with a relaxation time τ of 100 ps was implemented. This large value was chosen as it is on the order of magnitude of the relaxation time of C60. However, it is not suitable to describe the evolution of smaller size systems, which are expected to have shorter relaxation times. For a given temperature, a set of 36 simulations with random velocities were run and the fragment size distributions were analyzed as a function of time. Within 4 ns of simulations, no fragmentation is observed at 3000 K. However, as shown for the 3750 K and 4500 K simulations for which the simulation length was increased to 6 ns, the system has not reached equilibrium after 4 ns and further dissociation is observed. Increasing significantly the simulation time for all the simulations presented in this work turned out to be unachievable in a reasonable time. All simulations were performed with the deMonNano code (Rapacioli et al. 2023). In order to model confinement effects, a repulsive rigid spherical potential centered on the cluster center of mass was added, as implemented in the deMonNano code, defined in Hartree by V(r) = 0.008(r − r0)4 as in the work by Oliveira et al. (2015), with r0 = 60 Å.
With respect to previous MD studies focusing on C60 isomerization and dissociation using a tight binding potential, the simulations cover a longer period of time than in the work by Kim & Tománek (1994) with extensive simulations at different temperatures allowing us to obtain branching ratios at different times and investigate a difference of dissociation regime at a given temperature. In the work by Openov & Podilivaev (2006), the focus was set on the determination of the activation energy and the Arrhenius pre-factor for the initial C2 loss with simulations run in the constant-energy, constant-volume (NVE) microcanonical ensemble. In the present work our aim is to mimic the experimental conditions as closely as possible using a particularly long relaxation time for the thermostat and a repulsive wall to mimic the confinement. To our knowledge, such extensive simulations have never been achieved.
The ratios of the different fragments as a function of time are reported in Fig. 8 for temperatures ranging from 3500 K, the lowest temperature for which dissociation was observed at 4 ns in our simulations, to 4500 K. As expected, the fragmentation rate increases with temperature. At 3500 K, the loss of a first C2 molecule (among 36 C60 parent molecules) is observed at 1700 ps. After 4 ns of simulation (6ns respectively), C2 represents the major loss pathway, amounting for almost 1% (2%) of the total number of C atoms. One C atom occasionally appears, but recombines within 100 ps with another Cn fragment. Hence, regarding large Cn clusters, those with an even number of atoms are formed by sequential loss of C2, from C58 down to C52. When increasing the temperature to 3750 K, C2 remains the major fragment at all times and its fraction increases as a function of time, reaching 10% at 4 ns (Fig. 8b). In contrast with the lower temperature, a distribution of carbon cluster sizes is also generated, clusters of smaller sizes occasionally recombining to form larger ones. When increasing the temperature to 4000 K, fragmentation becomes much more efficient (Fig. 8c). The first loss of C2 occurs at 550 ps, and up to 1.3 ns the large cluster population is dominated by C46 to C60. From 1.3 to 1.6 ns clusters with 20–30 atoms are formed, and in the 1.6–2 ns range the formation of clusters with 10–20 atoms is observed. Between 2 and 3 ns, smaller clusters of 3–10 atoms appear. Confinement leads to occasional formation of larger clusters by recombination of smaller ones (for instance the reformation of C50 is noticed), but is it not efficient enough to lead to an equilibrium composition with both small and large clusters. After 4ns, the population is dominated by carbon clusters with 2–12 atoms. The same evolution is observed at 4500 K except at shorter times: the first loss of C2 occurs at 400 ps, while a distribution of clusters (n = 48–60) is observed between 400 and 600 ps. Smaller clusters down to n = 10 then form and smaller fragments (n = 2–10) tend to dominate at shorter times (before 2 ns). Recombination is also occasionally observed, but not efficiently enough to witness the formation of an important number of larger clusters. The results of the simulations at lower temperatures (3500 K, and 3750 K to a lesser extent) are in line with experimental results as in the observation timescale, which is a few nanoseconds, C2 is the major small fragment and large clusters with more than 40 carbon atoms remain. When increasing the temperature, an increasing number of other smaller fragments with both odd and even numbers of C atoms do form. In particular, an increasing number of C3 and C5 clusters are observed, which are not formed in the experiments. In our simulations, radiative emission is not described and is expected to be much faster as the system sizes and internal energies decrease (see below). For instance, in our simulations, the internal energies of large fragments after 4ns of simulation at 3500 K lie in the range 50–68 eV for C60 and 45–60 eV for C52–58, while the internal energies of smaller fragments remain lower in all simulations. After 4 ns of simulation at 4000 K for instance, the energies of C20 lie between 15 and 20 eV, while those of C10 are found between 6 and 10 eV. As explained below, for these clusters radiative relaxation is expected to be the fastest process, preventing them from fragmenting further.
Early shock-tube experiments probing the decomposition of C60 by Sommer et al. (1995) over the 2400–3500 K range suggested the generation of a small amount of C3, detected through its 405 nm broad emission band. According to that work, C3 was produced through the reaction C2 + C2 → C3 + C. The density of C2 derived by Sommer et al. (1995) is three orders of magnitude lower than in the current work associated with higher temperatures. At first glance we should expect relatively more C3 as its precursor, C2, is much more abundant. However, the higher gas temperature in our set of experiments may open some new reaction pathways for C3. Overall these new loss terms may simply compensate the production terms and explain the limited presence, if any, of C3 in our spectra. Studies of the reactivity of C3 at high temperatures are needed to support this hypothesis.
In summary, MD simulations in the canonical ensemble show that (1) the dissociation of C60 is a process highly dependent on the temperature, (2) the decomposition is a sequential process dominated by the loss of C2 units at short times, and (3) a minimum temperature of 3500 K is necessary to observe dissociation under the nanosecond timescale. Interestingly, a change of regime is observed from major loss of C2 at 3500 K with predominance of large carbon clusters Cn (n > 40) to the formation of a broad size distribution of Cn clusters between 3500 and 4000 K. This would correspond to the conditions of formation of more amorphous and more fragile structures likely to undergo easy dissociation into fragments of various stoichiometries and structures. Notably, such a variety of fragments was also observed in collision-induced dissociation experiments undergone on C60 (Xia et al. 1995; Vandenbosch et al. 1998). Under some conditions of size and internal energy, radiative processes, not taken into account by MD simulations, can become competitive. As a consequence, the dissociation timescale derived from MD simulations is expected to increase below a certain size. This should shift the fragmentation pattern displayed in Fig. 8 toward the larger carbon cluster sizes. The introduction of radiative relaxation pathways is treated below. Additionally, it is well known that C60 is very slow to cool down (thermalize) through collisions (Stewart et al. 2013). This behavior may also hold for some of the carbon cluster isomers. As a consequence, the thermaliza-tion time constant should find itself higher than selected in the MD simulations. This should also contribute to the ‘stretching’ of the dissociation time for the largest species.
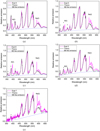 |
Fig. 7 Calculated spectra (black) compared to experimental optical emission spectra (magenta) of shock-induced C60. Self-absorption was taken into account in the simulations. Adjusted values of ∈tot, [C2], and Tgas: (a) 5.0 × 10⁻², 2.0 × 1016 cm−3, 4800 K; (b) 6.5 × 10⁻², 3.0 × 1016 cm−3, 5200 K; (c) 4.7 × 10⁻², 1.5 × 1016 cm−3, 5200 K; (d) 1.05×10⁻¹, 2.6 ×1016 cm−3, 4800 K; (e) 8.5 × 10⁻², 2.8 × 1016 cm−3, 4000 K. The bands between 350 and 440 nm flagged with an asterisk (*) were assigned to CN transitions arising from nitrogen contamination. The CN bands were simulated using the LIFBASE package (Luque & Crosley 1999) and their intensities were manually adjusted to match the experimental values. Contamination by sodium (Na I) and aluminum (Al I) was also identified. |
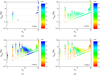 |
Fig. 8 Molecular dynamics simulations of the dissociation of C60 in the canonical approximation. The thermalization time was set to 100 ps. The confinement effects were simulated by implementing a repulsive spherical wall with a 60 Å radius. The fragmentation of C60 causes the appearance of a variety of carbon clusters Cn (n < 60) over the 3500–4500 K temperature range. nC is the number of carbon atoms in the cluster, nftag is the conversion efficiency. An example of how to read this graph: panel b, after a time of 4 ns, C60 will have fragmented into ~3 C2 units, which converts into an efficiency nftag of 10% for nC = 2. One limiting case (not seen in the simulations) is a full conversion of C60 into 30 C2 units (i.e., nfrag = 100% for nC = 2). |
5 Dissociation and radiative emission processes
Molecular dynamics simulations supplied snapshots of the unimolecular decomposition process of C60 at constant temperature (Cn+m → Cn + Cm). However, competing radiative pathways  were not taken into account in the simulations. As a result, the simulated image sequence is likely to have a great deal of distortion in comparison to the observations.
In this section, using a similar approach based on statistical thermodynamics (Lacinbala et al. 2022), we provide the radiative rates for the C60, C42, and C24 carbon clusters. Dissociative rates derived from the statistical theory of unimolecular reactions are also given over a wide temperature range. This information will be critical to evaluate the survival of carbon clusters at a given internal energy E and size. Our computational analysis relies on a database of structures collected using appropriate sampling methods (Bonnin et al. 2019), and for which the electronic excited states are also available (Dubosq et al. 2019, 2020). It was also shown consistently with the results of Kim & Tománek (1994) that the structures of carbon clusters can be classified into four main families essentially depending on their aromatic content and overall shape: cages, which include fullerenes; flakes, which can be defined as mostly planar polycyclic aromatic compounds; pretzel-like structures, with a more open character and long carbon chains; and branched structures with terminating sp carbons.
Before laying out the general theoretical framework, it is useful to recall the typical timescales associated with the various elementary radiationless processes taking place in carbon clusters. In the present case, the gas pressure during the emission is around 15 bar corresponding to a duration of ~10−10−10−12 s between two successive collisions undergone by a carbon cluster. From a general viewpoint, upon a thermal electronic excitation or induced by the absorption of a photon, large molecules such as carbon clusters or carbonaceous aromatic compounds undergo internal conversion over ~10−14−10−8 s. Intersystem crossing occurs over ~10−10−10−7 s, usually involving neighboring electronic states, until the electronic ground state is reached (Birks 1970); the excess energy is converted mainly into vibrational motion. Concomitantly, intramolecular vibrational redistribution (IVR) typically proceeds over ~10−13−10−10 s (Nesbitt & Field 1996; Quack 1990), the vibrational energy being thus redistributed among all vibrational states so that the system reaches statistical equilibrium. In the following we assume that the collisions undergone by carbon clusters maintain them at fixed internal energy. For the internal energies considered in the present work (>10eV), rotational and vibrational emissions are negligible compared to the electronic spontaneous radiative deexcitation, so we ignore them in our modeling.
For any specific isomer, the electronic radiative emission rate coefficients  associated with the transition n → 0, from the excited state n with energy hvn down to the electronic ground state and at internal energy E, can be estimated as
 (14)
(14)
with  the electronic fluorescence rate constant of the n → 0 transition and p(hvn) the probability of occupying the nth electronic state. The electronic fluorescence rate coefficients
  are obtained from the following relation (Cohen-Tannoudji et al. 1986):
 (15)
(15)
Here e is the elementary charge, me the electron mass, ɛ0 the vacuum permittivity, c the velocity of light in vacuum, and fn the electronic oscillator strength corresponding to n → 0 electronic transitions. The occupied electronic states have electronic energies very low compared to the internal energy of carbon clusters considered in the present work. This allows us to model the vibrational motion as an energy reservoir for the electronic states and calculate all pm(hvn) in the canonical framework. Then, the probability p(hvn) can be written as
 (16)
(16)
where T is the effective temperature defined by kBT = (E + Ez)/s, with E the internal energy, Ez the zero-point energy, and s = 174 the vibrational degrees of freedom.
To compute the electronic deexcitation rate constants from the electronic excited states of each isomer, we used the optical spectra determined in Dubosq et al. (2020) and obtained using self-consistent charge density-functional-based tight-binding (SCC-DFTB; Elstner et al. 1998) in its time-dependent version (Niehaus et al. 2001).
At high internal energies thermal dissociation or fragmentation can be activated, and we evaluated the propensity for these events through the traditional unimolecular reaction theories based on the Rice-Ramsperger-Kassel (RRK) framework (Robinson & Holbrook 1972). More precisely, the dissociation rate constant can be expressed within this approach simply as
 (17)
(17)
where D is the dissociation energy, and A is a pre-factor. To the best of our knowledge, no studies have been carried out on dissociation of C60 isomers. Thus, we had to make some assumptions about the pre-factor and the dissociation energies. For C60 cage carbon clusters, the only value of the pre-factor A available is that of the C60 buckminsterfullerene (i.e., A = 8 × 10²⁰ s−1; Lifshitz 2000). However, a degeneracy factor is included in the factor A and is equal to 30 for the C60 buckminsterfullerene, but equal to 1 for asymmetric C60 cages. Thus, we adopt A = 2.7 × l019 s−1 for all C60 cages. We note that the buckminsterfullerene is not included in this sample. We set the dissociation energy D = 8.5 eV for all C60 cages, corresponding approximately to the C2 dissociation energy in other fullerenes (Tomita et al. 2001; Sánchez et al. 2005; Concina et al. 2005). The zero-point energy for C60 cages is estimated to be around 9 eV. These parameters yield the dissociation rate constant curve displayed in Fig. 9a. An estimation of thermoionization rate is also displayed there. It is derived by considering parameters for the buckminsterfullerene (i.e., A = 2 × 10¹⁶ s−1 and an ionization energy set to 7.6 eV; extracted from Lifshitz 2000). For C42 cage carbon clusters and C24, a similar pre-factor, a dissociation energy of 8.5 eV (Chang et al. 2005; Sowa et al. 1991; Sánchez et al. 2005; Concina et al. 2005) and zero-point energy of 6.5 eV for C42 cages and 3 eV for C24 clusters lead to the dissociation curves shown in Figs. 9b and c. Figure 9 also shows the mean total radiative emission rates for the different families of C60, C42, and C24 carbon cluster isomers mentioned above.
Temperature-dependent rate coefficients for the first dissociation step C60 → C58 + C2 can also be derived from MD simulations. They were determined from the analysis of the time evolution of C60 over the nanosecond timescale. Values of rate coefficients  of ~5.2 × 10⁷ , 4 × 10⁸, 1 × 10⁹, and 2 × 10⁹ s−1 were derived for the temperatures T of 3500, 3750, 4000, and 4500 K respectively. Given the small size of the sample, the derived values are affected by significant uncertainties. Rate coefficients from RRK modeling were calculated for buckmin-sterfullerene for the same temperatures using the data from Figs. A.2 and 9. The
  values were found to be one to two orders of magnitude smaller: 1.2 × 10⁶, 9.6 × 10⁶, 6.3 × 10⁷, and 1.5 × 10⁹ s−1. Qualitatively, the observed difference could first be due to isomerization into less stable structures, which in turn require less energy than buckminsterfullerene to liberate a C2 unit. This process is well reproduced by MD simulations, with snapshots revealing distorted structures of cages whose relative energy with respect to that of buckminsterfullerene lies in the range 0–30 eV (Dubosq et al. 2019). In addition, the time constant adopted for the thermostat τ of 100 ps is probably too small to reproduce the relaxation time of C60 and may therefore favor fragmentation through too frequent energy injection. Finally, the difference may also come from an overestimation of the dissociation energy adopted for C60 cages.
In all cases, we note that the dissociation process is a highly complex function of the isomer as well, which further involves strong anharmonicities, making the rate constant determination quite difficult. Additionally, the RRK modeling used here for the crude evaluation of the rate constants ignores the possibility of fragmentation in electronic excited states, which for carbon clusters was also shown to be a realistic pathway (Montagnon & Spiegelman 2007).
In addition to radiative spontaneous emission and C2 thermodissociation, other processes can occur, such as delayed thermoionization and isomerization. Isomerization has been recently experimentally evidenced on the small  cluster ion (Saha et al. 2018) and should be relevant at temperatures higher than 4000 K (Kim & Tománek 1994; Bonnin et al. 2019).
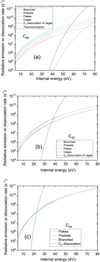 |
Fig. 9 Mean total radiative emission (electronic deexcitation) for C60 (a), C42 (b), and C24 (c) carbon clusters according to structural families (branched, pretzels, flakes, cages). C2 dissociation rates for C60 and C42 cage families are also reported, as well as the thermoionization rate for C60 cage family (panel a). Every sample contains about 1000 isomers. C24 cage carbon clusters are not considered in the present work because the associated family contains only 11 isomers. |
6 Collective emission of carbon clusters
Molecular dynamics simulations (Sect. 4) have shown that at the temperatures reached behind the shock, heavy dissociation of C60 is expected, leading to the generation of C2 and a variety of large carbon clusters Cn. Below a certain size n and internal energy, radiative cooling becomes competitive with dissociation and needs to be considered, effectively slowing down the destruction sequence (Sect. 5). We supply below some spectral details of the emission of a selection of large carbon clusters employing the approach of Lacinbala et al. (2023a). It provides a plausible explanation for the broad emission feature reported in Sect. 3.3.
To account for the population of isomers expected at such high internal energies, we combined the emission spectra obtained from individual isomers into a collective spectrum by simple summation. In the following, we consider internal energies corresponding to a gas temperature of 4000 K. At this temperature, the internal energies of C60, C42, and C24 are 50 eV, 35 eV, and 20 eV, respectively.
The emission spectra resulting from the electronic deexcitation of carbon cluster samples at gas temperatures of 4000K are shown in Fig. 10. As mentioned above, isomerization can be in competition with the radiative emission above 4000 K. We approximated the occupation probability of electronic states as corresponding to that of a thermal occupation. Then we arbitrarily assumed the multiple isomers of our samples to be uniformly distributed, treating their individual contribution in a statistical way.
Furthermore, cationic carbon clusters can also contribute to the experimentally observed emission intensity. However, the positive charge should be delocalized over the whole carbon skeleton of the carbon clusters, suggesting that electronic oscillator strengths are almost the same for neutral and cationic species. Thus, from neutral to cationic species, the average emission rate constants of all electronic states can be approximated as unchanged. Cationic species are therefore not specifically considered.
The overall emission spectra of all samples shown in Fig. 10 are blackbody-like, and the maximum of the spectra does not change. The difference between the simulated emission spectra and the blackbody emission spectrum is explained by the overall absorption cross section of the sample, which is also wavelength-dependent. Although individual carbon clusters have a molecular emission spectrum, the collective emission spectra give rise to a blackbody-like function because the electronic density of states over the whole carbon cluster sample is a continuum (Lacinbala et al. 2023b).
In light of this simulation, we can suggest that the measured broad emission component originates from the collective emission of Cn carbon cluster isomers. According to thermodynamics and calculations of the radiative and dissociative rates (Figs. A.2 and 9), at 5000 K radiative cooling becomes competitive for sizes n below 24. At the more typical temperature of 4500 K, emitters will be clusters of size n below ~40. The only requirement to observe this continuum emission spectrum is then that the number of Cn isomers is sufficient. The maximum of the emission spectra for the three sizes n = 24,42,60 is located approximately at the same wavelength, meaning that the wavelength dependence of the emissivity is quite independent from size and prevents us from estimating the carrier size of the detected broad continuum emission.
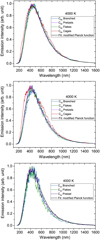 |
Fig. 10 Emission spectra from samples containing around 1000 isomers. The simulated histogram emission spectra has been broadened by a Gaussian function with FWHM = 105λ2/nm. The fit function is a modified Planck function expressed as |
![${\left[ {{\lambda ^8}\left( {\exp \left( {{{hc} \over {{k_{\rm{B}}}T\lambda }}} \right) - 1} \right)} \right]^{ - 1}}$](/articles/aa/full_html/2024/01/aa47035-23/aa47035-23-eq42.png)
7 Astrophysical implications
Although the origin of interstellar fullerenes remains unresolved, C60 is likely to form in sources where dust grains form, AGB winds or supernovae shocks. Like dust grains, C60 probably survives later even in quiescent and irradiated gas, such as reflection nebulae NGC 7023 and NGC 2023 where it was detected (Sellgren et al. 2010). Fullerene C60 has not yet been identified in supernovae remnants to the best of our knowledge, perhaps because of the lack of targeted surveys. In spite of undeniable observational advances, many aspects of the physical and chemical evolution of C60 in space remain elusive.
The present work investigates the stability of C60 by means of laboratory shock experiments combined to MD simulations and statistical modeling of relaxation processes. Below we discuss the implications of this study in the context of the much lower density astrophysical environments. We examine in the following the low-energy collisional processes that may lead to the destruction of C60. We then discuss the astrophysical significance of the work and consider the obstacles in the identification of potential tracers of these processes.
7.1 Physical conditions for destruction of C60
The stability of fullerenes was extensively investigated through laboratory experiments. Photophysics studies on C60 through multiple photon absorption experiments (e.g., Hansen & Echt 1997; Campbell et al. 2000) have highlighted the existence of a statistical regime (thermalization takes place between successive photon absorptions) in which thermoionic emission and unimolecular decay by ejection (also known as evaporation) of C2 units dominate. Insights into the photostability of C60 in photon-dominated regions (e.g., Berné et al. 2015) rests on such laboratory works. A minor regime has also been identified in which nonstatistical processes play some role (e.g., O’Brien et al. 1988; Lebeault et al. 2012), leading to the appearance of small carbon clusters that result from the multifragmentation of highly excited (~100 eV) but not thermalized C60 itself.
One can also turn to dynamics studies of collisionally excited C60 for additional insights (e.g., Bordenave-Montesquieu et al. 2001). At low energy (<1keVu−1), ionization and evaporative fragmentation following a statistical cascade scheme  have been identified as the dominant exit channels of collisions of C60 with small ions. These processes have been shown to result from direct elastic collisions with the target carbon atoms (predominant role of the nuclear stopping power). Nonstatistical knockout-driven reactions may also contribute and lead to some degree to the production of carbon atoms over a wide energy range from 20 eV to hundreds of keV (Gatchell & Zettergren 2016). At higher collision energies (keV–MeV), multi-fragmentation (explosion of the molecule into small fragments) becomes significant (Chabot et al. 2019). This mechanism takes place through an electronic excitation followed by a coupling with the vibrational modes. These high-energy collisions, such as measured experimentally by Reinköster et al. (2001) and Tsuchida et al. (1998), are fully relevant to evaluate the effects of cosmic-ray bombardment of C60 in the electronic stopping power dominant regime of interaction with CR.
In line with photophysics and ion collision studies, the current shock experiments show the dominance of the C2 ejection channel. We attempt here to derive the reaction rates for the ejection of C2 from C60 and we try to find out the conditions for this event in astrophysical environments. Figure 9, upper left, shows that C2 ejection from C60 cages prevails when the internal energy of the cages reaches around E = 53 eV. This value is consistent with the photodissociation measurements made by Lykke (1995) who already noted that C60 may accumulate up to 55 eV of internal energy before undergoing prompt fragmentation. In the statistical regime, for lower energies, the cages will first emit a visible photon (see Fig. 10) within a very short timescale (on the order of 10−5−10−8 s). At the high densities encountered in the post-shock gas of our shock-tube experiments, this timescale is still long compared to the collisional timescale on the order of 10−11 s (see Table 1).
However, in the very low-density environments found in the ISM, the photon emission is virtually instantaneous. Any excitation below 53 eV hence immediately leads to the emission of photons, and the internal energy of C60 quickly relaxes back to the ground state. On the other hand, if a single event can bring C60 to an internal energy higher than 53 eV, then a C2 molecule is instantaneously emitted. From the above considerations, we can express the rate  of the gas-phase destruction reaction of C60 with a collider X (an atom, a molecule, or a grain), C60 + X → C58 + C2 + X, as
 (18)
(18)
where the impact velocity v is on the order of the thermal velocity (8kBT/π)1/2, with μ the reduced mass between X and C60, and rx the radius of the collider. The impact velocity υ is on the order of (8E/μ)1/2 when the threshold temperature T0 = E/kB = 6.15 × 10⁵ K is reached. The threshold temperature T0 for this reaction can be obtained only in molecular J-type shocks at a velocity above ~107 km s−1 (see Eq. (10) of Lesaffre et al. 2013).
7.2 Processing of carbon clusters in shocks
Shocks are good molecular factories. Although they first bring material to high temperatures and tear it apart, once the gas has relaxed and cooled down to higher densities, fragments can reassemble to yield generally higher molecular complexity (sometimes because energy barriers have been overcome in the heated shock front). This has been widely explored for a large range of sizes and for complex organic molecules (e.g., Bergin et al. 1998; Burkhardt et al. 2019), triggering the (re-)formation of new species in the post-shock zone, otherwise impossible to produce solely from lower temperature gas-phase tenuous environments (Gusdorf 2022; Ceccarelli et al. 2022).
J-type shocks can reach large thermal velocities (above 100km s−1) and hence have the potential to break C60. For instance, AGB winds (or some strong stellar outflows, or early supernovae shocks) can impact the surrounding ISM with such high velocities, and part of the C60 contained in the winds could then yield C2 molecules. However, the temperatures obtained in such J-type shocks would be high enough to dissociate these C2 molecules, so the net effect of the C60 grinding would be to bring more C into the gas phase.
In C-type shocks (magnetized shocks for which the entrance velocity is below the magneto-sonic speed in the charged fluid, and where neutrals and charged species experience different velocities), if C60 molecules can be considered small grains, and as such they undergo charge fluctuations, they are small enough to be coupled to the magnetic field, while large grains, which also fluctuate in charge, have too much inertia and remain coupled to the neutral gas velocity (Guillet et al. 2007). In these shocks C60 can therefore undergo collisions with large grains at a velocity on the order of the drift velocity in a C-type shock (about two-thirds of the entrance velocity of the shock). A C60 molecule crash into a big grain is likely to be inelastic, and a fraction fi of the kinetic energy of the collision will be released in both the grain and the C60 molecule. This energy will then be shared between the grain and C60 with a fraction fs going to internal energy of the C60 molecule. For example, in the case of ions impacting on PAHs, Gatchell & Zettergren (2016) measured a fraction of energy input in the target fi(1 − ƒs) as large as 40%, while Deng & Echt (2004) found that collisions of 100 eV between C60 and Li+ ions can yield 30 eV of vibrational energy in C60, hence fifs > 0.3 in this case. The energy of a C60 molecule crashing into a large grain at rest reaches 53 eV for a relative velocity on the order of
 (19)
(19)
We estimate that velocity υdrift around 6km s−1 for fi = 0.8 and fs = 0.5. That relative ion-neutral velocity can be obtained already for C-type shocks on the order of 9 km s−1. C-type shocks at velocities of 9 km s−1 and above could start to affect C60 and produce C2.
Interestingly, in the case of C-type shocks the process that erodes C60 is unable to affect C2. Indeed, C2 couples to the neutral gas and does not experience high drift velocities with respect to the grains. In addition, the reduced mass of the collision with a large grain is 30 times lower than compared to C60. This is higher than the ratio of E = 53 eV compared to the dissociation energy of C2 (6.24 eV), and hence even in the case where the fraction fs.fi equals 0.4 for both C60 and C2, there is a range of impact velocities onto a large grain where C60 reaches 53 eV, but C2 does not reach 6.2 eV.
To sum up, our review of collisional processes, setting aside for the moment photodissociation processes, leads us to the following conclusion: for C-type shocks, C2 can be considered as an end product of C60 erosion, while for J-type shocks, C2 molecules generated in the decomposition of C60 are expected to be destroyed with a net effect yielding fresh free C atoms in the gas phase.
7.3 Observational links between C60 and C2
We examine potential observational ways to trace C2 originating from C60. Although the initial product of the dissociation sequence of buckminsterfullerene is well identified as C2, several factors make a direct characterization elusive. First, C2 is not easy to detect directly. Second, other routes of formation for C2 are at play, either bottom-up processes from the gas phase or top-down ones from other carbonaceous dust grain components.
As a homonuclear diatomic molecule, C2 is not detectable in interstellar space through its rotational spectrum (like H2 it has no permanent dipole moment, and in addition its abundance is much lower). As a consequence, previous studies employed C2H as a proxy for C2 (see Eq. (23)). In a systematic investigation of post-AGB stars and planetary nebulae, Schmidt & Ziurys (2017) explored a possible connection between C60 and C2H. They first claimed the correlation observed may be the result of the photoionisation and photodissociation by the interstellar radiation field (ISRF), but the same authors later remarked that the constant ratio [C2H]/[H2] rules out photoprocessing (Schmidt et al. 2018). The radical C2H has also been thoroughly searched in the NGC 253 galaxy by Holdship et al. (2021, 2022). After ruling out a photodissociation region-like origin to account for the column densities of C2H, these authors also ruled out a UV- or X-ray-driven chemistry and a shock-driven chemistry as individual alternatives to fit C2H column densities, concluding that it could be the consequence of a high cosmic ray ionization rate of (1−80)×10−14 s−1.
In contrast with the millimeter-wave spectral region, the C2 fingerprints are identified in the visible range in diffuse interstellar clouds through several absorption lines belonging to the Phillips and Mulliken systems (Cecchi-Pestellini & Dalgarno 2002). A class of very weak diffuse interstellar bands (DIBs), mostly in the blue part of the optical spectrum, have been correlated with high column densities of C2 and dubbed C2-DIBs (Thorburn et al. 2003; Galazutdinov et al. 2006; Kazmierczak et al. 2014). These observations suggest a tight chemical link between C2 and the DIB carriers in such diffuse environments pointing to carbon-rich species. In Sects. 7.4 and 7.5, we give a short review of various sources of C2 in interstellar and circumstellar environments.
7.4 Multiple sources of C2: The bottom-up route
The smallest carbon cluster C2 is also formed from bottom-up warm gas-phase reactions. The sequence leading to C2 is thought to start with the reaction (see Holdship et al. 2021 and references therein)
 (20)
(20)
Once formed,  can react with H2
 (21)
(21)
with a dominating branching into the first channel. Dissociative recombination of the main product with electrons can then generate C2 through
 (22)
(22)
with the first two exit channels prevailing over the last one. The relative efficiency of all processes evoked depends on many factors, such as the temperature of the environment considered or the ionization fraction. Neutral C2 can then be converted into C2H through the reaction
 (23)
(23)
which is subject to a 4000 K energy barrier (Kruse & Roth 1997). These temperatures are obtained in shocks already at velocities of 9 km s−1 (Lesaffre et al. 2013), which should be rather common in the ISM near dynamical environments, and could reveal the presence of C2 in their pre-shock gas.
7.5 Other top-down sources of C2
One of the additional difficulties of a characterization of C2 originating from C60 is the competition between top-down processes producing C2 and C2H from grains and their building blocks. Of all the components of dust, PAHs should be examined as they are thought to sequester up to 5% of elemental carbon, while only a small fraction of the elemental C (10−5 to 10−2) is locked into C60 (see Table 2 in Berné et al. 2017). In the absence of relevant shock-tube work on the high-temperature pyrolysis of PAHs, we can first turn to photodissociation studies to get some insights into the breakdown patterns. Laboratory photophysics studies have shown that small PAHs have multiple photofragmentation channels that include H-loss and C2H2-loss (Jochims et al. 1994; West et al. 2014; Simon et al. 2017). For large PAHs, fragmentation takes place almost exclusively through sequential hydrogen loss (Ekern et al. 1998; Zhen et al. 2014; Berné et al. 2015; Montillaud et al. 2013). The C2-loss channel is expected to take over only when large PAHs are fully dehydrogenated. We can also learn from collisional studies of PAHs with high-energy ions. Stockett et al. (2014) have shown for instance that for interstellar PAHs containing more than 50 carbon atoms at typical supernova shock wave energies, nonstatistical fragmentation processes play a major role, contrary to the case of fullerenes (Gatchell & Zettergren 2016). These so-called knockout reactions would lead then to the release of CHx or H fragments from PAHs. In a recent study employing an ion storage ring, Gatchell et al. (2021) have shown that defective PAHs can be produced in energetic collisions with heavy particles. They may then play an important role in interstellar chemistry due to their increased reactivity compared to intact PAHs. We note that other dust components beyond PAHs should also be considered; for example, (hydrogenated-)amorphous carbons also contain a significant fraction of elemental carbon, often higher than that of PAHs, required to model the diffuse ISM extinction (e.g., Jones et al. 2017; Zubko et al. 2004; Herrero et al. 2022; Dartois 2019).
From all these considerations, assessing whether a more uni-vocal link between C2/C2H and C60 can be sketched appears to be a long and winding road. Near-future prospects are proposed and discussed in next section.
7.6 Potential observational targets
The present work explores the stability of fullerenes and discusses possible tracers of their processing. Potential connections between C60 and C2 in astrophysical environments have been examined based on laboratory findings and past astronomical observations. Despite a clearly identified dominant destruction route in experimental and theoretical studies, the obstacles toward linking C60 and C2 in the ISM in a univocal manner appear insurmountable. The first issue identified is the competition between multiple sources of the carbon dimer. Indeed, C2 can be formed through warm gas-phase bottom-up processes and through top-down routes from other carbon dust building blocks. Moreover, the harsh physical conditions identified to break C60 (i.e., high-velocity shocks) are likely detrimental to the survival of C2. We have shown that C-type shocks with velocities above 9 km s−1 are the only environments that could selectively lead to the destruction of C60 but not C2. Spatially resolved infrared observations covering the pre-shock and post-shock regions combined to millimeter-wave observations of C2H would be needed to map out the processing of C60. To get a good contrast, one would also require a UV radiation field high enough (in terms of photon energy) to excite C60 and detect consecutively its relaxation by emission of IR photons, but low enough to prevent the dissociation of C2 into C(3P) + C(3P) (below its dissociation energy of 6.24 eV; Borsovszky et al. 2021). This obviously puts some additional constraints on the targets.
As suggested by molecular dynamics simulations, other small carbonaceous products, presumably more specific to top-down pathways since their production efficiency by bottom-up chemical reactions is expected to be low, could alternatively trace the destruction of dehydrogenated carbonaceous matter, including C60. Small carbon chains, such as CxH with x ≈ 3–8 (corresponding to the lower end of the carbon cluster distribution), or their ions, may be observable and thus worth exploring in parallel and correlating with the spatial distribution of species in such observations. Their large dipole moment may compensate for an expected lower abundance. Rather than engaging in a quest to connect C60 and C2, this work instead suggests searching for the presence of carbon clusters (and their hydrogenated counterparts) in shock environments that would connect to the larger family of carbon-rich dust components.
The best environment to engage in a multiple-species, multi-wavelength search would be a region where a shock has already been identified and characterized, and where indications exist of the presence of carbonaceous grains. The latter condition requires detecting continuum emission, which is possible where a UV radiation field is illuminating the shock region. However, this UV field should not be too strong such that the molecular products resulting from the degradation of the carbonaceous grains are not completed destroyed. For these reasons, protostellar outflows around massive stars (like G5.89-00.39; e.g., Leurini et al. 2015) and supernova remnants (IC443 and W28, or slightly less evolved ones) might be the first places to look. We note that two existing sub-millimeter surveys toward evolved supernovae remnants have detected C2H (van Dishoeck et al. 1993; Mazumdar et al. 2022).
Overall, however, the main finding of this work has been to highlight the stability of C60 against high-velocity shocks. Only J-type shocks with velocities above ~ 100 km s−1 can lead to the destruction of C60 and its products through collisions with the neutral gas. Through collisions with large grains, C-type shocks also appear to have the potential to break C60. Once formed, fullerenes should exhibit very long lifetimes as they resist most shocks and photodestruction. Only cosmic rays have been shown to be able to destroy C60, but considering the CR flux, the yield is very low (Chabot et al. 2019).
8 Concluding remarks
We have explored in this work the in situ shock processing of C60 below 4500 K employing a pressure-driven shock tube combined with optical emission spectroscopy diagnostics. The recorded spectra systematically display the distinctive emission signature of the C2 Swan bands as well as a broad underlying continuum. The C2 emission was analysed by comparison with simulated spectra. Further investigation revealed that the recorded spectra were affected by self-absorption. This effect allowed us to estimate the concentration of C2 radicals inside the shock tube. The broad underlying emission was attributed to the blackbody-like emission from various carbon clusters of less than 40 carbon atoms in size. This assignment was made on the basis of kinetic and thermodynamic arguments and on simulated collective emission spectra. Molecular dynamics simulations in the canonical approach were performed for a deeper understanding of the key processes occurring during the interaction of C60 and the shock wave. MD simulations pointed to the massive production of C2 in the initial stages of decomposition. They further showed that carbon clusters of intermediate sizes were generated later on in the sequential dissociation process. Fragmentation should be less efficient than predicted by MD because of the competition with radiative processes coming into play, and unaccounted for, for sizes typically below 40 carbon atoms.
In the present work, we assigned the thermal emission to carbon clusters of intermediate size. Future investigations could focus on the abundance ratio of thermal emission carriers to C2 in the shock tube as a function of the Mach number and the incident shock temperature. Such studies could provide valuable information about the stability of fullerenes in shock waves. Impeding shock experiments will probe the dynamics of the destruction processes of dust analogs on the microsecond timescale with the help of a fast optical spectrometer.
In terms of astrophysical implications, we failed to establish a link between C60 and its dominant decomposition product C2. Our results instead highlight the high stability of fullerenes in shocked regions. Our analysis suggests that only high-energy input, provided by collisions with the neutral gas in high-velocity J-type shocks, or through collisions with grains in C-type shocks, can lead to the efficient destruction of C60 and to the generation of a variety of carbon clusters. The decomposition sequence is expected to stop midway at intermediate sizes, due to the takeover by radiative relaxation processes. The main finding of this work on the destruction of C60 is, paradoxically, its resistance to interstellar shocks. Accordingly, this work encourages us to explore the role that shocks might play in the formation of fullerenes.
Acknowledgements
We are grateful to J. Courbe for the mechanical design of the optical chamber. The authors thank the Indo-French Center for the Promotion of Advanced Research (CEFIPRA/IFCPAR) under project # 6005-2. The support from ANR FULLDIBS project funded by the French Research National Agency (grant ANR-20-CE31-0014) is acknowledged. We thank the computational facility of the Institute of Chemistry of Rennes. A.S. thanks the computing mesocenter CALMIP (“CALcul en MIdi Pyrénées”, UAR3667 of CNRS) for generous allocation of computer resources (project P17002). We also acknowledge support from the CNRS-INSU Programme National de Physique Stellaire (PNPS) and Programme National de Physique et Chimie du Milieu Interstellaire (PCMI) of CNRS/INSU with INC/INP and cofunded by CEA and CNES. This work greatly benefited from discussion with F. Goulay. S.Y. thanks the European Research Council under Advanced Investigator Project 883830 for support. Finally, the authors would like to thank the reviewer whose comments contributed to a significant improvement of the manuscript.
Appendix A Thermodynamics of carbon clusters
Some thermodynamics properties are gathered in this Appendix. Behind the shock, the kinetic energy is transferred to C60 leading to sublimation and triggering dissociation. We have seen that the decomposition of C60 is a sequential process that is driven by the energy available to each of the intermediate clusters.
We calculated the internal energy of various carbon clusters over the 0 – 5000 K range, as shown in Fig. A.1. The coordinates of various carbon clusters Cn were chosen from a database (Tománek 2014). Among the various possible isomers of carbon clusters we selected the most stable ones, mostly belonging to the cage family. The calculated internal energy of the various isomers is nonetheless found to be weakly dependent of the geometry of the clusters.
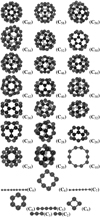 |
Fig. A.1 Geometries of the carbon clusters to simulate the internal energies in canonical approximation. The geometries of the lowest energy clusters are from Tománek (2014) and Song et al. (2021), and their harmonic frequencies were calculated using B3LYP level of theory in conjunction with the 6-31G* basis set. |
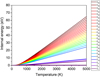 |
Fig. A.2 Internal energy vs. temperature of the carbon clusters displayed in Fig. A.1 computed in the canonical approximation. The whole sequence starting with the dissociation of C60 is driven by the internal energy available to the intermediate cluster. |
The harmonic frequencies of the most stable geometries were calculated using the B3LYP level of theory and in conjunction with the 6-31G* basis set, as implemented in the Gaussian 16 suite of programs (Frisch et al. 2016).
The internal energy of each cluster was calculated and its density of states evaluated using the Beyer-Swinehart direct count method (Beyer & Swinehart 1973). The contribution of the ZPE was considered for the simulation of the density of states. The internal energy of the clusters under the micro canonical approximation is given by
![${\left( {{k_B}T} \right)^{ - 1}} = {\partial \over {\partial E}}\left[ {1n\left( {\rho \left( E \right)} \right)} \right],$](/articles/aa/full_html/2024/01/aa47035-23/aa47035-23-eq52.png) (A.1)
(A.1)
where ρ(E) denotes the density of states and E the internal energy in excess. Figure A.2 presents the variation of internal energy of various carbon clusters from C60 to C7. At high temperature, the internal energy of the molecule varies linearly with T. At 5000 K the internal energy of C60 reaches the high value of ~63 eV. Lépine & Bordas (2004) studied the kinetic energy distribution of thermal electrons emitted form highly energized C60 clusters. They estimated the internal energy of the carbon clusters at various temperatures using the empirical equations as follows:
 (A.2)
(A.2)
Our results for C60 agree well with the expression derived by Lépine & Bordas (2004).
Appendix B Graphical representation of the shock-induced destruction pathways of C60
We provide here a graphical representation of the shock-induced destruction pathways of C60. Only high-energy input (such as high-velocity shocks) is able to sufficiently raise the internal energy of the carbon clusters to initiate the destruction sequence and lead to the ejection of C2 units.
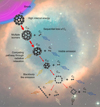 |
Fig. B.1 Shock-induced destruction pathways of C60 in the laboratory under constant temperature conditions. The shock-induced pressure rise leads to rapid collisional heating of C60. The high internal energy acquired initiates a sequential process starting with fragmentation into C58 + C2. The break-up of the larger fragment continues, driven by the internal energy remaining in it or acquired through collisions with the bath gas. Below a certain size (less than ~40 carbon atoms), the energy can also be dissipated radiatively (Sect. 5) slowing down the fragmentation process. Because of the presence of hundreds to thousands of isomers for each carbon cluster between 20 and 40 carbon atoms, spectral features are blurred out and the overall emission appears blackbody-like. |
References
- Alata, I., Jallat, A., Gavilan, L., et al. 2015, A&A, 584, A123 [NASA ADS] [CrossRef] [EDP Sciences] [Google Scholar]
- Álvarez Murga, M., & Hodeau, J. 2015, Carbon, 82, 381 [CrossRef] [Google Scholar]
- Bauer, S. H. 1965, Ann. Rev. Phys. Chem., 16, 245 [NASA ADS] [CrossRef] [Google Scholar]
- Bergin, E. A., Melnick, G. J., & Neufeld, D. A. 1998, ApJ, 499, 777 [Google Scholar]
- Bergin, E. A., Hartmann, L. W., Raymond, J. C., & Ballesteros-Paredes, J. 2004, ApJ, 612, 921 [NASA ADS] [CrossRef] [Google Scholar]
- Berné, O., & Tielens, A. G. 2012, Proc. Natl. Acad. Sci. U.S.A., 109, 401 [CrossRef] [Google Scholar]
- Berné, O., Montillaud, J., & Joblin, C. 2015, A&A, 577, A133 [NASA ADS] [CrossRef] [EDP Sciences] [Google Scholar]
- Berné, O., Cox, N. L. J., Mulas, G., & Joblin, C. 2017, A&A, 605, A1 [NASA ADS] [CrossRef] [EDP Sciences] [Google Scholar]
- Beyer, T., & Swinehart, D. F. 1973, Commun. ACM, 16, 379 [CrossRef] [Google Scholar]
- Bhaskaran, K., & Roth, P. 2002, Prog. Energy Combust. Sci., 28, 151 [CrossRef] [Google Scholar]
- Biennier, L., Jayaram, V., Suas-David, N., et al. 2017, A&A, 599, A42 [NASA ADS] [CrossRef] [EDP Sciences] [Google Scholar]
- Birks, J. B. 1970, Photophysics of Aromatic Molecules, 704 (New York: Wiley) [Google Scholar]
- Bocchio, M., Jones, A. P., & Slavin, J. D. 2014, A&A, 570, A32 [NASA ADS] [CrossRef] [EDP Sciences] [Google Scholar]
- Bonnin, M. A., Falvo, C., Calvo, F., Pino, T., & Parneix, P. 2019, Phys. Rev. A, 99, 042504 [NASA ADS] [CrossRef] [Google Scholar]
- Bordenave-Montesquieu, D., Moretto-Capelle, P., Bordenave-Montesquieu, A., & Rentenier, A. 2001, J. Phys. B: At. Mol. Opt. Phys., 34, L137 [NASA ADS] [CrossRef] [Google Scholar]
- Borsovszky, J., Nauta, K., Jiang, J., et al. 2021, Proc. Nat. Acad. Sci. U.S.A., 118, e2113315118 [NASA ADS] [CrossRef] [Google Scholar]
- Boutéraon, T., Habart, E., Ysard, N., et al. 2019, A&A, 623, A135 [NASA ADS] [CrossRef] [EDP Sciences] [Google Scholar]
- Burkhardt, A. M., Shingledecker, C. N., Le Gal, R., et al. 2019, ApJ, 881, 32 [Google Scholar]
- Bussi, G., Donadio, D., & Parrinello, M. 2007, J. Chem. Phys., 126, 014101 [NASA ADS] [CrossRef] [Google Scholar]
- Cami, J., Bernard-Salas, J., Peeters, E., & Malek, S. E. 2010, Science, 329, 1180 [NASA ADS] [CrossRef] [Google Scholar]
- Cami, J., Peeters, E., Bernard-Salas, J., Doppmann, G., & De Buizer, J. 2018, Galaxies, 6, 101 [NASA ADS] [CrossRef] [Google Scholar]
- Campbell, E. E. B., Hansen, K., Hoffmann, K., et al. 2000, Phys. Rev. Lett., 84, 2128 [Google Scholar]
- Campbell, E. K., Holz, M., Gerlich, D., & Maier, J. P. 2015, Nature, 523, 322 [NASA ADS] [CrossRef] [Google Scholar]
- Ceccarelli, C., Codella, C., Balucani, N., et al. 2022, ArXiv e-prints [arXiv:2206.13270] [Google Scholar]
- Cecchi-Pestellini, C., & Dalgarno, A. 2002, MNRAS, 331, L31 [NASA ADS] [CrossRef] [Google Scholar]
- Chabot, M., Béroff, K., Dartois, E., Pino, T., & Godard, M. 2019, ApJ, 888, 17 [NASA ADS] [CrossRef] [Google Scholar]
- Chang, Y., Zhang, J., Sun, H., et al. 2005, Int. J. Quant. Chem., 105, 142 [NASA ADS] [CrossRef] [Google Scholar]
- Cherchneff, I., Le Teuff, Y. H., Williams, P. M., & Tielens, A. G. G. M. 2000, A&A, 357, 572 [NASA ADS] [Google Scholar]
- Cohen-Tannoudji, C., Diu, B., & Laloe, F. 1986, Quantum Mechanics, 2 (John Wiley & Sons), 626 [Google Scholar]
- Concina, B., Gluch, K., Matt-Leubner, S., et al. 2005, Chem. Phys. Lett., 407, 464 [NASA ADS] [CrossRef] [Google Scholar]
- Dartois, E. 2019, C, 5, 80 [Google Scholar]
- Dartois, E., Chabot, M., Pino, T., et al. 2017, A&A, 599, A130 [Google Scholar]
- Deng, R., & Echt, O. 2004, Int. J. Mass Spectrom., 233, 1 [NASA ADS] [CrossRef] [Google Scholar]
- Diaz-Tendero, S., Manuel, A., & Martin, F. 2003, J. Chem. Phys., 119, 5545 [NASA ADS] [CrossRef] [Google Scholar]
- Dubosq, C., Falvo, C., Calvo, F., et al. 2019, A&A, 625, L11 [Google Scholar]
- Dubosq, C., Calvo, F., Rapacioli, M., et al. 2020, A&A, 634, A62 [Google Scholar]
- Ekern, S. P., Marshall, A. G., Szczepanski, J., & Vala, M. 1998, J. Phys. Chem. A, 102, 3498 [NASA ADS] [CrossRef] [Google Scholar]
- Elstner, M., Porezag, D., Jungnickel, G., et al. 1998, Phys. Rev. B, 58, 7260 [CrossRef] [Google Scholar]
- Fiege, K., Guglielmino, M., Altobelli, N., et al. 2019, J. Geophys. Res.: Planets, 124, 1084 [NASA ADS] [CrossRef] [Google Scholar]
- Foing, B. H., & Ehrenfreund, P. 1994, Nature, 369, 296 [NASA ADS] [CrossRef] [Google Scholar]
- Frisch, M. J., Trucks, G. W., Schlegel, H. B., et al. 2016, Gaussian 16 Revision A.03 (Wallingford, CT: Gaussian Inc.) [Google Scholar]
- Fulara, J., Jakobi, M., & Maier, J. P. 1993, Chem. Phys. Lett., 211, 227 [NASA ADS] [CrossRef] [Google Scholar]
- Galazutdinov, G. A., Gnacinski, P., Han, I., et al. 2006, A&A, 447, 589 [NASA ADS] [CrossRef] [EDP Sciences] [Google Scholar]
- García-Hernández, D. A., Villaver, E., García-Lario, P., et al. 2012, ApJ, 760, 107 [CrossRef] [Google Scholar]
- Gatchell, M., & Zettergren, H. 2016, J. Phys. B: At. Mol. Opt. Phys., 49, 162001 [NASA ADS] [CrossRef] [Google Scholar]
- Gatchell, M., Ameixa, J., Ji, M., et al. 2021, Nat. Commun., 12, 6646 [NASA ADS] [CrossRef] [Google Scholar]
- Goeres, A., & Sedlmayr, E. 1992, A&A, 265, 216 [NASA ADS] [Google Scholar]
- Georges, R., Thiévin, J., Benidar, A., et al. 2019, Rev. Sci. Inst., 90, 093103 [NASA ADS] [CrossRef] [Google Scholar]
- Głuch, K., Matt-Leubner, S., Echt, O., et al. 2004, J. Chem. Phys., 121, 2137 [CrossRef] [Google Scholar]
- Guillet, V., Pineau Des Forêts, G., & Jones, A. P. 2007, A&A, 476, 263 [NASA ADS] [CrossRef] [EDP Sciences] [Google Scholar]
- Guillet, V., Jones, A. P., & Pineau Des Forêts, G. 2009, A&A, 497, 145 [NASA ADS] [CrossRef] [EDP Sciences] [Google Scholar]
- Guillet, V., Pineau des Forêts, G., & Jones, A. P. 2011, A&A, 527, A123 [NASA ADS] [CrossRef] [EDP Sciences] [Google Scholar]
- Gusdorf, A. 2022, in Eur. Phys. J. Web Conf., 265, 00035 [NASA ADS] [CrossRef] [EDP Sciences] [Google Scholar]
- Gusdorf, A., Riquelme, D., Anderl, S., et al. 2015, A&A, 575, A98 [CrossRef] [EDP Sciences] [Google Scholar]
- Hansen, K., & Echt, O. 1997, Phys. Rev. Lett., 78, 2337 [Google Scholar]
- Henning, T. 2010, ARA&A, 48, 21 [Google Scholar]
- Herrero, V. J., Jiménez-Redondo, M., Peláez, R. J., Maté, B., & Tanarro, I. 2022, Front. Astron. Space Sci., 9, 1083288 [CrossRef] [Google Scholar]
- Herzberg, G. 1995, Molecular Spectra and Molecular Structure. Vol. 1: Spectra of Diatomic Molecules (New York: Van Nostrand Reinhold) [Google Scholar]
- Hill, C., Yurchenko, S. N., & Tennyson, J. 2013, Icarus, 226, 1673 [NASA ADS] [CrossRef] [Google Scholar]
- Holdship, J., Viti, S., Martín, S., et al. 2021, A&A, 654, A55 [NASA ADS] [CrossRef] [EDP Sciences] [Google Scholar]
- Holdship, J., Mangum, J. G., Viti, S., et al. 2022, ApJ, 931, 89 [NASA ADS] [CrossRef] [Google Scholar]
- Ioka, K., Levinson, A., & Nakar, E. 2019, MNRAS, 484, 3502 [NASA ADS] [CrossRef] [Google Scholar]
- Jäger, C., Huisken, F., Mutschke, H., Jansa, I. L., & Henning, T. 2009, ApJ, 696, 706 [CrossRef] [Google Scholar]
- Jochims, H. W., Ruhl, E., Baumgartel, H., Tobita, S., & Leach, S. 1994, ApJ, 420, 307 [NASA ADS] [CrossRef] [Google Scholar]
- Jones, A. P., Tielens, A. G. G. M., & Hollenbach, D. J. 1996, ApJ, 469, 740 [Google Scholar]
- Jones, A. P., Köhler, M., Ysard, N., Bocchio, M., & Verstraete, L. 2017, A&A, 602, A46 [NASA ADS] [CrossRef] [EDP Sciences] [Google Scholar]
- Karton, A., Waite, S. L., & Page, A. J. 2019, J. Phys. Chem. A, 123, 257 [NASA ADS] [CrossRef] [Google Scholar]
- Kato, T., Kodama, T., Shida, T., et al. 1991, Chem. Phys. Lett., 180, 446 [NASA ADS] [CrossRef] [Google Scholar]
- Kazmierczak, M., Schmidt, M., Weselak, T., Galazutdinov, G., & Krelowski, J. 2014, in The Diffuse Interstellar Bands, 297, eds. J. Cami, & N. L. J. Cox, 121 [NASA ADS] [Google Scholar]
- Kim, S. G., & Tománek, D. 1994, Phys. Rev. Lett., 72, 2418 [CrossRef] [PubMed] [Google Scholar]
- Kroto, H. W., Heath, J. R., O’Brien, S. C., Curl, R. F., & Smalley, R. E. 1985, Nature, 318, 162 [NASA ADS] [CrossRef] [Google Scholar]
- Kruse, T., & Roth, P. 1997, J. Phys. Chem. A, 101, 2138 [NASA ADS] [CrossRef] [Google Scholar]
- Lacinbala, O., Calvo, F., Dubosq, C., et al. 2022, J. Chem. Phys., 156, 144305 [NASA ADS] [CrossRef] [Google Scholar]
- Lacinbala, O., Calvo, F., Dartois, E., et al. 2023a, A&A, 671, A89 [NASA ADS] [CrossRef] [EDP Sciences] [Google Scholar]
- Lacinbala, O., Calvo, F., Falvo, C., et al. 2023b, Phys. Rev. A, 107, 062808 [NASA ADS] [CrossRef] [Google Scholar]
- Lebeault, M.-A., Baguenard, B., Concina, B., et al. 2012, J. Chem. Phys., 137, 054312 [NASA ADS] [CrossRef] [Google Scholar]
- Léger, A., Boissel, P., & d’Hendecourt, L. 1988, Phys. Rev. Lett., 60, 921 [Google Scholar]
- Lépine, F., & Bordas, C. 2004, Phys. Rev. A, 69, 053201 [CrossRef] [Google Scholar]
- Lesaffre, P., Pineau des Forêts, G., Godard, B., et al. 2013, A&A, 550, A106 [NASA ADS] [CrossRef] [EDP Sciences] [Google Scholar]
- Leurini, S., Wyrowski, F., Wiesemeyer, H., et al. 2015, A&A, 584, A70 [NASA ADS] [CrossRef] [EDP Sciences] [Google Scholar]
- Lifshitz, C. 2000, Int. J. Mass Spectrom., 198, 1 [NASA ADS] [CrossRef] [Google Scholar]
- Linnartz, H., Cami, J., Cordiner, M., et al. 2020, J. Mol. Spectrosc., 367, 111243 [NASA ADS] [CrossRef] [Google Scholar]
- Ludwig, H.-G., & Kucinskas, A. 2012, A&A, 547, A118 [NASA ADS] [CrossRef] [EDP Sciences] [Google Scholar]
- Luque, J., & Crosley, D. R. 1999, LIFBASE version 2.1, SRI International, https://www.sri.com/platform/lifbase-spectroscopy-tool/ [Google Scholar]
- Lykke, K. R. 1995, Phys. Rev. A, 52, 1354 [NASA ADS] [CrossRef] [Google Scholar]
- Martin-Drumel, M.-A., Zhang, Q., Doney, K. D., et al. 2023, J. Mol. Spectrosc., 391, 111734 [NASA ADS] [CrossRef] [Google Scholar]
- Matt, S., Echt, O., Worgotter, R., et al. 1997, Int. J. Mass Spectrom., 167/168, 753 [CrossRef] [Google Scholar]
- Mazumdar, P., Tram, L. N., Wyrowski, F., Menten, K. M., & Tang, X. 2022, A&A, 668, A180 [NASA ADS] [CrossRef] [EDP Sciences] [Google Scholar]
- McKee, C. P., & Hollenbach, D. J. 1980, ArA&A, 18, 219 [NASA ADS] [CrossRef] [Google Scholar]
- Micelotta, E. R., Jones, A. P., & Tielens, A. G. G. M. 2010, A&A, 510, A36 [NASA ADS] [CrossRef] [EDP Sciences] [Google Scholar]
- Montagnon, L., & Spiegelman, F. 2007, Euro. Phys. J. D, 43, 7 [NASA ADS] [CrossRef] [Google Scholar]
- Montillaud, J., Joblin, C., & Toublanc, D. 2013, A&A, 552, A15 [NASA ADS] [CrossRef] [EDP Sciences] [Google Scholar]
- Morley, C. 2007, GasEQ: A Chemical Equilibrium Program for Windows [Google Scholar]
- Murga, M. S., Akimkin, V. V., & Wiebe, D. S. 2022, MNRAS, 517, 3732 [CrossRef] [Google Scholar]
- Nesbitt, D. J., & Field, R. W. 1996, J. Phys. Chem., 100, 12735 [Google Scholar]
- Niehaus, T. A., Suhai, S., Della Sala, F., et al. 2001, Phys. Rev. B, 63, 085108 [NASA ADS] [CrossRef] [Google Scholar]
- O’Brien, S. C., Heath, J. R., Curl, R. F., & Smalley, R. E. 1988, J. Chem. Phys., 88, 220 [CrossRef] [Google Scholar]
- Oliveira, L. F. L., Cuny, J., Morinière, M., et al. 2015, Phys. Chem. Chem. Phys., 17, 17079 [NASA ADS] [CrossRef] [Google Scholar]
- Openov, L., & Podilivaev, A. 2006, JETP Lett., 84, 68 [NASA ADS] [CrossRef] [Google Scholar]
- Pino, T., Chabot, M., Béroff, K., et al. 2019, A&A, 623, A134 [NASA ADS] [CrossRef] [EDP Sciences] [Google Scholar]
- Porezag, D., Frauenheim, T., Köhler, T., Seifert, G., & Kaschner, R. 1995, Phys. Rev. B, 51, 12947 [NASA ADS] [CrossRef] [Google Scholar]
- Quack, M. 1990, Annu. Rev. Phys. Chem., 41, 839 [NASA ADS] [CrossRef] [Google Scholar]
- Rapacioli, M., Heine, T., Dontot, L., et al. 2023, deMonNano experiment, http://demon-nano.ups-tlse.fr/ [Google Scholar]
- Reinköster, A., Werner, U., Kabachnik, N. M., & Lutz, H. O. 2001, Phys. Rev. A, 64, 023201 [CrossRef] [Google Scholar]
- Roberts, K. R. G., Smith, K. T., & Sarre, P. J. 2012, MNRAS, 421, 3277 [CrossRef] [Google Scholar]
- Robinson, P. J., & Holbrook, K. A. 1972, Unimolecular Reactions (Wiley-Interscience) [Google Scholar]
- Rouillé, G., Krasnokutski, S. A., & Carpentier, Y. 2021, A&A, 656, A100 [NASA ADS] [CrossRef] [EDP Sciences] [Google Scholar]
- Roy, A., Singh, S. V., Ambresh, M., et al. 2022a, Adv. Space Res., 70, 2571 [NASA ADS] [CrossRef] [Google Scholar]
- Roy, A., Singh, S. V., Meka, J. K., et al. 2022b, MNRAS, 517, 4845 [NASA ADS] [CrossRef] [Google Scholar]
- Rudnitskij, G. M. 1997, Astrophys. Space Sci., 251, 259 [NASA ADS] [CrossRef] [Google Scholar]
- Saha, K., Chandrasekaran, V., Heber, O., et al. 2018, Nat. Commun., 9, 912 [NASA ADS] [CrossRef] [Google Scholar]
- Sánchez, G., Díaz-Tendero, S., Alcamí, M., & Martín, F. 2005, Chem. Phys. Lett., 416, 14 [CrossRef] [Google Scholar]
- Schmidt, D. R., & Ziurys, L. M. 2017, ApJ, 850, 123 [NASA ADS] [CrossRef] [Google Scholar]
- Schmidt, D. R., Zack, L. N., & Ziurys, L. M. 2018, ApJ, 864, L31 [Google Scholar]
- Sellgren, K., Werner, M. W., & Ingalls, J. G. 2009, in Am. Astron. Soc. Meeting Abstracts, 214, 402.12 [NASA ADS] [Google Scholar]
- Sellgren, K., Werner, M. W., Ingalls, J. G., et al. 2010, ApJ, 722, L54 [NASA ADS] [CrossRef] [Google Scholar]
- Serra Díaz-Cano, L., & Jones, A. P. 2008, A&A, 492, 127 [NASA ADS] [CrossRef] [EDP Sciences] [Google Scholar]
- Simon, A., Rapacioli, M., Rouaut, G., Trinquier, G., & Gadéa, F. X. 2017, Philos. Trans. Ser. A Math. Phys. Eng. Sci., 375, 20160195 [NASA ADS] [Google Scholar]
- Slavin, J. D., Dwek, E., & Jones, A. P. 2015, ApJ, 803, 7 [NASA ADS] [CrossRef] [Google Scholar]
- Sommer, T., Kruse, T., & Roth, P. 1995, J. Phys. Chem., 99, 13509 [CrossRef] [Google Scholar]
- Song, X., Mao, R., Wang, Z., & Qi, J. 2021, RSC Adv., 11, 1472 [NASA ADS] [CrossRef] [Google Scholar]
- Sowa, M. B., Hintz, P. A., & Anderson, S. L. 1991, J. Chem. Phys., 95, 4719 [NASA ADS] [CrossRef] [Google Scholar]
- Stewart, J. T., Brumfield, B. E., Gibson, B. M., & McCall, B. J. 2013, ISRN Phys. Chem., 2013, 675138 [CrossRef] [Google Scholar]
- Stockett, M. H., Zettergren, H., Adoui, L., et al. 2014, Phys. Rev. A, 89, 032701 [NASA ADS] [CrossRef] [Google Scholar]
- Swan, W. 1857, Trans. Roy. Soc. Edinb, 21, 411 [CrossRef] [Google Scholar]
- Tennyson, J., & Yurchenko, S. N. 2012, MNRAS, 425, 21 [Google Scholar]
- Thorburn, J. A., Hobbs, L. M., McCall, B. J., et al. 2003, ApJ, 584, 339 [Google Scholar]
- Tomita, S., Andersen, J. U., Gottrup, C., Hvelplund, P., & Pedersen, U. V. 2001, Phys. Rev. Lett., 87, 073401 [Google Scholar]
- Tománek, D. 2014, Guide Through the Nanocarbon Jungle (Morgan & Claypool Publishers), 2053 [CrossRef] [Google Scholar]
- Tsuchida, H., Itoh, A., Nakai, Y., Miyabe, K., & Imanishi, N. 1998, J. Phys. B: At. Mol. Opt. Phys., 31, 5383 [NASA ADS] [CrossRef] [Google Scholar]
- Vandenbosch, R., Henry, B. P., Cooper, C., et al. 1998, Phys. Rev. Lett., 81, 1821 [Google Scholar]
- van Dishoeck, E. F., Jansen, D. J., & Phillips, T. G. 1993, A&A, 279, 541 [NASA ADS] [Google Scholar]
- Vishakantaiah, J., & Balasubramaniam, G. 2018, Adv. Mat. Lett., 9, 510 [CrossRef] [Google Scholar]
- West, B., Useli-Bacchitta, F., Sabbah, H., et al. 2014, J. Phys. Chem. A, 118, 7824 [NASA ADS] [CrossRef] [Google Scholar]
- Xia, Y., Xing, Y., Tan, C., & Mei, L. 1995, Phys. Rev. B, 52, 111 [Google Scholar]
- Yasunaga, K., Yamada, H., Oshita, H., et al. 2017, Combust. Flame, 185, 335 [CrossRef] [Google Scholar]
- Yi, J., & Bernholc, J. 1992, J. Chem. Phys., 96, 8634 [NASA ADS] [CrossRef] [Google Scholar]
- Yurchenko, S. N., Al-Refaie, A. F., & Tennyson, J. 2018a, A&A, 614, A131 [NASA ADS] [CrossRef] [EDP Sciences] [Google Scholar]
- Yurchenko, S. N., Szabó, I., Pyatenko, E., & Tennyson, J. 2018b, MNRAS, 480, 3397 [NASA ADS] [CrossRef] [Google Scholar]
- Zhang, B., XU, C. H., Wang, C. Z., T., C. C., & M., H. K. 1992, Phys. Rev. B, 46, 7333 [NASA ADS] [CrossRef] [Google Scholar]
- Zheng, G., Irle, S., & Morokuma, K. 2005, Chem. Phys. Lett., 412, 210 [NASA ADS] [CrossRef] [Google Scholar]
- Zhen, J., Castellanos, P., Paardekooper, D. M., Linnartz, H., & Tielens, A. G. 2014, ApJ, 797, L30 [Google Scholar]
- Zubko, V., Dwek, E., & Arendt, R. G. 2004, ApJS, 152, 211 [NASA ADS] [CrossRef] [Google Scholar]
All Tables
All Figures
|
Fig. 1 Schematic representation of the experimental setup used to study the in situ chemical evolution of interstellar dust analogs. The emitted photons from the transient species are collected by optical fibers and directed to an optical spectrometer (STS-UV Ocean Optics) and a vacuum monochromator (Princeton VM-502). |
| In the text | |
|
Fig. 2 UV–Vis emission spectra of shock-processed C60 showing C2 features and a broad continuum. The spectra were recorded under different experimental conditions, as reported in Table 1. The C2 vibronic bands were labeled according to the Herzberg (1995) notation: Δυ = υ′−υ″; υ′ and υ″ refer to the upper and lower vibrational levels, respectively. The spectral features below 420 nm flagged with an asterisk (*) were assigned to contaminants. |
| In the text | |
|
Fig. 3 Ground (a3Πu) and excited (d3Πg) electronic states of the Swan system of 12C2. The Δυ = +1 and +2 transitions are in blue, the Δυ = 0 transition is in purple, and the Δυ = −1 and −2 transitions are in red. |
| In the text | |
|
Fig. 4 Simulated emission spectra of C2 from 4000 to 7500 K without any convolution. All vibronic bands are labeled according to the Herzberg (1995) notation. |
| In the text | |
|
Fig. 5 Emission spectra of C2 for the Δυ = 0 band at 4500 K simulated for different pressures between 1 and 15.4 bar. Each spectrum is normalized to the intensity of the band-head. |
| In the text | |
|
Fig. 6 Simulated emission spectra of C2 under LTE approximation including self-absorption for various C2 gas densities (indicated at the top left of each plot). All vibronic bands are labeled and were normalized with respect to the Δυ = 0 band at 516 nm. |
| In the text | |
|
Fig. 7 Calculated spectra (black) compared to experimental optical emission spectra (magenta) of shock-induced C60. Self-absorption was taken into account in the simulations. Adjusted values of ∈tot, [C2], and Tgas: (a) 5.0 × 10⁻², 2.0 × 1016 cm−3, 4800 K; (b) 6.5 × 10⁻², 3.0 × 1016 cm−3, 5200 K; (c) 4.7 × 10⁻², 1.5 × 1016 cm−3, 5200 K; (d) 1.05×10⁻¹, 2.6 ×1016 cm−3, 4800 K; (e) 8.5 × 10⁻², 2.8 × 1016 cm−3, 4000 K. The bands between 350 and 440 nm flagged with an asterisk (*) were assigned to CN transitions arising from nitrogen contamination. The CN bands were simulated using the LIFBASE package (Luque & Crosley 1999) and their intensities were manually adjusted to match the experimental values. Contamination by sodium (Na I) and aluminum (Al I) was also identified. |
| In the text | |
|
Fig. 8 Molecular dynamics simulations of the dissociation of C60 in the canonical approximation. The thermalization time was set to 100 ps. The confinement effects were simulated by implementing a repulsive spherical wall with a 60 Å radius. The fragmentation of C60 causes the appearance of a variety of carbon clusters Cn (n < 60) over the 3500–4500 K temperature range. nC is the number of carbon atoms in the cluster, nftag is the conversion efficiency. An example of how to read this graph: panel b, after a time of 4 ns, C60 will have fragmented into ~3 C2 units, which converts into an efficiency nftag of 10% for nC = 2. One limiting case (not seen in the simulations) is a full conversion of C60 into 30 C2 units (i.e., nfrag = 100% for nC = 2). |
| In the text | |
|
Fig. 9 Mean total radiative emission (electronic deexcitation) for C60 (a), C42 (b), and C24 (c) carbon clusters according to structural families (branched, pretzels, flakes, cages). C2 dissociation rates for C60 and C42 cage families are also reported, as well as the thermoionization rate for C60 cage family (panel a). Every sample contains about 1000 isomers. C24 cage carbon clusters are not considered in the present work because the associated family contains only 11 isomers. |
| In the text | |
|
Fig. 10 Emission spectra from samples containing around 1000 isomers. The simulated histogram emission spectra has been broadened by a Gaussian function with FWHM = 105λ2/nm. The fit function is a modified Planck function expressed as |
| In the text | |
|
Fig. A.1 Geometries of the carbon clusters to simulate the internal energies in canonical approximation. The geometries of the lowest energy clusters are from Tománek (2014) and Song et al. (2021), and their harmonic frequencies were calculated using B3LYP level of theory in conjunction with the 6-31G* basis set. |
| In the text | |
|
Fig. A.2 Internal energy vs. temperature of the carbon clusters displayed in Fig. A.1 computed in the canonical approximation. The whole sequence starting with the dissociation of C60 is driven by the internal energy available to the intermediate cluster. |
| In the text | |
|
Fig. B.1 Shock-induced destruction pathways of C60 in the laboratory under constant temperature conditions. The shock-induced pressure rise leads to rapid collisional heating of C60. The high internal energy acquired initiates a sequential process starting with fragmentation into C58 + C2. The break-up of the larger fragment continues, driven by the internal energy remaining in it or acquired through collisions with the bath gas. Below a certain size (less than ~40 carbon atoms), the energy can also be dissipated radiatively (Sect. 5) slowing down the fragmentation process. Because of the presence of hundreds to thousands of isomers for each carbon cluster between 20 and 40 carbon atoms, spectral features are blurred out and the overall emission appears blackbody-like. |
| In the text | |
Current usage metrics show cumulative count of Article Views (full-text article views including HTML views, PDF and ePub downloads, according to the available data) and Abstracts Views on Vision4Press platform.
Data correspond to usage on the plateform after 2015. The current usage metrics is available 48-96 hours after online publication and is updated daily on week days.
Initial download of the metrics may take a while.