Open Access
Fig. 10
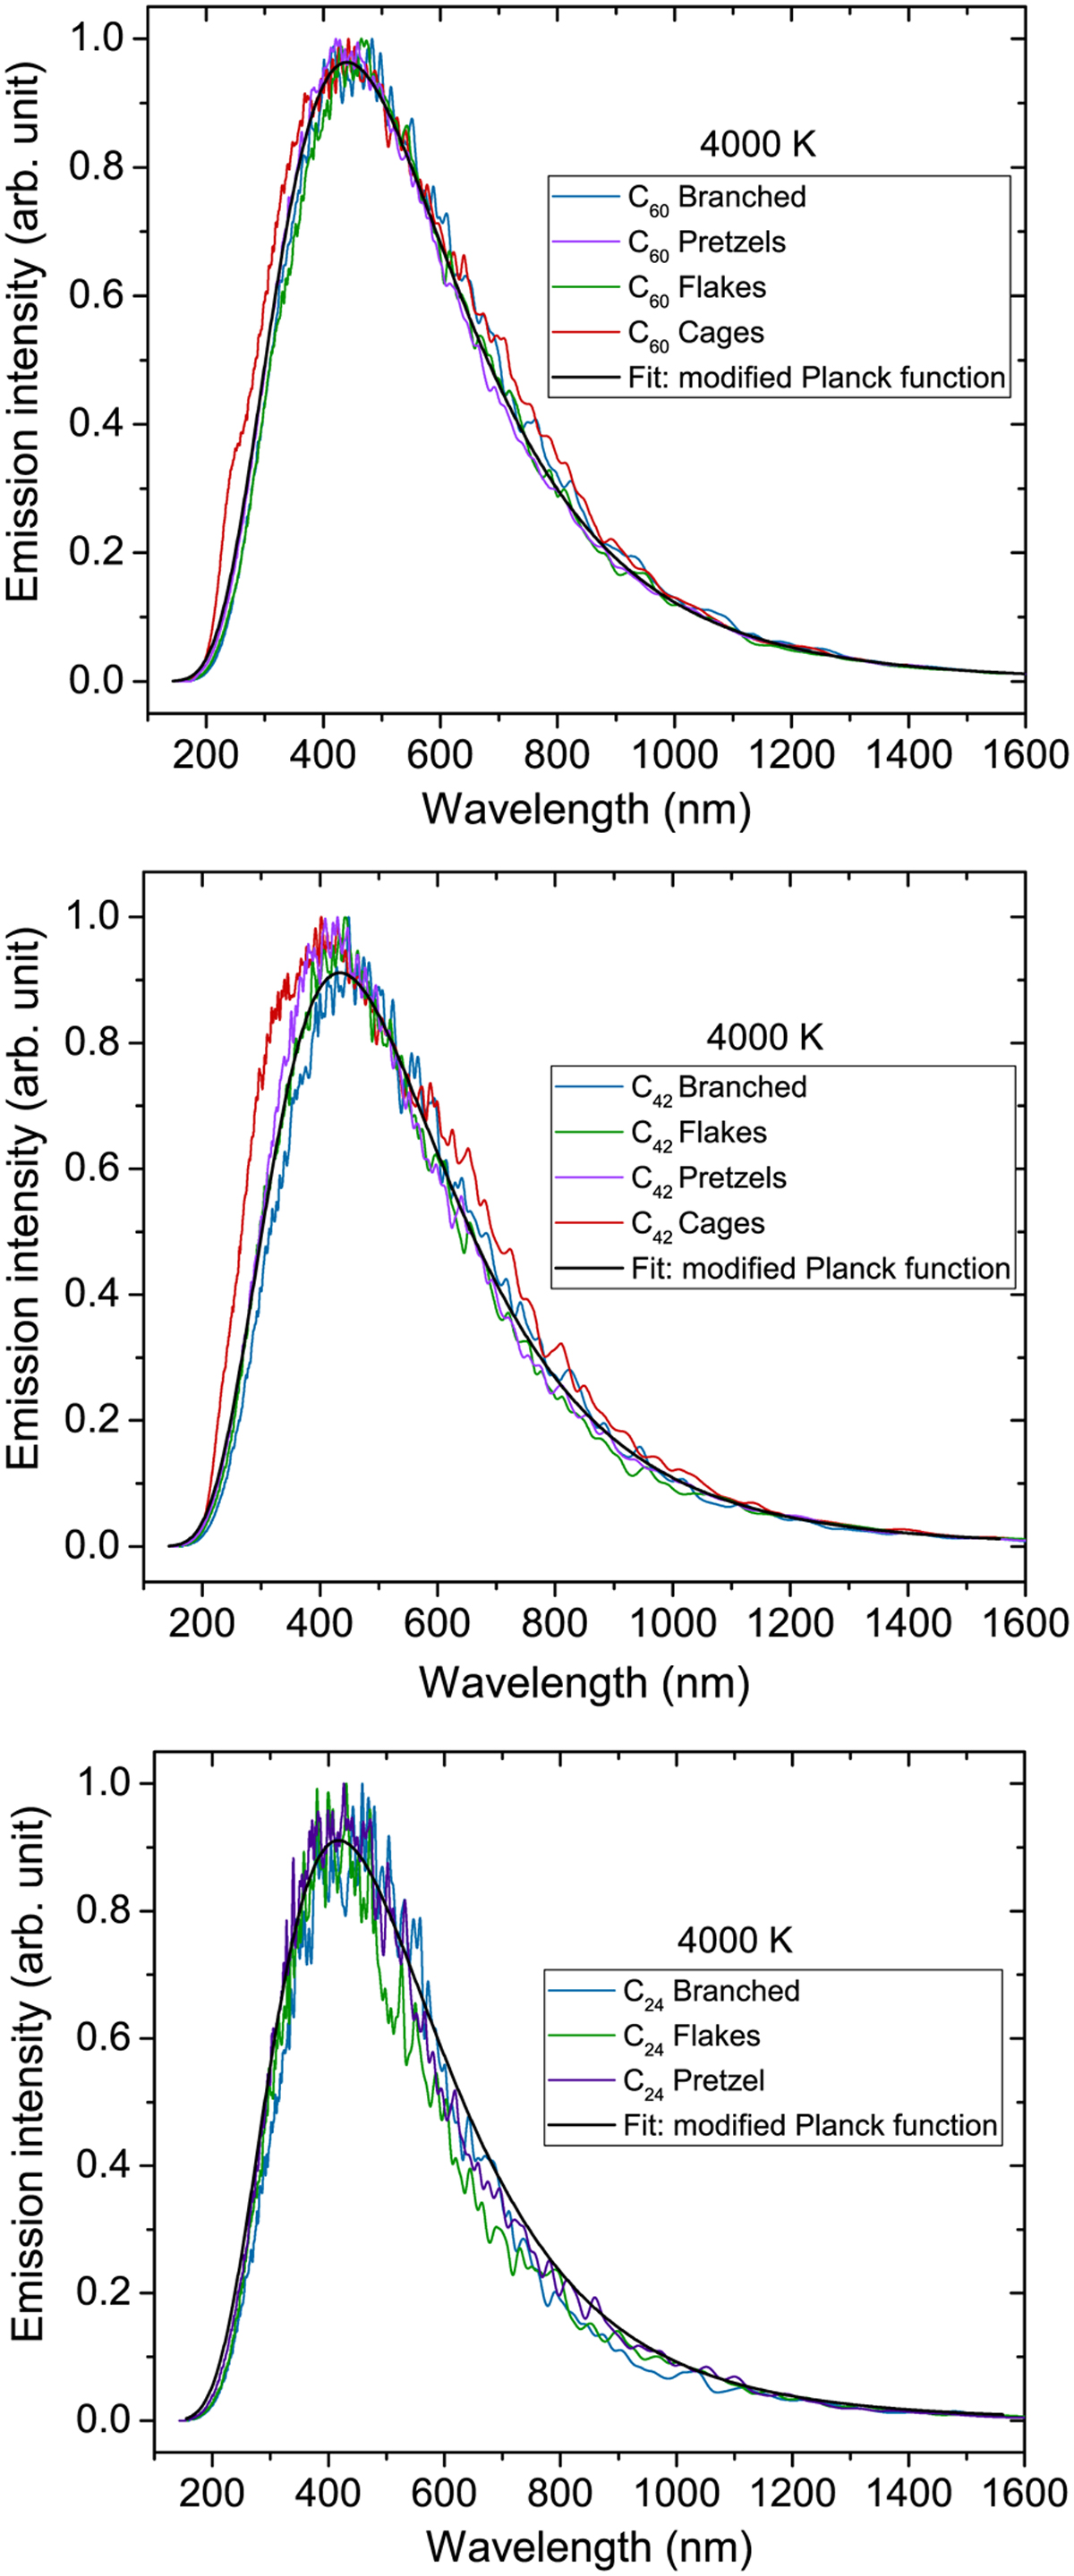
Download original image
Emission spectra from samples containing around 1000 isomers. The simulated histogram emission spectra has been broadened by a Gaussian function with FWHM = 105λ2/nm. The fit function is a modified Planck function expressed as ![]() .
.
Current usage metrics show cumulative count of Article Views (full-text article views including HTML views, PDF and ePub downloads, according to the available data) and Abstracts Views on Vision4Press platform.
Data correspond to usage on the plateform after 2015. The current usage metrics is available 48-96 hours after online publication and is updated daily on week days.
Initial download of the metrics may take a while.