Fig. 7

Download original image
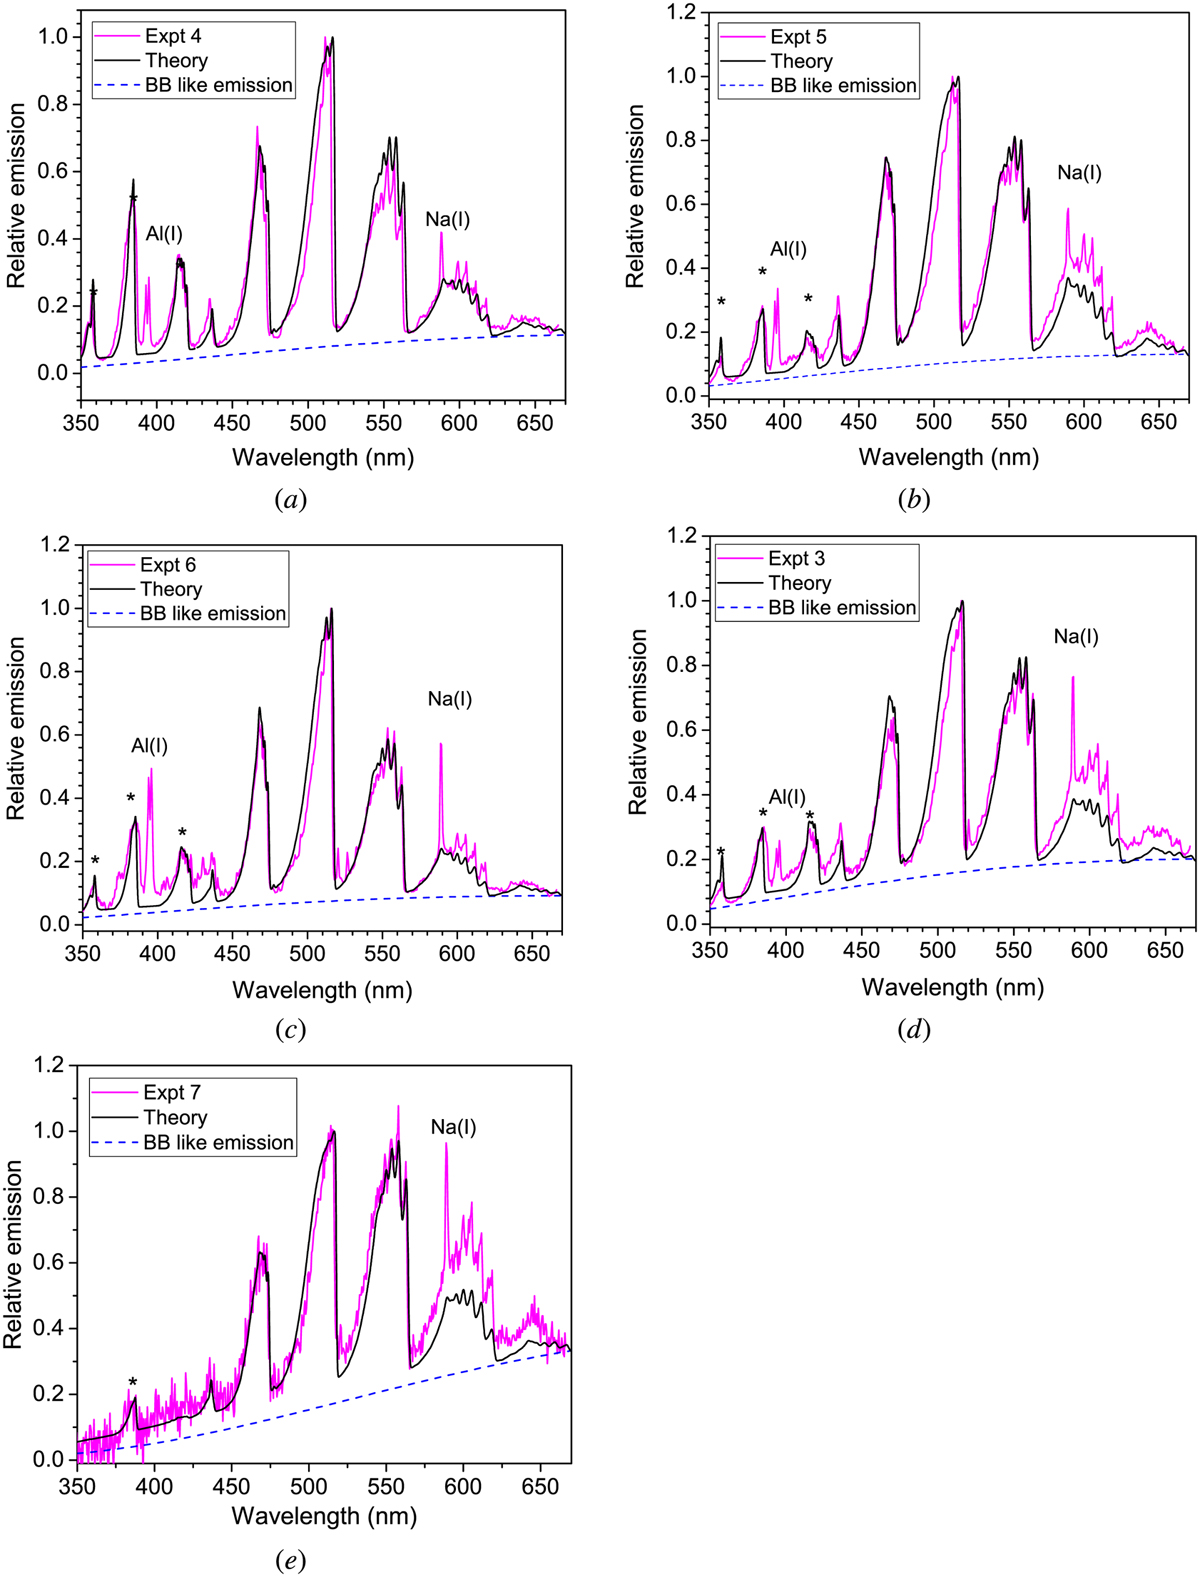
Calculated spectra (black) compared to experimental optical emission spectra (magenta) of shock-induced C60. Self-absorption was taken into account in the simulations. Adjusted values of ∈tot, [C2], and Tgas: (a) 5.0 × 10⁻², 2.0 × 1016 cm−3, 4800 K; (b) 6.5 × 10⁻², 3.0 × 1016 cm−3, 5200 K; (c) 4.7 × 10⁻², 1.5 × 1016 cm−3, 5200 K; (d) 1.05×10⁻¹, 2.6 ×1016 cm−3, 4800 K; (e) 8.5 × 10⁻², 2.8 × 1016 cm−3, 4000 K. The bands between 350 and 440 nm flagged with an asterisk (*) were assigned to CN transitions arising from nitrogen contamination. The CN bands were simulated using the LIFBASE package (Luque & Crosley 1999) and their intensities were manually adjusted to match the experimental values. Contamination by sodium (Na I) and aluminum (Al I) was also identified.
Current usage metrics show cumulative count of Article Views (full-text article views including HTML views, PDF and ePub downloads, according to the available data) and Abstracts Views on Vision4Press platform.
Data correspond to usage on the plateform after 2015. The current usage metrics is available 48-96 hours after online publication and is updated daily on week days.
Initial download of the metrics may take a while.


