Fig. 2
Download original image
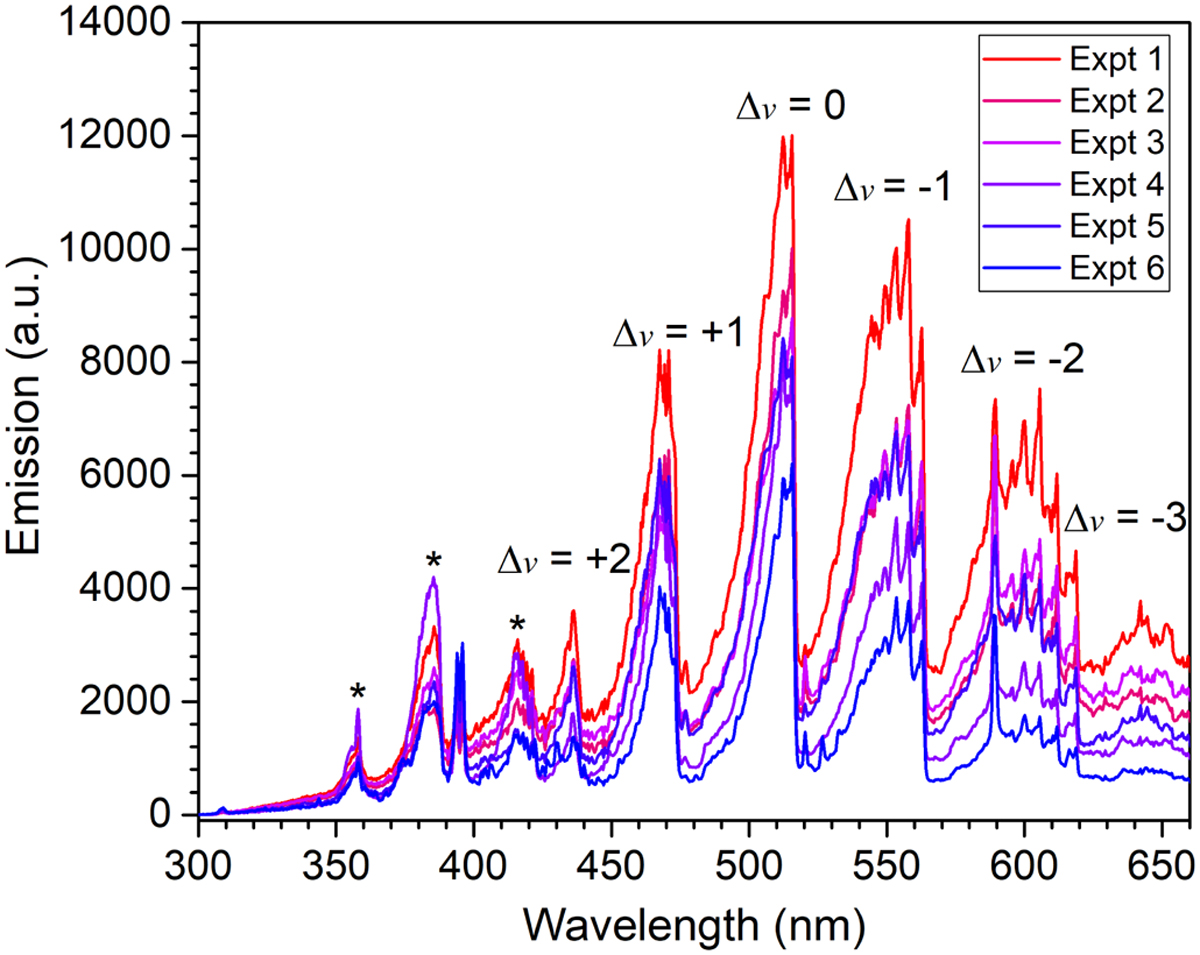
UV–Vis emission spectra of shock-processed C60 showing C2 features and a broad continuum. The spectra were recorded under different experimental conditions, as reported in Table 1. The C2 vibronic bands were labeled according to the Herzberg (1995) notation: Δυ = υ′−υ″; υ′ and υ″ refer to the upper and lower vibrational levels, respectively. The spectral features below 420 nm flagged with an asterisk (*) were assigned to contaminants.
Current usage metrics show cumulative count of Article Views (full-text article views including HTML views, PDF and ePub downloads, according to the available data) and Abstracts Views on Vision4Press platform.
Data correspond to usage on the plateform after 2015. The current usage metrics is available 48-96 hours after online publication and is updated daily on week days.
Initial download of the metrics may take a while.