| Issue |
A&A
Volume 668, December 2022
|
|
|---|---|---|
| Article Number | A75 | |
| Number of page(s) | 38 | |
| Section | Extragalactic astronomy | |
| DOI | https://doi.org/10.1051/0004-6361/202244748 | |
| Published online | 06 December 2022 | |
Long-term multi-wavelength variability and extreme spectral properties of the TeV-detected blazar 1ES 0033+595⋆
1
Ilia State University, Cholokashvili Av. 3/5, Tbilisi 0162, Georgia
e-mail: This email address is being protected from spambots. You need JavaScript enabled to view it.
; This email address is being protected from spambots. You need JavaScript enabled to view it.
2
E. Kharadze National Astrophysical Observatory, Mt. Kanobili, Abastumani 0803, Georgia
3
INAF, Osservatorio Astronomico di Brera, Via E. Bianchi 46, 23807 Merate, Italy
Received:
14
August
2022
Accepted:
30
September
2022
Abstract
Context. The multi-wavelength (MWL) properties of some TeV-detected blazars are still poorly understood. By studying the MWL properties of the BL Lacertae source 1ES 0033+595, we make further progress in our understanding of the instable physical processes responsible for particle acceleration to ultra-relativitic energies and the observed emission properties.
Aims. This paper presents the results of a detailed X-ray timing and spectral analysis of the source 1ES 0033+595, allowing us to draw conclusions about the physical mechanisms responsible for particle acceleration and the generation of X-ray emission. We also examined the long-term MWL behaviour of the source and interband cross-correlations.
Methods. Our study focused on the observations performed with the X-Ray Telescope on board the Neil Gehrels Swift Observatory (Swift-XRT) in the period 2005–2022. The MWL data sets were obtained with several space and ground-based instruments. We analysed the MWL flaring behaviour during the entire period, as well as in particular subperiods selected on the basis of the X-ray flaring activity of the target; constructed histograms characterising the distributions of the different spectral parameters and MWL fluxes; and checked cross-correlations between these parameters and/or MWL fluxes. The obtained results are compared with the predictions of the various theoretical studies and simulations presented by the different authors to date.
Results. The source showed extreme spectral properties with dominance of high spectral curvature, frequent occurrence of very and extremely hard photon indices, and the presence of a synchrotron spectral energy distribution (SED) peak in the hard X-ray range (sometimes at energies beyond 10 keV). These properties reveal the importance of first-order Fermi acceleration with very low initial particle energy distribution, along with the co-existence of stochastic acceleration and hadronic processes. The source was characterised by very uneven and erratic flaring activity in diverse epochs: the period of strong flares (2013–2016) was preceded by a moderate variability and followed by a gradual long-term decrease in MWL flaring activity. We detected a number of instances of intraday 0.3–10 keV variability, which were sometimes observed within a few hundred seconds and explained by the interaction between the relativistic shock front and jet inhomogeneities with strong magnetic fields. The X-ray and γ-ray fluxes showed a lognormal distribution, which hints at the imprint of accretion disc instabilities on the blazar jet.
Key words: BL Lacertae objects: individual: 1ES 0033+595
Light curves data are only available at the CDS via anonymous ftp to https://cdsarc.cds.unistra.fr (130.79.128.5) or via https://cdsarc.cds.unistra.fr/viz-bin/cat/J/A+A/668/A75
© B. Kapanadze and A. Gurchumelia 2022
 Open Access article, published by EDP Sciences, under the terms of the Creative Commons Attribution License (https://creativecommons.org/licenses/by/4.0), which permits unrestricted use, distribution, and reproduction in any medium, provided the original work is properly cited.
This article is published in open access under the Subscribe-to-Open model. This email address is being protected from spambots. You need JavaScript enabled to view it. to support open access publication.
1. Introduction
BL Lacertae objects (BL Lacs) form an extreme subclass of blazars, which are remarkable for absent emission lines and a featureless optical spectrum, compact radio-structure, high and variable radio-optical polarisation, apparent superluminal motion of some components, a very broad continuum extending from the radio to the very high-energy γ-rays (E > 100 GeV), and strong flux variability in all spectral bands (see Massaro et al. 2011a). Blazars are thought to be active galactic nuclei (AGNs) of the elliptical galaxies, producing a relativistic jet that is closely aligned with our line of sight (Falomo et al. 2014). Consequently, a Doppler-boosted, non-thermal jet emission overwhelms that of other galactic and AGN components, and in some extreme cases, no secure identification of spectral lines from the host galaxy is possible. For this reason, we cannot determine the redshift of those blazars, including the TeV-detected BL Lac source 1ES 0033+595.
The broadband spectral energy distribution (SED) of BL Lacs presents two different components in the log ν–log νFν plane. The lower-energy ‘hump’ extends over the radio-to-X-ray energy range, and its origin is widely accepted as synchrotron emission of a relativistic, magnetised plasma (Falomo et al. 2014). Based on the position of the synchrotron SED peak Ep, BL Lacs are widely divided into two subclasses (Padovani & Giommi 1995 and references therein): high-energy-peaked (HBLs, peaking at UV–X-ray frequencies) and low-energy-peaked (LBLs, with Ep situated in the IR–optical part of the spectrum) objects.
On the contrary, various models have been made in an attempt to understand the origin of the higher energy SED component (extending over the γ-ray frequencies in HBLs). (1) One incorporates inverse Compton (IC) scattering of synchrotron photons by their ‘parent’ electron–positron population (the synchrotron self-Compton model, SSC; Marscher & Gear 1985 and references therein), and is characterised by (nearly) simultaneous variations in both the synchrotron and higher energy components. (2) Another is the external Compton (EC, Dermer et al. 1992) model, and a third example (3) are the hadronic models, incorporating the production of γ-rays by relativistic protons, either directly (the proton synchrotron model; Mücke et al. 2003) or indirectly (e.g., synchrotron emission from a secondary electron population, generated by the interaction of high-energy protons with ambient photons; Mannheim 1992). Such models may ‘tolerate’ a complicated MWL behaviour with absent or time-shifted correlation (similar to the multi-zone SSC scenarios). A valid model can be selected through the intense study of MWL flux variability, inter-band cross-correlations, and X-ray and γ-ray spectral properties. We present such undertaking here, using the little investigated, TeV-detected BL Lac source 1ES 0033+595 as our target.
To date, optical observations of this object have not been able to resolve the host galaxy in order to determine the photometric redshift. 1ES 0033+595 was originally detected in the framework of the Einstein Slew Survey (Elvis et al. 1992) and was identified as a BL Lac source by Perlman et al. (1996), who found a featureless optical spectrum. This object was resolved into two point-like sources with an angular separation of 1.58 arcsec by the HST, which revealed nearly identical brightnesses and such a structure was explained by a possible gravitational lensing (Scarpa et al. 1999; Falomo & Kotilainen 1999). However, a colour difference between the components strongly argued against the lensing hypothesis, with the most likely explanation incorporating a chance alignment of 1ES 0033+595 with a foreground star (Scarpa et al. 1999). Moreover, the subsequent Very Large Array (VLA) observations did not detect a second radio source, ruling out the lensing hypothesis (Rector et al. 2003). A tentative redshift of 0.086 was derived by E. Perlman, and mentioned in Falomo & Kotilainen (1999) as a private communication, without describing the adopted method. The HST imaging yielded a nucleus brightness of V = 18.88 mag and an upper limit to the brightness of the surrounding nebulosity of V = 19.0 mag, from which the lower limit of the redshift z > 0.24 was derived by Sbarufatti et al. (2005). Adopting the empirical approach of Prandini et al. (2010) for the Fermi LAT and MAGIC spectra, Aleksic et al. (2015) estimated the redshift of this source to be about 0.34. Based on spectroscopic observations with the 10-m Gran Telescopio Canarias (La Palma, Spain), Paino et al. (2017) resolved two components in the direction of 1ES 0033+595: the spectrum of object ‘A’ showed the typical stellar absorption lines of G–stars, while component ‘B’ was confidently (with a signal-to-noise ratio S/N ∼ 100) identified as an extragalactic object, owing to the non-detection of the Hα line. An emission feature with an equivalent width (EW) of 0.4 Å at 5468 Å was detected in all individual spectra and identified to be [O II] 3727Å with the tentative redshift z = 0.467. However, we note that the redshift estimation technique of Zahoor et al. (2022) based on the very high energy (VHE) index of the source1 yields z = 0.21(0.10)–0.24(0.11).
The extreme X-ray spectral properties of 1ES 0033+595 were first noticed by Costamante et al. (2001) who analysed the BeppoSAX observation performed in 1999 December. The source was detected with the Phoswich Detector System (PDS) instrument in the hard X-ray frequencies up to ∼60 keV. The spectrum was characterised by a curved shape, which was better fitted by a broken power law than by a single power-law model (with both fixed and free absorption). The spectral indices before and after the break energy were lower and higher than 1, respectively. This feature indicated the presence of a synchrotron SED peak at the break energy (∼3 keV) itself, and meant that 1ES 0033+595 was classified as an extreme high-frequency peaked object (EHBL, i.e. an HBL source with the synchrotron SED peak Ep > 1 keV; Costamante et al. 2001). Giommi et al. (2002) reported a lognormal shape of the same spectrum, and a similar result was obtained from the XMM-Newton observation performed in 2003 (Perlman et al. 2005). The source was also detected with INTEGRAL in the 20–50 keV energy range with a statistical significance of 5.2σ in 2003 (den Hartog et al. 2006), and the later observations in 2005 revealed the source to be a factor of 2.4 brighter demonstrating a strong hard X-ray variability (Kuiper & Hermsen 2005). The Burst Alert Telescope (BAT) instrument on board the Swift Neil Gehrels Observatory (Gehrels et al. 2004) detected 1ES 0033+595 during the first 22 months (2004 December–2006 October) of observation (Tueller et al. 2010), and the source was later included in the 22-, 58-, 70-, and 100-month BAT catalogues2. The observations with Swift-XRT recorded three different X-ray flares by a factor of 2–2.8 in 2014 December, 2015 September, 2017 March, and 2018 March–April. During these instances, the source generally showed very hard spectra with the photon index at 1 keV smaller than a = 1.5 and with the synchrotron SED peak Ep sometimes located beyond 10 keV (Kapanadze 2015, 2017, 2018). In the course of the first flare, 1ES 0033+595 was also detected by INTEGRAL with the highest historical 3–10 keV and 18–40 keV states (Benbow 2015), and was included in the INTEGRAL-IBIS Catalog of 1000 Orbits as a persistent source in the 17–30 keV band (Bird et al. 2016).
In the HE γ-ray range (E > 1 MeV), 1ES 0033+595 was detected within the first 5.5 months of the survey observations (Abdo et al. 2009). Afterwards, it was included in the First, Second, Third, and Fourth Fermi-LAT catalogues (Abdo et al. 2010; Nolan et al. 2012; Acero et al. 2015; Abdollahi et al. 2020, respectively). Moreover, 1ES 0033+595 was included in the First Fermi-LAT Catalog of Sources Above 10 GeV (Ackermann et al. 2013). At the VHE (E > 100 GeV) γ-ray frequencies, 1ES 0033+595 was first observed with the Whipple telescope for 12 h in 1995 December, which yielded only upper limits to the VHE flux (Horan et al. 2004). A similar result was obtained based on the five-hour MAGIC observations in 2006 and 2008 (Aleksic et al. 2011). A TeV-detection of 1ES 0033+595 was originally reported by Aleksic et al. (2015) with a statistical significance of 5.5σ. The VHE emission of this object was constant throughout the MAGIC observations (2009 August and October), equivalent to 2% Crab. VERITAS detected a VHE flare from the source during 2013 September with a maximum integral flux of ∼15
In this paper, we present the results of a detailed X-ray timing and spectral analysis of 1ES 0033+595 focused on the long-term Swift-XRT observations performed in 2005–2022. Owing to the unique characteristics, good photon statistics, and low background counts of this instrument (see Burrows et al. 2005), we were able to search for a flux variability on timescales from months and years down to minutes; obtain high-quality spectra for most of the observations; perform a high-quality spectral analysis; derive the values of different spectral parameters and study their timing behaviour; and check for cross-correlations between these parameters and between them and the X-ray fluxes in order to investigate the physical mechanisms responsible for the particle acceleration and generation of the MWL emission. For the same purposes, we checked the contemporaneous MWL behaviour of the source and inter-band cross-correlation using all the publicly available data obtained with the (i) Ultraviolet-Optical Telescope (UVOT; Roming et al. 2005) on board Swift; (ii) Burst Alert Telescope (BAT; Barthelmy et al. 2005) on board the same space mission; (iii) Monitor of All Sky X-ray Image (MAXI; Matsuoka et al. 2009; iv) Large Area Telescope (LAT) on board Fermi (Atwood et al. 2009; v) All Sky Monitor on board Rossi X-Ray Timing Explorer (RXTE-ASM; Levine et al. 1996); and (vi) various ground-based optical telescopes.
The paper is organised as follows: Sects. 2 and 3 describe the data processing and analysis procedures, respectively. In Sect. 4, we provide the results of a timing analysis and the X-ray spectroscopy. We discuss our results in Sect. 5, and provide a corresponding summary and conclusions in Sect. 6.
2. Observations and data reduction
2.1. X-ray data
The BL Lac 1ES 0033+595 was targeted 161 times with Swift-XRT between 2005 April 1 and 2022 May 22, yielding a net exposure of 205 ks. The duration of each observation ranged between 50 s and 7.5 ks, with a mean exposure of 1.33 ks. The majority of these snapshots (73%) were performed in the Windowed Timing (WT) mode, and the remaining ones in the Photon Counting (PC) mode. During the monitoring of the target, the detector sometimes switched between PC and WT modes in order to optimise the observations.
The XRT observational log is presented in Table A.13. We retrieved the raw observational data obtained from the publicly available archive maintained by HEASARC4. The Level-1 unscreened XRT event files (in FITS format) were processed with the XRTDAS package (version 3.6.1) developed at the ASI Science Data Center (ASDC) and distributed by HEASARC within the HEASOFT package (version 6.30.1). Following the standard procedures, these files were reduced, calibrated, and cleaned by means of the XRTPIPELINE script, adopting the standard filtering criteria (grade, region, time, energy, intensity, and phase filterings) and the latest calibration files incorporated by Swift-XRT CALDB (Version 20210924). Namely, we selected the events with grades 0–2 for the WT-mode, whereas the range of 0–12 was used for the PC-type observations. In the case where a spectrum is produced, the pipeline also generates the corresponding ancillary response (ARF) file using the task XRTMKARF with corrections for the point-spread-function(PSF) losses, different extraction regions, vignetting, and CCD defects.
In WT mode, the source and background light curves and spectra were extracted with the task XSELECT using circular areas with radii of 10–30 pixels (depending on the source brightness and exposure). During some observations (ObsIDs 32971077 and 32971126, the second portion of ObsID 32971076), the image center of 1ES 0033+595 was just at the edge the observational area or beyond, and we excluded those cases from our study to avoid incorrect PSF reconstruction. As for the PC mode, the source counts were extracted from a circular region of 10–35 pixels in radius centered on the source, and background counts were extracted from the surrounding annulus with inner and outer radii of 80 and 120 pixels, respectively.
The light curves were then corrected using XRTLCCORR for the resultant loss of effective area, bad and hot pixels, pile-up, and vignetting. The PC observations with the 0.3–10 keV count rates greater than 0.5 cts s−1 were checked for pile-up using the XIMAGE package. The radius of the piled-up central region of the source was estimated following the recipe of Moretti et al. (2005). We then excluded the inner circle of this radius from the source-extraction region. The loss of counts caused by the inner hole in the source region were corrected by the corresponding ARF file. As the target showed count rates much lower than ∼100 cts s−1 in WT mode, no pile-up correction was required (see Romano et al. 2006 and references therein).
The instrument with the largest field of view (FOV, 1.4 steradian; Barthelmy et al. 2005), Swift-BAT, observed 1ES 0033+595 in the 15–150 keV energy range during our period of study, monitoring the entire sky at hard X-rays every few hours. We retrieved the daily-binned data, processed using the BAT CALDB (version 20171016) and publicly available on the website of the Hard X-ray Transient Monitor program5 (Krimm et al. 2013). As the source was relatively rarely detectable with 5σ significance (the threshold typically adopted for the variability studies with the coded-mask devices) with BAT, integration times of 2 d or longer were adopted. For this purpose, we used the tool REBINGAUSSLC from HEASOFT and re-binned the BAT data within the time intervals of 2–4 days and 1–4 weeks.
The background-subtracted 2–20 keV MAXI data are normalised using the instrument response function and are publicly available6. Similar to BAT, we filtered these data using the 5σ detection threshold (as recommended by the MAXI team7). Using the online tool MAXI ON-DEMAND PROCESS8, we also extracted the 2–20 keV light curve with the integration times of 2–4 days and 1–4 weeks.
RXTE-ASM carried out an everyday monitoring of the X-ray sky in the 1.5–12 keV energy range during 1996-2011. We retrieved the daily-binned long-term RXTE-ASM data from the website of MIT X-Ray Timing Explorer Project9 and filtered with the minimum detection significance of 3σ.
2.2. Optical–UV observations
During the XRT observation of 1ES 0033+595, UVOT was co-aligned with this telescope and cycled through each of the six optical–UV passbands V, B, U, UVW1, UVM2, and UVW2. The sky-corrected images were retrieved from HEASARC. The photometry was done using the UVOTSOURCE tool included in the standard UVOT software (developed and distributed within HEASOFT). We adopted the calibration files included in the CALDB version 20211108. The measurements were performed using the 3-arcsec radius source and background apertures following the general prescription of Poole et al. (2008). The background level was estimated close to the source but excluding ghost images of the nearby bright stars.
We also retrieved the publicly available optical R-band data for 1ES 0033+59510 obtained with the 0.76-m Katzman Automatic Imaging Telescope (KAIT; Li et al. 2003), which is situated at the Lick Observatory and has been observing the source since 2010 July. The Tuorla Blazar Monitoring Program11 (Takalo et al. 2008) was started in 2002 September with the Tuorla 1.03m Dall-Kirkham telescope located at Tuorla Observatory (Piikkiö, Finland). Since 2004, most of the observations have been performed with the Kungliga Vetenskapsakademien (KVA) 60-cm telescopes situated at the Observatorio del Roque de los Muchachos on La Palma (Spain). We retrieved the publicly available photometric data provided by Nilsson et al. (2018)12.
The mR magnitudes were then corrected for the Galactic extinction A(R) = 2.35 mag (Aleksic et al. 2015) and converted into Janskys using (Nilsson et al. 2007)
 (1)
(1)
or into milli-Janskys,
 (2)
(2)
The contribution introduced from the nearby star was subtracted from the total flux (0.22 mJy, Nilsson et al. 2007; corresponding to the unabsorbed value of 1.92 mJy). The magnitudes were then corrected for Galactic absorption applying E(B − V) = 0.81 mag, which was derived using the relation (Güver & Özel 2002)
 (3)
(3)
and the Aλ/E(B − V) values, which were calculated using the interstellar extinction curves provided by Fitzpatrick & Massa (2007). The effective wavelength and photometric zero points of each UVOT filter were taken from Poole et al. (2008) and Breeveld et al. (2011), respectively. These data, along with the derived Aλ values, are summarised in Table 1. The corrected magnitudes and fluxes from the different UVOT bands are provided in Table A.2.
Summary of the UVOT bands.
2.3. γ-ray observations
The publicly available Fermi-LAT data extracted from LAT Data Server13 were analysed using the Fermitools package version 2.0.8 available at the Fermi Science Support Center14. For this purpose, we adopted the post-launch instrument response function P7SOURCE_V7. We extracted the 0.3–300 GeV fluxes from the LAT observations: the data analysis of 1ES 0033+595 is particularly challenging because the source is located near the Galactic plane. In order to reduce the contamination by the diffuse emission at the plane, we restricted our study to the aforementioned energy range where one can succeed in obtaining the narrower PSF in order to separate the γ-ray emission associated with our target from the intense Galactic foreground. As 1ES 0033+595 is a relatively hard source, its 100–300 MeV emission is heavily overshadowed by those of the background point sources.
Only the events of the diffuse class (associated to the highest probability of belonging to the source) from a region of interest (ROI) of radius 10 deg centred on 1ES 0033+595 were selected and processed using the unbinned maximum likelihood method GTLIKE15. In order to improve the quality of the data analysis, we selected only those photons belonging to evclass=128 and evtype=3 and flagged with (DATA_QUAL==1) and (LAT_CONFIG==1): the spacecraft was outside the South Atlantic Anomaly and the source was located in the LAT FOV. A cut on the zenith angle (> 90 deg) was made to reduce contamination from the Earth-albedo γ-rays. The data taken when the rocking angle of the spacecraft was larger than 52 deg were discarded to avoid time intervals during which the Earth entered the LAT FOV.
By using the user-contributed tool make4FGLxml.py16, a background model including all point γ-ray sources from the Fourth Fermi-LAT catalogue (4FGL, Abdollahi et al. 2020) within 20 deg of 1ES 0033+595 was created. For the spectral modelling of our target, we adopted a simple power-law model dN/dE = N(E/Escale)−Γ, as done in the 4FGL catalogue. The spectral parameters of sources within the ROI were left free during the minimisation process, while those beyond this range were fixed to the 4FGL values. The Galactic and extragalactic diffuse γ-ray emission as well as an isotropic component (including residual instrumental background) were incorporated in the model using the recommended model files gll_iem_v07.fits and iso_P8R3_SOURCE_V3_v1.txt, respectively. The normalisations of both background components were allowed to vary freely during the spectral fitting process. The detection significance σ was then calculated as σ ≈ (TS)1/2 (Abdo et al. 2009). When the source was not detectable with at least 3σ significance and/or GTLIKE yielded a low value for the model-predicted photons Npred ≲ 8, we calculated the upper limit to the photon flux using the Python-based tool UpperLimits17.
3. Timing and spectral analysis
Table 2 provides a summary of the MWL observations, including the maximum and mean fluxes, the maximum-to-minimum flux ratio, and the fractional root mean square (rms) variability amplitude in each spectral range. The latter quantity and the associated errors are calculated as (Vaughan et al. 2003)
 (4)
(4)
Summary of the MWL observations.
with S2 being the sample variance,  the mean square error, and
  the mean flux.
Moreover, these quantities are calculated in the 0.3–10 keV, 0.3–2 keV, 2–10 keV, and UVOT V, B bands in the case of the particular parts of the 2005–2022 period (‘Periods’ 1–6), which were selected based on the flaring activity of the target in the XRT band (see Table 3).
Summary of the XRT and UVOT observations in different periods.
Using the data trains from the XRT, ASM, R-band, and LAT observations, we constructed a Lomb-Scargle periodogram (LSP; Lomb 1976; Scargle 1982) in order to check for possible quasi-periodic behaviour in the flux variations. The LSP is an improved Fourier-based technique developed for unevenly sampled time series gn without interpolation for the data gaps (VanderPlas 2018):
![Mathematical equation: $$ \begin{aligned} P(f)={A^2\over 2}\left(\sum \limits _{n}{g_n \cos (2\pi f[t_n-\tau ]} \right)^2+{A^2\over 2}\left(\sum \limits _{n}{g_n \sin (2\pi f[t_n-\tau ]} \right)^2, \end{aligned} $$](/articles/aa/full_html/2022/12/aa44748-22/aa44748-22-eq15.gif) (5)
(5)
where A, B, and τ are arbitrary functions of the frequency f and observation times. An LSP is able to detect the most significant spectral power peak (if any exist), and estimates its significance by testing the false-alarm probability of the null hypothesis.
An alternative check for the reliability of the detected LSP peak is the weighted wavelet Z-transform (WWZ) method introduced by Foster (1996). The WWZ is a periodicity analysis technique in both the time and frequency domains suitable for discovering variability timescales and is robust against missing data:
 (6)
(6)
where Neff is the so-called effective number of data points; and Vx and Vy are the weighted variation of the data x(t) and model function y(t), respectively.
We performed the 0.3–10 keV spectral analysis using the package XSPEC (version 12.12.1) included in HEASOFT. For this purpose, the latest response matrix from the XRT calibration files from Swift CALDB and ARFs were adopted. The instrumental channels were combined to include at least 20 photons per bin by means of the FTOOLS task GRPPHA (enabling the use of χ2-statistics). The spectra were corrected for absorption with a neutral hydrogen (H I and H2) column density fixed to the Galactic value of 5.57 × 1021 cm−2 (Willingale et al. 2013) and fitted with the different absorbed models, which are generally applicable for the X-ray spectra of blazars: (i) a single power-law model, given by
 (7)
(7)
where the normalisation factor K is given in units of photons cm−2 s−1 keV−1; E, the photon energy in keV; and Γ is the photon index throughout the observation band; (ii) the log-parabola model (Massaro et al. 2004):
 (8)
(8)
with the reference energy E1 = 1 keV, where a is the photon index at the energy E1; b is the curvature parameter; and K is the normalisation factor. For each spectrum, the model validity was checked by means of the distribution of the residuals and the reduced chi-squared ( ), or the task GOODNESS when the instrumental channels were not combined and the Cash-statistics adopted. After selecting the best-fit model, we calculated the unabsorbed 0.3–2, 2–10, and 0.3–10 keV fluxes using the tool CFLUX.
4. Results
4.1. Multi-wavelength flux variability
4.1.1. Long-term behaviour
The XRT observations of 1ES 0033+595 were distributed very unevenly in time: (i) In some epochs, the subsequent visits to the source were separated by 1.01–3.13 yr time intervals and no observations were carried out during 2006, 2008–2010, 2012, or 2016. (ii) The Swift campaign was affected by the seasonal periods of restricted visibility, occurring each year during June–July and December–January when the Sun angle reaches 47–120 degrees18. (iii) Significantly denser samplings with 1–4 day and 1–2 week time separations occurred during some periods in 2013–2022, frequently representing our target of opportunity (TOO) observations of different urgency19. Several times, there were even two different ObsIDs within a day (see Table A.1 and Sect. 4.1.3).
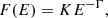
Figure 1a and Table A.1 demonstrate that the source underwent a strong X-ray variability with a wide range of the 0.3–10 keV count rate CR = 0.41(0.03) cts s−1–9.30(0.13) cts s−1 (corresponding to the unabsorbed flux F0.3−10 keV = (0.29−6.05) × 10−11 erg cm−2 s−1). The periods of the relatively intense XRT monitoring incorporated flares on timescales ranging from a few days to more than 5 months, as well as the intra-day brightness fluctuations sometimes observed within a few hundred seconds (see below). Table 2 demonstrates that the fractional variability amplitude was the highest in the 0.3–10 keV energy (as well in the particular 0.3–2 keV and 2–10 keV bands). However, our detailed study also reveals periods of significantly lower X-ray activity.
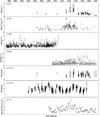 |
Fig. 1. Historical MWL light curves from the observations with different instruments: Panels: (a) XRT, 0.3–10 keV; (b) BAT, 15–150 keV; (c) ASM, 15–12 keV; (d) MAXI, 2–20 keV; (e) UVOT V-band; (f) R-band (KAIT and Tuorla telescopes); and (g) LAT, 0.3–300 GeV. While the XRT, ASM, MAXI, UVOT, and R-band data are plotted using the 1 d bins, the BAT and LAT light curves are based on data binned every two and four weeks, respectively. In panelsb and d, the black and grey data points correspond to the detections of the source with 5σ and (3–4)σ significance, respectively. In panelf, the downward grey triangles show the upper limits to the V-band flux when the detection significance was lower than 3σ. The same symbol presents the 2σ upper limit to the 0.3–300 GeV flux in the bottom panel when TS < 9 and/or Npred < 8. |
The source was detected only 18 times with 5σ significance from one-day binned BAT observations, while the two-weekly integration yielded the highest number of such detections (57 instances). Consequently, the latter was used for constructing the historical 15–150 keV light curve (see Fig. 1b). Moreover, we also plotted the data points corresponding to the detection with 3σ significance for discerning the periods of relatively enhanced hard X-ray activity from those of soft γ-ray activity20 (used by some authors for flux variability studies; see, e.g., Horan et al. 2009). While the latter detections are distributed throughout the entire period 2005–2022, the 5σ events are mainly concentrated in the epochs of the strongest 0.3–10 keV flares that show the highest BAT-band count rates. However, the maximum-to-minimum flux ratio and fvar values are significantly lower compared to their 0.3–10 keV ‘counterparts’, which is likely due to the restricted instrumental capabilities of BAT compared to those of XRT (e.g., the sensitivity of ∼10−8 erg cm−2 s−1 of BAT (Barthelmy et al. 2005) versus ∼10−14 erg cm−2 s−1 in the case of XRT (Gehrels et al. 2004).
During 1996–2011, the source was detected 451 times with the ASM above 3σ significance. However, no clearly expressed long-term flares are evident from this data train (see Fig. 1c).
In contrast to the BAT data, the highest number of the MAXI-band detections with 5σ and (3–4)σ significances occurred in the case of the one-day binned 2–20 keV data (90 and 776 instances, respectively). Although the corresponding historical light curve exhibits relatively enhanced X-ray activity in the epochs of the XRT-recorded flares, no long-term trends are evident in this case either (Fig. 1d).
1ES 0033+595 is a very problematic target for UVOT. The source is situated very close to the Galactic plane. Such a location is associated with very high extinctions in thee optical (2.48–4.05 mag) and UV (5.35–7.74 mag) bands that cause an extreme faintness of the source. The situation is further deteriorated by the presence of two bright Galactic stars on both sides of the target, close to its direction. Consequently, the exposures in each band are very limited. The emission from those stars can be blocked by the onboard software, but this also affects the faint emission from the target. Consequently, only the upper limits to the UV emission were derived in the UVW1–UVW2 bands, except for three observations in UVW1. However, those limits in the UVM2 and UVW2 bands were unnaturally higher than in the longer wavelength bands, and we did not include those values in Table A.2. Upper limits were derived for 2.5%, 18.6%, and 63.6% of the observations performed in the V, B, and U bands, respectively. Consequently, the derived flux values were associated with large errors and the obtained final data trains in these bands (in mJys) show only a marginal variability at the 3σ confidence level (see Table 2 and Fig. 1e). The relatively densely sampled R-band observations with the Tuorla and KAIT telescopes (compared to those obtained with UVOT) show an optical variability on timescales from several months to a few years in the period 2002–2019 (Fig. 1f), although the corresponding ℜ and fvar values were much lower than their counterparts in the XRT-band (see Table 2).
Generally, 1ES 0033+595 is a faint γ-ray source, and we used the eight-weekly integration in order to obtain significant detections for the vast majority of the time bins (94.4%). As for the shorter integration times, significant detections were achieved in the case of 79.4%, 35.4%, and 11.1% of the four-weekly, two-weekly, and weekly bins, respectively. The eight-weekly binned light curve is presented in Fig. 1g: we observe a moderate flaring behaviour on the various timescales, which was significantly stronger than those observed in the R, BAT, and MAXI bands. The strongest HE activity was recorded during 2011–2016, including the epoch of the strongest XRT-band flares and the preceding time interval not covered by the XRT observations. However, this behaviour becomes gradually more weakly expressed when adopting the four-weekly to weekly integration times (see Table 2), owing to the increasing uncertainties and our adopted cuts for the parameters TS and Npred. We note that the aforementioned five-year period of the general enhanced activity was characterised by the most frequent significant detections within a few days (see Table B.1). Namely, there were eight detections of the source from one-day binned LAT observations (out of the total of ten). Several times, the 0.3–300 GeV flux exceeded a level of 10−7 ph cm−2 s−1 during those instances, as well from two-day, three-day (in 2011 February, 2014 November–December), and one-week (2015 January) bins.
4.1.2. MWL variability in different periods
The general results from Periods 1–6 (see Table 3) can be summarised as follows:
-
The most densely sampled and regular XRT monitoring of 1ES 0033+595 was performed in Period 3 (19% of all XRT observations) when the source showed three consecutive short-term flares by a factor of 2.3–3.1 and the 0.3–10 keV count rate attained the highest historical value of ∼9.5 cts s−1 (corresponding to the unabsorbed 0.3–10 keV flux of about 6 × 10⁻¹⁰ erg cm−2 cm−1; see Fig 2c). We note that 1ES 0033+595 was the third-brightest blazar in the X-ray sky (after Mrk 421 and 1ES 1959+650) and, for that moment, the sixth blazar to surpass a level of ∼9 cts s−1. Meanwhile, the source showed a strong MAXI-band flare and moderate 15–150 keV flaring activity. A strong LAT-band flare was recorded before the XRT campaign, followed by a gradual, long-term brightening along with the aforementioned 0.3–10 keV flares.
-
A comparable 0.3–10 keV brightness level with CR ∼ 9 cts s−1 was also observed in Period 2 when the source showed two consecutive short-term X-ray flares by a factor of 2.0–3.0 recorded during the two-month Swift campaign (Fig. 2b). That period was characterised by the strong MAXI- and BAT-band flaring activities, with the highest hard X-ray levels coinciding with the peak of the second XRT- and LAT band flares. Another 0.3–300 GeV peak was observed at the start of the period, with a subsequent six-month decline.
-
Strong flaring activity occurred also during the four-weekly Swift campaign in Period 1 when the long-therm brightness decline by a factor of 2.1 was superimposed by a fast, symmetric lower amplitude flare with a maximum-to-minimum flux ratio of ℜ = 1.5 ± 0.1 (Fig. 2a). Unfortunately, the XRT observations of 1ES 0033+595 did not encompass the entire flaring cycle and therefore we cannot draw any conclusions about the intrinsic amplitude of that instance. Period 1 was characterised by the highest 15–150 keV level (simultaneously to the highest XRT-Band state and enhanced MAXI-band activity), followed by the long-term BAT-band flare (lasting ∼3.5 months, along with the frequent detections with MAXI and elevated 2–20 keV activity). During the entire period, the source underwent a HE γ-ray flare.
-
1ES 0033+595 was in an X-ray flaring state at the beginning of Period 4, when it was targeted with XRT only four times around the flare peak (Fig. 2d). The maximum 0.3–10 keV brightness level at the beginning of Period 4 was by a factor of 3.5 higher than the ‘quiescent’ level observed ∼2 months later, at the start of one of the densest XRT campaigns to date (20 observations within 95 d). During this latter campaign, the source exhibited a gradual doubling in the baseline X-ray level superimposed by low-amplitude brightness fluctuations by 40–60 per cent. Unfortunately, no XRT observations were carried our around MJD 57285 when the source showed a strong MAXI-band and moderate long-term 0.3–30 GeV flare. Moreover, the highest 0.3–10 keV fluxes were significantly lower than those recorded in Periods 2–3.
-
The source also underwent an intense 0.3–10 keV flaring activity in Period 5: at least five instances were recorded with brightenings and declines by a factor of 1.6–2.1 on timescales of 1–2 months, nearly constant baseline levels, and fastest flux doubling and halving timescales of 14 and 8 days, respectively (Fig. 2e). Again, these flares were of considerably lower amplitude than their counterparts from Periods 2–3. Another X-ray flare peaking at MJD 58500 is evident from the MAXI observation (when no XRT monitoring was carried out). No significant LAT-band flaring activity was recorded (similar to the subsequent period), with frequent detections corresponding to TS < 9 and/or Npred < 8 even in the case of the eight-weekly integration.
-
Finally, the source showed a doubling in flux within 5 weeks in Period 6, which was followed by a long-term decline by a factor of 3.2 over the subsequent 7.2 months. The latter was superimposed by low-amplitude, short-term brightenings by 20–80 per cent (Fig. 2f). The source showed an elevated MAXI-band state in the epoch of the highest 0.3–10 keV fluxes. Similar to previous periods, no significant optical activity was recorded. Long-term R-band flares and subsequent brightness drops by a factor 2–3 were recorded before Period 1, during 2002–2012 and in 2019 (MJD (58)600–588, between Periods 5 and 6). On the contrary, the period 2013-2018 was mostly characterised by very slow, low-amplitude changes in the baseline R-band level (see Fig. 1f). However, the source underwent significantly stronger and faster optical activity in 2019 (including a flare by a factor of ∼2).
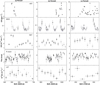 |
Fig. 2. Multi-wavelength variability of 1ES 0033+595 in different periods. The daily bins are used for the XRT, MAXI, UVOT, and R-band data, while a two-weekly integration is used for constructing light curves from the BAT and LAT observations. In the BAT and MAXI-band plots, the black and grey points correspond to the detections with the 5σ and (3–4)σ significances, respectively. The grey triangles in the LAT-related plots show the 2σ upper limits to the 0.3–300 GeV flux when the source was detected below the 3σ significance and/or showed Npred < 8. |
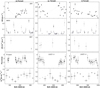 |
Fig. 2. continued. |
As for other XRT observations not included in the aforementioned periods, the target also exhibited an interesting behaviour. Firstly, there were three XRT visits to source in 2005 April–May (MJD (53)461–510), which showed a brightening by 75% in one month (see Fig. 1a). Meanwhile, BAT detected an enhanced 15–150 keV activity of 1ES 0033+595 with two detections at the 5σ confidence level (Fig. 1b). The source was targeted 13 times with XRT during 2017 February–May (MJD (57)802–900) which revealed a 0.3–10 keV brightening with flux doubling within 22 d. Subsequently, there was a decline by ∼50% in 2 weeks and weak variability during the subsequent 55 d. BAT did not detect the source even with the 3σ significance in that period. No strong X-ray activity was recorded with MAXI either (1 and 6 detections with 5σ and 3σ significance, respectively; see Fig. 1d). There was very weak variability during the one-month XRT campaign in 2020 November–December (MJD (591)65–96), incorporating a steady brightness during the last three observations performed over 6 days. The source exhibited the lowest historical 0.3–10 keV brightness of CR = 0.41 ± 0.03 cts s−1 during the XRT observations in 2021 October–November (MJD (595)18–45). A comparable level was observed also in 2022 May, preceded by a brightness decline by ∼90%. On average, the lowest LAT-band fluxes were observed in the period from 2019 to 2022. This period was also characterized by frequent detections corresponding to TS < 9 and/or Npred < 8 when adopting even eight-weekly bins. No BAT detections occurred with 5σ significance.
4.1.3. Intra-day variability
In order to detect the 0.3–10 keV flux variability on intra-day timescales (i.e. intra-day variability (IVD), variability over timescales shorter than 1 d), we applied the χ2-test. According to the latter, the source is considered variable when the null-hypothesis (assuming a constant brightness) is rejected with 99.97% confidence. The results of our study are summarised in Table 4, including 27 instances of XRT-band (IDV).
Summary of the 0.3–10 keV IDVs detected at the 99.997% and 99.5% confidence levels.
Th fastest IDVs are presented in Figs. 3a–d, and are characterised by a brightness fluctuation by 35%–83% (taking into account the associated uncertainties) and fvar = 16.3(2.4)%–24.3(4.0)% within 600–960 s. The comparable fractional variability amplitudes are found for other subhour instances with longer exposures (1.08–1.62 ks; see Figs. 3e–j and Table 4 for details), which were recorded in different X-ray states with the observation-binned count rate  (0.04)–4.48(0.09) cts s−1. We note that the source also showed seven instances of subhour IDVs at the 99.5% confidence level (so-called possible variability; Andruchow et al. 2005; see the corresponding examples provided in Figs. 3k–n). Generally, these instances were characterised by lower variability amplitudes than the aforementioned, higher confidence instances.
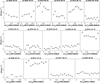 |
Fig. 3. Fastest 0.3–10 keV IDVs detected at the 99.99% (panels a–j) and 99.5% (panels k–n) confidence levels. The instances are arranged in order of increasing observation duration. |
Figure 4a presents the behaviour of the target during the densely sampled four-day XRT campaign in 2014 October (MJD(5694)5–9), with a slow decline trend and flux halving in 185 ks. However, the minimum 0.3–10 keV level was preceded by a much faster brightness drop by 65% in 5.5 ks and a subsequent rise by 80% over ∼5 ks. However, the source showed another slow decline during the subsequent 170 ks.
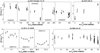 |
Fig. 4. 0.3–10 ke IDVs from the densely sampled XRT observations of 1ES 0033+595. |
1ES 0033+595 showed a flux doubling in 58 ks during the 2015 September 29 observation extended over the four different XRT orbits (Fig. 4b). A relatively slow variability with a maximum decline by 35% within a one-day interval was observed during the three subsequent XRT observations on 2014 December 5–6, during one of the highest historical 0.3–10 keV states of the source (Fig. 4c). A slow and low-amplitude IDV with fvar = 12.9(1.6)% was also recorded on 2005 April 1, incorporating ten very short XRT snapshots within 71 ks, distributed over ten different XRT orbits (Fig. 4d).
4.2. X-ray spectral behaviour
The majority of the 0.3–10 keV spectra of 1ES 0033+595 (145 out of a total of 201) show a significant curvature and are well fitted with the log-parabolic model. The corresponding results are presented in Table A.3. The distribution of values of the curvature parameter b (corresponding to the curvature detection with the significance of 3σ and higher) is provided in Fig. 5a and the corresponding properties (minimum, maximum and mean values, and distribution skewness) are listed in Table 5. We see that the source mainly showed large curvatures (b ∼ 0.5 or higher) which were sometimes higher than b = 1. The latter case is not common in the bright HBL sources (see Table 6 and Kapanadze et al. 2016a,b, 2017b, 2018a,b, 2020a). Figure 6c demonstrates that the parameter b varied on diverse timescales and the source was characterised by a relatively low curvature in the periods of the flaring X-ray states. This trend is evident in Fig. 7a where we observe a weak but statistically significant anticorrelation between the spectral curvature and de-absorbed 2–10 keV flux (see Table 7 for the value of the Spearman’s correlation coefficient ρ and the corresponding p-chance). The fastest variabilities with Δb = 0.33(0.19) and Δb = 0.44(0.21) occurred within 3.7–4.4 ks during 0.3–10 keV IDVs recorded on MJD 56948 and 57314, respectively (see Table 4). Further intra-day variability with 0.26(0.16)–0.51(0.25) occurred on MJD 55593, 56946, 56948, 57357, and 57361.
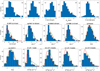 |
Fig. 5. Distribution of different spectral parameters (panels a–d) and MWL fluxes (panels f–o; the red and green curves show the lognormal and Gaussian fits to the histograms, respectively). |
Distribution of spectral parameters in the diverse periods.
Ranges of spectral parameters in the hardest HBLs.
Correlations between the spectral parameters and MWL fluxes.
Moreover, the curvature parameter showed a very weak positive correlation with the position of the synchrotron SED peak and relatively strong anticorrelation with the photon index at 1 keV (see Figs. 7b–c and Table 7). The physical implications of these instances are discussed below.
These curved spectra showed a very broad range of the photon index at 1 keV with Δa = 1.12 ± 0.28 and the hardest spectrum well-fit with amin = 0.92 ± 0.25 (see Fig. 5b). A vast majority of the spectra were hard (a < 2), very hard (Γ < 1.80), or extremely hard (a < 1.50). Figure A.1 presents examples of the 0.3–10 keV spectra of 1ES 0033+595 with a ∼ 1. On average, the hardest mean value  was observed in Period 3, with the softest one
  observed during Period 4.
Figures 7d and 6b, as well Table 7, demonstrate that the source mainly followed a ‘harder-when-brighter’ spectral trend during the aforementioned XRT-band flares. However, the scatter plot a–F2 − 10 keV shows a bend at the level F2−10 keV ∼ 2 × 10⁻¹⁰ erg cm−2 cm−1 and, on average, we observe an opposite trend for the higher X-ray states; namely no clear trend and/or even a ‘softer-when-brighter’ spectral trend is evident from Period 1, the first flare is in Period 2, with the strongest flares found in Periods 3–6. Consequently, a significant fraction of the very and extremely hard spectra do not belong to the epochs of the highest 0.3–10 keV states.
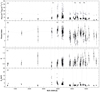 |
Fig. 6. De-absorbed fluxes and spectral parameters plotted versus time. Panels: (a) 0.3–2 keV and 2–10 keV fluxes (black and grey points, respectively); (b) photon index at 1 keV (black points) and the 0.3–10 keV photon index (grey points); (c) curvature parameter; (d) position of the synchrotron SED peak. The periods presented in Sect. 4.1.2 are located between the vertical dashed lines (with the acronym ‘P’ denoting ‘Period’). |
Similarly to the curvature parameter, the photon index showed variability at the different confidence levels by Δa = 0.21(0.13)–0.41(0.18) during some 0.3–10 keV IDVs and multi-segment observations (see Tables 4 and A.3). During the 0.3–10 keV flares, the largest variabilities of the photon index were the hardening by Δa = 1.00(0.27) and softening by Δa = 0.69(0.14) during MJD (58)348–433 and 56996–57005, respectively.
Using the values of the parameters a and b, the position of the synchrotron SED peak was calculated for each curved spectrum as (Massaro et al. 2004)
 (9)
(9)
This parameter showed an extremely wide range between Ep ∼ 1 keV and Ep > 20 keV (see Tables 5 and A.3). We note that for the spectra with Ep > 8 keV, the synchrotron SED peak is poorly or not constrained by the observational data and such Ep values should be considered as lower limits to the intrinsic position (see e.g., Kapanadze et al. 2020b). This was the case for nine spectra and the corresponding values are not included in the histogram presented in Fig. 5c; examples of the spectra with Ep beyond 10 keV are provided in Fig. A.2. These instances are concentrated in Periods 2–4, while Period 6 and the observations not included in any period are characterised by significantly lower mean values of Ep (1.66 ± 0.18 keV and 1.78 ± 0.06 keV, respectively) compared to those in Periods 1–5 (see Fig. 6d).
The last column of Table 4 shows that the position of the synchrotron SED peak varied during some 0.3–10 keV IDVs by 0.66(0.21)–0.73(0.37) keV and ΔEp ≳ 4 keV. A similar situation was seen during some multi-segment XRT observations (ObsIDs (329710)39,40,55) with no apparent flux variability. Generally, the source showed a trend of shifting SED peak towards higher frequencies, which was reflected in the strong positive correlation between Ep and unabsorbed 2–10 keV flux (see Fig. 7e and Table 7). This trend was particularly evident in Periods 2–5, in the epochs of strongest X-ray flares leading to the shifts sometimes beyond 10 keV.
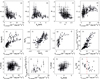 |
Fig. 7. Correlation between the spectral parameters and MWL fluxes. Panels a–c: curvature parameter b plotted versus the unabsorbed 2–10 keV flux, the position of the synchrotron SED peak Ep, and the photon index a, respectively. The parameters a and Ep are plotted versus the 2–10 keV flux in panels d–e. The scatter plot Ep–log Sp is provided in panel f. The 0.3–10 keV photon index, unabsorbed 0.3–2 keV flux, and V-band and LAT-band fluxes are plotted versus the 2–10 keV flux in panels g–j, respectively. The one-day binned V- and B-band fluxes are plotted against each other in panel k. Finally, a fvar – F2 − 10 keV plot is provided in panell where the vertical dashed red line represents the weighted mean 2–10 keV flux from all XRT observations of 1ES 0033+595. The one-day binned MWL fluxes are used in the corresponding plots, except for panelj where the four-weekly bins are adopted. |
Of 201 spectra, 56 did not show significant curvature: the detection significance was 1σ or lower and their fit with the LP model did not yield better statistics than a simple power-law model (see Table A.4). Similar to the parameter a, the range of the derived Γ values was very wide, ΔΓ = 0.83(0.11), with the hardest value being Γmin = 1.51 ± 0.07. However, the distribution histogram of this parameter shows that a significant fraction of the soft spectra (at least 25) show Γ ≥ 2 (taking into account the associated errors), compared to none of the curved spectra with a photon index securely belonging to this range. Moreover, the distributions of the parameters Γ and a are characterised by opposing tendencies, shifting towards the softer and harder values, respectively (see Fig. 5c). The power-law spectra are not extracted from those XRT observations of 1ES 0033+595 which were carried out before 2013. On the contrary, the maximum number of such spectra belong to Period 4, which was characterised by the highest mean value of  . On the other hand, the power-law spectra were the hardest with
  when the strongest X-ray flares were recorded (see Fig. 6b).
The power-law spectra showed a stronger ‘harder-when-brighter’ trend (ρ = 0.74 ± 0.06 versus ρ = 0.56 ± 0.09; see Fig. 7g). However, the scatter plot Γ–F2−10 keV shows a bend at the level F2−10 keV ∼ 2 × 10⁻¹⁰ erg cm−2 cm−1, similar to Fig. 7d and, on average, no further hardening with the increasing brightness is observed. Consequently, no extremely hard power-law spectra with Γ < 1.5 down to Γ ∼ 1 were found (in contrast to the curved counterparts).
During five IDVs (listed in Table 4), there was a transit from a logparabolic spectrum to a power-law spectrum and/or vice versa. This also occurred during 15 multi-segment XRT observations (see Tables A.3 and A.4). Similar to other spectral parameters, the 0.3–10 keV photon index varied over diverse timescales, from intra-day with ΔΓ = 0.17(0.08)–0.24(0.08) (ObsIDs 32971017 and 32971091) to the largest hardening and softening by ΔΓ = 0.34(0.09) (MJD 57264–57296) and ΔΓ = 0.40(0.08) (MJD 57296–57348), respectively.
Several XRT observations of 1ES 0033+595 were very short (∼150 s or shorter) and, consequently, the extracted spectra were extremely poor and not valid for the χ2-statistics. In those cases, we adopted the Cash-statistics, not combining the instrumental channels. However, the extracted spectra did not yield a satisfactory GOODNESS value when performing a power-law fit, possibly owing to the spectral curvature. Although a logparabolic fit yielded a better GOODNESS value, the associated errors of the parameters a and b were very high. Therefore, we have not included the corresponding results in our analysis.
5. Discussion
5.1. Spectral properties, particle acceleration, and emission processes
Our X-ray study of 1ES 0033+595 reveals the extreme spectral properties of this source over a 17-year period, which is characterised by very different time coverage in the diverse epochs. The target exhibited the hardest values of the photon index among the HBL sources: while extreme spectra with a ≲ 1.5 have rarely been observed among HBLs (reported only for 11 sources to date; see Table 6 with the lowest value of amin = 1.27 ± 0.10 for 1H 1515+660 (Kapanadze et al. 2020a), such instances amounted to 58% of all spectra fitted with the logparabolic model in the case of 1ES 0033+595. Among the extremely hard spectra, there were 13 instances with α ∼ 1. We note that very hard logparabolic spectra with a = 1.42(0.08)–1.71(0.07) were reported for the target by Giommi et al. (2002) and Perlman et al. (2005) from the BeppoSAX observations performed during 1999–2003.
Table 6 demonstrates that 1ES 0033+595 shows the largest spectral curvature among the TeV-detected HBLs, making this source the only HBL with a securely detected value of b ≥ 1 (taking into account the associated uncertainties; see also Massaro et al. 2008). This result and the distribution of the b-values presented in Fig. 5a allows us to draw some conclusions about the particle acceleration processes in the jet of 1ES 0033+595. Namely, there are two possible scenarios that could lead to the establishment of a curved particle energy distribution (PED) that produces a logparabolic photon distribution with energy: (i) first-order Fermi mechanism at a relativistic shock front propagating in a magnetised jet medium, where electrons and other charged particles are confined by a magnetic field with a confinement efficiency that decreases with increasing gyroradius (i.e. with the energy of the particle). In this scenario, the probability pi of further acceleration of the particle at step i is related to its Lorentz factor (energy) γi as  , with g and q being constants. In the case where q > 0, the probability pi becomes gradually lower with increasing energy. Consequently, a logparabolic PED can be established (the so-called energy-dependent acceleration probability (EDAP) process) which is given by Massaro et al. (2004):
 (10)
(10)
which produces the logparabolic photon distribution given with Eq. (9) where a = (s − 1)/2 and b = r/4. Within the EDAP, a linear relationship between the s and r terms are as follows
 (11)
(11)
In terms of X-ray spectral analysis, this relation should yield the a − b correlation. The anti-correlation between these parameters presented in Fig. 7a is expected when g > γ0; that is, there were electron populations with a very low initial energy γ0 in the emission zone (Kapanadze et al. 2020b). The same result also explains the frequent occurrence very hard and extremely hard values of the photon index at 1 keV: the first-order Fermi acceleration shifts the electron population with very low initial energy predominantly to the energies capable of producing photons around E ∼ 1 keV and relatively less frequently to the higher energies. This yields the spectral hardening at the reference energy and derivation of very hard and extremely hard a values, as well as establishment of a large spectral curvature. However, the observed anti-correlation a − b was weak, which hints at the co-existence of other acceleration processes (e.g., stochastic and hadronic mechanisms), yielding a significant number of hard X-ray photons and resulting in the observation of power-law spectra with very or extremely hard photon indices, along with a shift of the synchrotron SED peak to hard X-ray frequencies; (ii) stochastic acceleration, arising from the magnetic turbulence which is strongly enhanced by the relativistic shock passage through the magnetised jet medium (Tramacere et al. 2009). The curvature parameter is inversely proportional to the stochastic acceleration rate, and consequently the synchrotron SED is relatively broad (b ∼ 0.3 or lower) when the stochastic acceleration is more efficient (Massaro et al. 2011b). The distribution provided in Fig. 7a shows a relatively low portion of the spectra with b ∼ 0.3 or lower, while the spectra with b ∼ 0.5 and higher are favoured by the EDAP (see Kapanadze et al. 2020b). The presented distribution, with a significantly larger portion of the spectra with a large curvature and the presence of power-law spectra, reveals that the first-order Fermi mechanism is of greater importance than the second-order one in the target source.
Moreover, the observed distribution of the parameter b explains a rare TeV detection for the source: Massaro et al. (2011b) obtained a low probability (∼12%) for the generation of TeV photons in HBL sources when the curvature is higher than the boundary value b* = 0.55. Indeed, no TeV detection was reported for 1ES 0033+595 in any period with b > b*. On the contrary, the source showed broad synchrotron SEDs with b ∼ 0.3 in 2013 September (MJD (565)48–65) along with one TeV flare reported to date.
The anti-correlation between the parameters b and Ep is predicted in the framework of both EDAP and stochastic accelerations, although with different slopes of the scatter plot Ep–b (see Kapanadze et al. 2020b). Consequently, there is a large scatter of the data points and weakness in the anti-correlation, as exhibited in Fig. 7b. According to the Monte Carlo simulations of Katarzynski et al. (2006), electrons can be accelerated at the shock front by the EDAP and continue to gain energy via the stochastic mechanism in the downstream shock region. After some time, a particle will be able to re-enter the shock acceleration region and repeat the acceleration cycle. The co-existence of both mechanisms in the jet area with the electron population with very low initial energy can be explained by the weak Ep–b anti-correlation, and the very hard values of the photon index at 1 keV and large spectral curvature.
Moreover, the source showed a positive F2 − 10 keV–Ep correlation (as discussed in Sect. 4.3), that is, a trend of shifting the synchrotron SED peak to higher energies with rising X-ray flux. The simulations of Tramacere et al. (2009) demonstrated that as Ep increases, the mean cooling timescale of the X-ray-emitting electron population shortens and can compete with the acceleration timescales. In such a situation, a weakening of the Ep–b anti-correlation is expected, because the cooling timescale is shorter than that of EDAP or stochastic acceleration.
As discussed in Sect. 4.2, the source showed fast logparabolic-to-power-law PED transitions and vice versa for the spectra extracted from the different segments of a single XRT observation. The most extreme case was that with ObsID 32971014: the spectra extracted from the second and fourth segments are logparabolic, while the spectra from the first and third segments do not show a significant curvature and are well fitted with the power-law model. The time intervals between these segments were 5.28–36.16 ks, respectively. If we adopt the typical value of the bulk Lorentz-factor for the emission zone, namely Γem = 10 (Falomo et al. 2014), then these transitions occur over the spatial scales dtr = cttrΓem/(1 + z) = (1.08–7.19) × 1016 cm, that is, 3.50 × 10⁻³–2.33 × 10⁻² pc, where the tentative redshift value of 0.467 (Paino et al. 2017) is used. A transition chain logparabola → power-law → logparabola occurred during the second–fourth segments of ObsID 33484005 with time separations of 1.16–3.84 ks, corresponding to dtr = (2.37–7.85) × 1015 cm. Other transitions occurred over the spatial scales of 7.98 × 10¹⁵–5.77 × 1016 cm. This result leads to the suggestion that the jet physical conditions were significantly variable over the spatial scales of ∼1015 − 16 cm: as the logparabolic and power-law PEDs are established at the relativistic shock front, there was a subsequent shock passage through the area with magnetic fields of different confinement efficiencies and/or between those with strong turbulence (curved spectrum with b ∼ 0.3) and weak or absent turbulence (power-law spectrum). The source sometimes showed a fast transition from high to low curvature or vice versa over the aforementioned timescales, indicating a fast change into the magnetic field properties: transition from the larger scale magnetic field with the energy-dependent confinement efficiency into the turbulent one, or conversely.
Some further conclusions about the particle-acceleration mechanisms can be drawn when we study the spectral evolution of the X-ray flare in the photon index–flux plane (so-called spectral hysteresis). In this case, the source may follow a clockwise (CW) spectral loop if the spectral evolution is due to the flaring component starting in the hard X-ray band. Such a component is triggered by a rapid injection of very energetic particles rather than by a gradual acceleration (Tramacere et al. 2009). This scenario could be compatible with the EDAP within the Bohm’s limit of particle diffusion. In that case, with a 1-Gauss magnetic field, a relativistic shock, and an electron energy of γ ∼ 105 (required for the production of the observed X-ray emission in blazars), the first-order Fermi mechanism yields acceleration timescales shorter than 1 sec (see Tammy & Duffy 2009). In such a scenario, the acceleration and injection of electrons into the emission zone would be instantaneous. Figure 8a presents an example of the CW-type spectral loop, and a list of such instances is presented in Table 8. Sometimes, two different, subsequent CW-loops were observed during a single X-ray flare (see Fig. 8c for the corresponding example).
 |
Fig. 8. Examples of different types of spectral hysteresis. Panels: (a) CW loop; (b) CCW loop; (c) and (d) two subsequent CW and CCW loops; (e) transition from a CW loop into a CCW loop. |
CW and CCW loops shown by 1ES 0033+595 in the photon index–flux plane.
However, the first-order Fermi acceleration cannot be considered instantaneous in the case of the significantly weaker (sub-Gauss) fields frequently inferred from the one- or multi-zone SSC modellings. In that case, EDAP will yield a gradual acceleration of electrons. Consequently, X-ray flares will propagate from low to high energies and a counterclockwise (CCW) spectral evolution should be observed (Tramacere et al. 2009). We note that the slow, gradual acceleration and CCW loops are also expected during the stochastic acceleration in the jet region with low magnetic field and high matter density Virtanen & Vainio (2005). Such a spectral evolution of 1ES 0033+595 was observed more frequently than the CW one (see Table 8 and Fig. 8b). Several times, two subsequent CCW loops or a CCW→CW transition (or conversely) were observed during the single X-ray flare (see Figs. 8d and e, respectively). Along with the aforementioned cases, some X-ray flares or their particular parts did not exhibit any clear trend, possibly owing to the co-existence of different acceleration mechanisms and complex physical conditions in the jet of the target (as discussed above).
Figure 5d and Table A.3 demonstrate that at least 64% (taking into account the associated errors) of the curved spectra show their Ep values in the hard X-ray energy range, which has rarely been observed in HBLs. Namely, this portion amounted to 2%–24% in the brightest source, Mrk 421, in different periods, and 28%–48% in 1ES 1959+650 during the exceptionally strong flaring activity in 2016–2017 (Kapanadze et al. 2016c, 2018a,b, 2020b). On the other hand, a much higher portion of the hard-X-ray-peaked spectra are found for Mrk 501 during its period of similar behaviour in 2014 March–October (95%; Kapanadze et al. 2017b). The latter result could be related to the lower importance of the physical ‘agents’ preventing the maximum electron energy distribution at the energies required to emit hard X-ray photons (e.g., EDAP with very low initial energy distribution, injection of a new soft-X-ray flaring component during X-ray flares; see below) in Mrk 501. In contrast to this source, 1ES 0033+595 has never been observed as an ultra-high-energy BL Lac (UHBL), which are defined as HBL sources exhibiting the synchrotron SED peak at frequencies higher than 1019 Hz (≈41.4 keV; see Giommi et al. 2001).
On the other hand, 1ES 0033+595 was mostly an extreme EHBL source (see Sect. 1 for the definition): at least 75% of the 0.3–10 keV spectra show their synchrotron SED peak at the energies beyond 1 keV, including those well fit with the power-law model. The peak positions of the latter spectra were estimated by fitting their broadband synchrotron SEDs with the log-parabolic function log νFν = A(log ν)2 + B(log ν)+C (Landau et al. 1986). For the softest power-law spectrum, this function yields Ep ≈ 0.2 keV versus the most extreme case Ep > 23.2 keV (see Sect. 4.2), that is, the synchrotron peak frequency  = Ep/h Hz (h, the Plank’s constant) varied by more than two orders of frequency in the course of the 17-year XRT monitoring of the target.
We detected a strong positive correlation between log Ep and log Sp (see Fig. 7f and Table 7), where the height of the synchrotron SED peak Sp was calculated as (Massaro et al. 2004)
 (12)
(12)
The slope of this scatter plot is α = 1.0 ± 0.1, that is, the source showed the relation  with α = 1. This result is expected when the spectral changes are dominated only by variations in the average electron energy and the number of X-ray emitting particles N is constant (Tramacere et al. 2009). As for other bright HBLSs, this relation with α ∼ 0.6 was reported for Mrk 421 (2015 December–2018 April; Kapanadze et al. 2018b) 1ES 1959+650 (the period 2016–2017; Kapanadze et al. 2018b), and Mrk 501 (during the strong long-term flare in 2014; Kapanadze et al. 2017b). These cases imply that the main driver of the observed spectral changes is the variability of the parameters Dp (the momentum-diffusion coefficient) and q (the exponent describing the turbulence spectrum): a transition from the Kraichnan-type into the ‘hard sphere’ spectrum during the stochastic acceleration of the particles (as demonstrated by the Monte Carlo-based simulations of Tramacere et al. 2011). As such a relation was not observed for 1ES 0033+595, this result provides us with another argument in favour of the relative weakness of the jet turbulence.
As for the very hard power-law spectra, their origin could be related to the significant contribution of the photons of hadronic origin to the X-ray emission of 1ES 0033+595. For example, the proton blazar model (Mannheim 1992 and references therein) predicts the generation of X-ray spectra with Γ ∼ 1.5–1.7, which was indeed found for at least 20% of the power-law spectra of the target. Moreover, the target frequently showed these values or even harder down to Γ ∼ 1 (see Fig. 5e). According to Shukla et al. 2015, such a very or extremely hard γ-ray spectrum can be obtained much more naturally within hadronic scenarios, while achieving a hard spectrum within the leptonic models is significantly more difficult.
5.2. Variable character and physical implications
It is evident that the source is characterised by very uneven X-ray flaring activity over time: the period of strong flaring activity (2013–2016) was followed by progressively decreasing mean 0.3–10 keV states, and finally the XRT observations in 2021–2022 revealed 1ES 0033+595 as a faint X-ray source with (1) CR < 1 cts s−1 (corresponding to the unabsorbed flux F0.3 − 10keV = (2.9–5.0) × 10−11 erg cm−2 s−1); (2) gradually lower mean count rates and detection frequency over time by the Swift-BAT and MAXI instruments; and (3) lower 0.3–300 GeV fluxes and an increasing number of low-significance detections with Fermi-LAT even in the case of the eight–weekly integration. Moreover, the source did not show strong flaring activity in 1996–2011 during the intense RXTE-ASM monitoring (in agreement with the daily Swift-BAT and MAXI monitoring since 2004 and 2009, respectively).
Figure 9 presents the Lomb-Scargle periodograms constructed using the XRT, ASM, R-band, and LAT-band (with different bins) flux values. No significant evidence of (quasi)periodicity is found, except for some peaks clearly related to the observational seasonality. As the erratic long-term flares are explained by propagation of strong relativistic shocks through the BLL jet (see Sokolov et al. 2004 and references therein), the strong flaring activity in 2013–2016 could be related to the enhanced collimation rate through the jet, triggering the propagation of strong shocks. On the contrary, this rate could be lower in the preceding and following years, yielding a relative weakness or even absence of the relativistic shocks. On the other hand, as the jet turbulence is expected to be amplified by a relativistic shock passage in the magnetised medium (see e.g., Marscher 2014), the turbulence and shock strengths should be positively correlated. Our X-ray spectral study is in favour of this suggestion: on average, the source showed the lowest spectral curvature (i.e. efficient stochastic acceleration of electrons by magnetic inhomogeneities, predominantly of turbulent origin) in the epochs of the strongest 0.3–10 keV flares. The latter could be triggered by the strongest shocks during the period presented here.
 |
Fig. 9. Lomb-Scargle periodogram from the MWL observations of 1ES 0033+595. |
Figure 7l shows an anti-correlation between the fractional amplitude and mean flux during the corresponding XRT observation for the 0.3–10 keV IDVs detected at the 99.97% confidence level. According to Zhang et al. (2006), this result indicates a strong non-stationary origin of the X-ray variability. We note that the majority of these instances occurred in the elevated X-ray states. The IDVs observed during the flaring epochs favour the shock-in-jet scenario, incorporating the interaction of a propagating shock front with the jet inhomogeneities characterised by higher magnetic field and matter density compared to the surrounding jet medium (see Sokolov et al. 2004 and references therein). The IDVs caused by other mechanisms, such as those operating in the innermost blazar area, should be more conspicuous when the source is relatively faint, that is, the variable emission from the black hole vicinity will not be overwhelmed by the huge amount of flux produced at the shock front (see e.g., Kapanadze et al. 2016a, 2020b). Such instances could be more numerous than those revealed within our study, as their detection is prevented by the significantly lower signal-to-noise ratio in faint compared to elevated X-ray states.
The duty cycle (i.e. the fraction of total observation time during which the object displayed IDVs; see Romero et al. 1999 and references therein) of the 0.3–10 keV IDVs detected at both 99.97% and 99.5% confidence levels amounted to 26.5%, which is significantly lower than those reported for Mrk 421 (43%–84% in different epochs; Kapanadze et al. 2016c, 2018a, 2020b), Mrk 501 (51.5%, during the strong, long-term X-ray flaring activity in 2014 March–October; Kapanadze et al. 2017b), and 1ES 1959+650 (40%–52%, during the similar behaviour in 2016 February–2017 November; Kapanadze et al. 2018b). However, this result could be related to the fact that, on average, these sources were much brighter and the subjects of denser observational sampling with XRT. We note that 1ES 1959+650 showed a significantly lower DC during the XRT campaigns performed in the periods 2005–2014 (28.2%; Kapanadze et al. 2016a) when the mean 0.3–10 keV count rate and observational sampling was comparable to those of 1ES 0033+595.
The source showed one instance of intra-day flux-doubling with τd≈12 h, calculated as τd, h = Δt × ln(2)/ln(F2/F1) (Saito et al. 2013). We note that the flux-doubling time can be used to constrain the upper limit to the variable emission zone as follows:
 (13)
(13)
with Rem and Γem, the size and Lorentz-factor of the emission zone, respectively. Adopting the typical value of the bulk Lorentz-factor for the emission zone Γem = 10, we obtain an upper limit of 8.0 × 1015 cm for the emission zone responsible for that extreme variability.
We note that the subhour IDVs are generally observed in the epochs of short- or long-term flares which occurred in Periods 4–6 (see Table 4). Consequently, these instances could be triggered by the interaction between the moving shock front and smallest scale jet inhomogeneities containing the strongest magnetic fields, as demonstrated by Mizuno et al. (2014). We also note that the source mainly showed power-law spectra or those with relatively large curvature during the XRT observations with subhour IDVs (see Col. 7 of Table 4), which suggests a higher importance of the first-order fermi acceleration compared to the stochastic one. The same was observed during other 0.3–10keV IDVs that also show a transition between the high and low spectral curvatures, or between the power law and logparabolic during some instances. This result demonstrates a fast change of the magnetic field properties in the jet of the target.
The source exhibited an unequal 0.3–10 keV activity on intra-day timescales in different epochs. While the source underwent 11 instances of subhour variability, including those four IDVs detected within the exposures shorter than 1 ks, the source did not vary at the 3σ confidence level during some extended multi-segment XRT observations with a total time span of 30–86 ks (Fig. A.3). These observations were carried out in the epochs of the diverse X-ray states of the target, ranging from the faint (CR ≲ 1 cts s−1) to the flaring ones (CR ≳ 5 cts s−1) when it is generally easier to detect the IDV. Namely, the source did not show variability at the 3σ confidence level during the four-day XRT campaign in 2014 November (Figs. A.3d–f), which was performed during one of the highest 0.3–10 keV states of 1ES 0033+595 (the second strong XRT-band flare in Period 2; see Fig. 2b). This result may also indicate a variable turbulence strength in the jet of 1ES 0033+595, leading to the lack or even absence of small-scale inhomogeneities with strong magnetic fields in some epochs. Such a physical condition in the jet emission zone could yield a passivity of the source on intra-day timescales (see also Sect. 5.1 for a discussion of the stochastic acceleration in the jet of our target).
While the unabsorbed 0.3–2 and 2–10 keV fluxes showed a strong cross-correlation, the V-band (from the UVOT observations) and XRT-band emissions were not correlated (see Fig. 7i; a similar situation is also seen in the scatter plot F0.3 − 10 keV − FR). Although the four-weekly-binned LAT-band flux shows an increasing trend with the 2–10 keV flux, the correlation confidence level was below the adopted threshold of 99%21 ( Fig. 7j) and the corresponding ρ value is not provided in Table 7. However, the source was strongly variable in the XRT band on significantly shorter timescales (down to intra-day timescales) and those variations are smoothed out in the four-weekly binning. We also checked the correlation existence for the two-weekly and weekly bins, but the situation was not amended owing to the gradually increasing upper limits to the 0.3–30 GeV flux not being included in our study. We note that the LAT and XRT light curves show a correlated long-term behaviour: elevated HE γ-ray states were observed during the strongest 0.3–10 keV flares and vice versa, and detection of the positive correlation is prevented by the general faintness of the source in the 0.3–30 GeV energy range. Consequently, we cannot derive the LAT-band fluxes using the integration over one or a few days, which is reliable for checking the correlation presence. A positive F0.3−10 keV − F0.3−300 GeV correlation could be related to the IC up-scatter of X-ray photons in the Klein-Nishina regime, yielding fewer HE photons than in the case of the up-scatter in the Thomson regime and therefore a general faintness of the source in the LAT-band.
Figure 7k presents a weak positive FB–FV correlation with ρ = 0.41 ± 0.10, while very strong cross-correlations between the different UVOT-band fluxes are generally reported for the HBL sources indicating their origin in the same particle population and emission mechanism (see e.g., Kapanadze et al. 2016a, 2017b, 2020b). However, this weakness should rather be related to the extreme faintness of 1ES 0033+595 and to the high errors associated to the derived optical flux values, resulting in low signal-to-noise ratios. The latter prevent detection of the intrinsic optical variability and possible strong inter-band cross-correlations.
Similar to other bright HBLs, the source generally demonstrated a harder-when-brighter spectral behaviour during the 0.3–10 keV flares (see Sect. 4.2). Such a spectral evolution demonstrates a stronger and faster variability in the number of the electrons producing X-ray photons by the synchrotron mechanism. This trend is explained by the shift of the synchrotron peak towards higher energies (as observed for our target and discussed in the previous subsection). The latter is likely related to the injection of high-energy particles dominating in the observed brightness variations, as well to the dominance of synchrotron cooling of the highest energy electrons over the IC cooling (Zhang 2010). However, the source showed a deflection and even the opposite spectral evolution during the highest states of the strongest 0.3–10 keV flares observed in 2013–2016. As the softer-when-brighter trend is explained by the emergence of a soft X-ray component in the X-ray emission zone, which results in a brightness increase while softening the observed 0.3–10 keV spectrum (see e.g., Kapanadze et al. 2020b), we suggest that those highest states (and therefore exclusively strong X-ray flares) were due to the addition of a new, soft flaring component in the emission zone to the existing hard one. Consequently, the net 0.3–10 keV flux increased significantly and stronger X-ray flares were recorded, while destroying the ongoing harder-when-brighter spectral evolution. Therefore, the observed X-ray variability of 1ES 0033+595 sometimes required the adoption of a rather more complex emission scenario than the one-zone SSC model.
A lognormal flux variability in blazars is explained as an imprint of the instable processes of the disc on the jet (McHardy 2008 and references therein). More specifically, the lognormal fluxes show fluctuations that are, on average, proportional to the flux itself, and are indicative of an underlying multiplicative rather than additive physical process. As noted above, the long-term flares are explained by the propagation and evolution of relativistic shocks through the blazar jet. In its turn, a shock can be triggered by the instabilities occurring in the accretion disc, which may momentarily saturate the jet with extremely energetic plasma with significantly higher pressure than the steady jet plasma downstream (Sokolov et al. 2004). Consequently, a lognormal long-term flaring behaviour of the source may indicate a variability imprint of the accretion disc on the jet.
In order to investigate lognormality, we constructed histograms from all the available flux values for 1ES 0033+595 in the diverse energy ranges and fitted them with the Gaussian and lognormal functions. Figure 5f demonstrates that the distribution of the unabsorbed 0.3–10 keV flux is closer to the lognormal shape than to the Gaussian one (see also Table 9). A similar situation was found in the case of the MAXI and ASM-band variability (Figs. 5h–5i).
Goodness of fit for flux distributions in various energy bands.
However, this difference is less pronounced in the BAT band (Fig. 5g), possibly owing to the significantly shorter data train selected by using the 5σ detection threshold. The difference is even smaller in the optical energy range, in the case of the R-band and UVOT V-band fluxes (Figs. 5j–k). This result could be related to the higher importance of the local, jet-related instabilities in the production of optical photons.
The situation is more complicated in the 0.3–300 GeV energy range: while the distribution of the fluxes extracted from the eight-weekly binned LAT data is closer to the lognormal model, the inverse situation becomes progressively apparent for the four-weekly and two-weekly bins (Figs. 5o and 5n–5m, respectively). However, his trend could be rather related to the gradually increasing number of bins with the upper limit to 0.3–300 GeV flux (not used for constructing histograms) which are generally concentrated towards the states of the source, that is, lower flux values where the lognormal peak is situated. Therefore, these histograms are biased towards the higher brightness states and do not present the intrinsic HE behaviour of the target.
6. Summary and conclusions
We present the results of long-term MWL carried out for the X-ray-selected BL Lac source 1ES 0033+595. The MWL data set was obtained by several space and ground-based instruments. These sets provide information from optical (with Tuorla and KAIT) to HE gamma rays (with Fermi-LAT), and including various instruments covering the optical-to-UV (Swift-UVOT) and X-ray bands (Swift-XRT, Swift-BAT, MAXI and RXTE-ASM). The main achievements of our study can be summarised as follows:
-
At the X-ray frequencies, the source exhibited strong and erratic flux variability. The strongest XRT-band flares were recorded in the period 2013–2016, when the unabsorbed 2–10 keV flux was frequently higher than 2 × 10⁻¹⁰ erg cm−2 cm−1 and 1ES 0033+595 became one of the brightest blazars in the X-ray sky during those observations. In the same period, the most frequent detections with 5σ significance and the highest 15–150 keV states were observed with BAT. However, the source became gradually fainter over the subsequent years, with progressively lower amplitude variability, and finally became a faint X-ray object in 2021–2022. No strong flaring activity was detected with the different X-ray instruments in the period 1996–2011. A similar behaviour was observed in the HE γ-ray band where a long-term elevated mean 0.3–300 GeV state was recorded during 2011–2016, superimposed by the moderate-amplitude flares and exceeding a level of 10−7 ph cm−2 cm−1 several times in the case of the daily to weekly binned LAT observations. However, that period was followed by progressively declining mean 0.3–300 GeV states over the subsequent years, with a decreasing proportion of highly credible detections even in the case of the eight-weekly integration.
-
The lognormal function was well fitted with the histograms constructed on the basis of the XRT, ASM, MAXI, BAT, and LAT band fluxes, which hints at imprinting of the disc instable processes on the jet (e.g., shock propagation through the jet was triggered by the disc instable processes). However, the lognormal function provided a slightly better fit for the optical emission compared to the Gaussian one, which could be the result of ‘contamination’ by the photons related to the local, jet-inherent instable processes.
-
The target mainly exhibited an X-ray spectral curvature and the hardest values of the photon index at 1 keV among the HBL sources: more than half of the curved spectra showed very and extremely hard values with a ≲ 1.5, and even down to α ∼ 1 for 13 spectra, which has not been reported for any HBL to date. We explain this feature as being the result of the efficient first-order Fermi acceleration of the electron population with a very low initial energy distribution, predominantly to energies of E ∼ 1 keV and less frequently to higher energies. This yielded a spectral hardening at the reference energy and derivation of very hard and extremely hard a values, as well as the establishment of the high spectral curvature: on average, 1ES 0033+595 showed the largest b-value spectral curvature among all TeV-detected HBLs. This object is the only HBL source with a securely detected b ≥ 1 and a majority of the curved spectra showed b > 0.5. This result, along with the absence of significant curvature in about 28% of all 0.3–10 keV spectra, hints at the higher importance of the first-order Fermi acceleration compared to the second-order acceleration in the jet and explains why TeV detections of the target are rare.
-
At least 64% of the curved spectra showed the position of the synchrotron SED peak in hard X-rays (including seven instances with Ep> 10 keV), which is uncommon in HBLs. The source showed the relation
 with α = 1, which is expected when the spectral changes are dominated only by variations in the electron average energy and the number of X-ray-emitting particles is constant.
 -
More than 20% of the power-law spectra were very hard with Γ ∼ 1.5–1.7 which could be related to the significant contribution of the hadronic-origin photons to the X-ray emission, as predicted within the proton blazar model. This suggestion is corroborated by another of our results: the target frequently showed these values or even harder down to Γ ∼ 1 in the 0.3–30 GeV energy range, which can be explained more naturally within the hadronic scenarios, in contrast to the leptonic models.
-
The source showed fast transitions logparabolic-to-power-law energy distribution and conversely for the spectra extracted from the different segments of the particular XRT observations. This result indicates that the physical conditions of the jet were significantly variable over the spatial scales of ∼1015 − 16 cm, probably owing to the areas of magnetic field with different confinement efficiencies and/or different turbulence strengths. Sometimes, the source showed a fast transition from high to low curvature or conversely over similar spatial scales. Such behaviour indicates a fast transition from the larger scale magnetic field with the energy-dependent confinement efficiency to the turbulent one or vice versa.
-
The source mainly followed a harder-when-brighter spectral evolution during the 0.3–10 keV flaring activity (generally reported for HBLs), which is explained by the shift of the synchrotron peak towards higher energies. The latter could be related to the injection of high-energy particles with a hard energy distribution, as well as to the dominance of synchrotron cooling of the highest energy electrons over the IC cooling. However, the source showed a deflection from this trend and even the opposite spectral evolution during the high states – with F2−10 keV ≳ 2 × 10⁻¹⁰ erg cm−2 cm−1– recorded in the course of the strongest 0.3–10 keV flares in 2013–2016. As such a trend is explained by the emergence of a soft-X-ray component in the X-ray emission zone, we conclude that those highest states (and therefore the strongest X-ray flares) were related to the emergence of a new, soft flaring component in the emission zone in addition to the existing hard one.
The three leading zeroes in observation IDs (ObsIDs) are omitted throughout the paper.
T. Mihara (priv. comm.)
We adopt E = 100 keV as a dividing line between the X-ray and γ-ray energy ranges.
The same is also in the case eight-weekly binned scatter plot.
Acknowledgments
We thank Shota Rustaveli National Science Foundation and E. Kharadze National Astrophysical Observatory (Abastumani, Georgia) for the fundamental research grant FR−21–307. This research has made use of the XRTDAS software, developed under the responsibility of the ASDC, Italy, and the MAXI data provided by RIKEN, JAXA and the MAXI team, as well the data obtained through the High Energy Astrophysics Science Archive Research Center Online Service, provided by the NASA/Goddard Space Flight Center; the Swift-BAT transient monitor, RXTE-ASM and KAIT results provided by the Swift-BAT, RXTE-ASM and KAIT teams, respectively. Finally, we thank the anonymous referee for his/her useful suggestions.
References
- Abdo, A. A., Ackermann, M., Ajello, M., et al. 2009, ApJ, 707, 1310 [NASA ADS] [CrossRef] [Google Scholar]
- Abdo, A. A., Ackermann, M., Ajello, M., et al. 2010, ApJS, 188, 405 [NASA ADS] [CrossRef] [Google Scholar]
- Abdollahi, S., Acero, F., Ackermann, M., et al. 2020, ApJS, 247, 33 [Google Scholar]
- Acero, F., Ackermann, M., Ajello, M., et al. 2015, ApJS, 218, 23 [Google Scholar]
- Ackermann, M., Ajello, M., Allafort, A., et al. 2013, ApJS, 209, 34 [NASA ADS] [CrossRef] [Google Scholar]
- Aleksic, J., Antonelli, L. A., Antoranz, P., et al. 2011, ApJ, 729, 115 [NASA ADS] [CrossRef] [Google Scholar]
- Aleksic, J., Ansoldi, S., Antonelli, L. A., et al. 2015, A&A, 446, A217 [Google Scholar]
- Andruchow, I., Romero, G. E., & Cellone, S. A. 2005, A&A, 442, 57 [Google Scholar]
- Atwood, W. B., Abdo, A. A., Ackermann, M., et al. 2009, ApJ, 697, 1071 [CrossRef] [Google Scholar]
- Barthelmy, S. D., Barbier, L. M., Cummings, J. R., et al. 2005, SSRv, 120, 143 [NASA ADS] [Google Scholar]
- Bassani, L., Malizia, A., Fiocchi, M., et al. 2015, Astron. Tel., 6781, 1 [NASA ADS] [Google Scholar]
- Benbow, W. 2015, Proc. ICRC, ArXiv e-prints [arXiv:1508.07251] [Google Scholar]
- Bird, A. J., Bazzano, A., Malizia, A., et al. 2016, ApJS, 223, 15 [Google Scholar]
- Breeveld, A. A., Landsman, W., Holland, S. T., et al. 2011, AIPC, 1358, 373 [Google Scholar]
- Burrows, D. N., Hill, J. E., Nousek, J. A., et al. 2005, SSRv, 120, 165 [Google Scholar]
- Costamante, L., Ghisellini, G., Giommi, P., et al. 2001, A&A, 371, 512 [NASA ADS] [CrossRef] [EDP Sciences] [Google Scholar]
- den Hartog, P. R., Hermsen, W., Kuiper, L., et al. 2006, A&A, 451, 587 [NASA ADS] [CrossRef] [EDP Sciences] [Google Scholar]
- Dermer, C. D., Schlickeiser, R., & Mastichiadis, A. 1992, A&A, 256, L27 [NASA ADS] [Google Scholar]
- Elvis, M., Plummer, D., Schachter, J., & Fabbiano, G. 1992, ApJ, 80, 257 [NASA ADS] [Google Scholar]
- Falomo, R., & Kotilainen, J. 1999, A&A, 352, 85 [NASA ADS] [Google Scholar]
- Falomo, R., Pian, E., & Treves, A. 2014, A&ARv, 22, 37 [CrossRef] [Google Scholar]
- Fitzpatrick, E. L., & Massa, D. 2007, ApJ, 663, 320 [Google Scholar]
- Foster, G. 1996, AJ, 112, 1709 [NASA ADS] [CrossRef] [Google Scholar]
- Gehrels, N., Chincarini, G., Giommi, P., et al. 2004, ApJ, 611, 1005 [Google Scholar]
- Giommi, P., Ghisellini, G., Padovani, P., & Tagliaferri, G. 2001, AIPC, 599, 441 [NASA ADS] [Google Scholar]
- Giommi, P., Capalbi, M., Fiocchi, M., et al. 2002, in Blazar Astrophysics with BeppoSAX and Other Observatories, 63 [Google Scholar]
- Güver, T., & Özel, F. MNRAS, 400, 2050 [Google Scholar]
- Horan, D., Badran, H. M., Bond, I. H., et al. 2004, ApJ, 603, 51 [NASA ADS] [CrossRef] [Google Scholar]
- Horan, D., Acciari, V. A., Bradbury, S. M., et al. 2009, ApJ, 695, 596 [NASA ADS] [CrossRef] [Google Scholar]
- Kapanadze, B. 2015, Astron. Tel., 8107, 1 [NASA ADS] [Google Scholar]
- Kapanadze, B. 2017, Astron. Tel., 10187, 1 [NASA ADS] [Google Scholar]
- Kapanadze, B. 2018, Astron. Tel., 11494, 1 [NASA ADS] [Google Scholar]
- Kapanadze, B., Romano, P., Vercellone, S., et al. 2015, Proc. MULTIF15, id. 56 [Google Scholar]
- Kapanadze, B., Romano, P., Vercellone, S., et al. 2016a, MNRAS, 457, 704 [NASA ADS] [CrossRef] [Google Scholar]
- Kapanadze, B., Dorner, D., Vercellone, S., et al. 2016b, MNRAS, 461, L26 [NASA ADS] [CrossRef] [Google Scholar]
- Kapanadze, B., Dorner, D., Vercellone, S., et al. 2016c, ApJ, 831, 102 [NASA ADS] [CrossRef] [Google Scholar]
- Kapanadze, B., Dorner, D., Romano, P., et al. 2017a, MNRAS, 469, 1655 [NASA ADS] [CrossRef] [Google Scholar]
- Kapanadze, S., Kapanadze, B., Vercellone, S., Romano, P., & Tabagari, L. 2017b, ApSS, 362, 196 [NASA ADS] [Google Scholar]
- Kapanadze, B., Vercellone, S., Romano, P., et al. 2018a, ApJ, 858, 68 [NASA ADS] [CrossRef] [Google Scholar]
- Kapanadze, B., Dorner, D., Vercellone, S., et al. 2018b, ApJS, 238, 13 [NASA ADS] [CrossRef] [Google Scholar]
- Kapanadze, S., Kapanadze, B., Vercellone, S., Romano, P., & Neparidze, L. 2020a, ApSS, 365, 66 [NASA ADS] [Google Scholar]
- Kapanadze, B., Gurchumelia, A., Dorner, D., et al. 2020b, ApJS, 247, 27 [NASA ADS] [CrossRef] [Google Scholar]
- Katarzynski, K., Ghisellii, G., Mastichiadis, A., Tavecchio, F., & Maraschi, L. 2006, A&A, 453, 47 [NASA ADS] [CrossRef] [EDP Sciences] [Google Scholar]
- Krimm, H. A., Holland, S. T., Corber, R. H. D., et al. 2013, ApJ, 209, 14 [NASA ADS] [Google Scholar]
- Kuiper, L., Hermsen, W., & in’t Zand, J. J. M., & den Hartog, P. R., 2005, Astron. Tel., 662, 1 [NASA ADS] [Google Scholar]
- Landau, R., Golisch, B., Jones, T. J., et al. 1986, ApJ, 308, 78 [NASA ADS] [CrossRef] [Google Scholar]
- Levine, A. M., Bradt, H., Cui, W., et al. 1996, ApJ, 469, L33 [NASA ADS] [CrossRef] [Google Scholar]
- Li, W., Filippenko, A. V., Chornock, R., & Jha, S. 2003, PASP, 115, 844 [CrossRef] [Google Scholar]
- Lomb, N. R. 1976, Ap&SS, 39, 447 [Google Scholar]
- Mannheim, K. 1992, A&A, 269, 67 [NASA ADS] [Google Scholar]
- Marscher, A. P. 2014, ApJ, 780, 87 [Google Scholar]
- Marscher, A. P., & Gear, W. K. 1985, ApJ, 298, 114 [Google Scholar]
- Massaro, E., Perri, M., Giommi, P., & Nesci, R. 2004, A&A, 413, 489 [NASA ADS] [CrossRef] [EDP Sciences] [Google Scholar]
- Massaro, F., Tramacere, A., Cavaliere, A., Perri, M., & Giommi, P. 2008, A&A, 478, 395 [NASA ADS] [CrossRef] [EDP Sciences] [Google Scholar]
- Massaro, F., Paggi, A., Elvis, M., & Cavaliere, A. 2011a, ApJ, 739, 73 [NASA ADS] [CrossRef] [Google Scholar]
- Massaro, F., Paggi, A., & Cavaliere, A. 2011b, ApJ, 742, L32 [NASA ADS] [CrossRef] [Google Scholar]
- Matsuoka, M., Kawasaki, K., Ueno, S., et al. 2009, PASJ, 61, 999 [Google Scholar]
- McHardy, I. 2008, in Blazar Variability across the Electromagnetic Spectrum, Workshop Proc (Trieste: PoS), 14 [Google Scholar]
- Mizuno, Y., Pohl, M., Niemiec, J., et al. 2014, MNRAS, 439, 3490 [NASA ADS] [CrossRef] [Google Scholar]
- Moretti, A., Campana, S., Mineo, T., et al. 2005, in In-flight Calibration of the Swift XRT Point Spread Function. SPIE, Bellingham, ed. O. Siegmund, Proc. SPIE, 5898, 360 [NASA ADS] [Google Scholar]
- Mücke, A., Protheroe, R. J., Engel, R., Rachen, J. P., & Stanev, T. 2003, Astropart. Phys., 18, 593 [Google Scholar]
- Nilsson, K., Pasanen, M., Takalo, L. O., et al. 2007, A&A, 475, 199 [NASA ADS] [CrossRef] [EDP Sciences] [Google Scholar]
- Nilsson, K., Lindfors, E., Takalo, L. O., et al. 2018, A&A, 620, A185 [NASA ADS] [CrossRef] [EDP Sciences] [Google Scholar]
- Nolan, P. L., Abdo, A. A., Ackermann, M., et al. 2012, ApJS, 199, 31 [Google Scholar]
- Padovani, P., & Giommi, P. 1995, ApJ, 444, 567 [NASA ADS] [CrossRef] [Google Scholar]
- Paino, A., Landoni, M., Falomo, R., et al. 2017, ApJ, 837, 144 [NASA ADS] [CrossRef] [Google Scholar]
- Perlman, E. S., Stocke, J. T., Schachter, J. F., et al. 1996, ApJS, 104, 251 [NASA ADS] [CrossRef] [Google Scholar]
- Perlman, E. S., Madejski, G., Georganopoulos, M., et al. 2005, ApJ, 625, 727 [NASA ADS] [CrossRef] [Google Scholar]
- Poole, T. S., Breeveld, A. A., Page, M. J., et al. 2008, MNRAS, 383, 627 [Google Scholar]
- Prandini, E., Bonnoli, G., Maraschi, L., Mariotti, M., & Tavecchio, F. 2010, MNRAS, 405, L76 [NASA ADS] [CrossRef] [Google Scholar]
- Ravasio, M., Tagliaferri, G., Ghisellini, G., & Tavecchio, F. 2004, A&A, 424, 841 [NASA ADS] [CrossRef] [EDP Sciences] [Google Scholar]
- Rector, T., Gabuzda, D. C., & Stocke, J. T. 2003, AJ, 125, 1060 [NASA ADS] [CrossRef] [Google Scholar]
- Romano, P., Campana, S., Chincarini, G., et al. 2006, A&A, 456, 917 [NASA ADS] [CrossRef] [EDP Sciences] [Google Scholar]
- Romero, G. E., Cellone, S. A., & Combi, J. A. 1999, A&AS, 135, 477 [NASA ADS] [CrossRef] [EDP Sciences] [Google Scholar]
- Roming, P. W. A., Kennedi, T. E., Mason, K. O., et al. 2005, SSRv, 120, 95 [NASA ADS] [Google Scholar]
- Saito, S., Stawarz, Ł., Tanaka, Y. T., et al. 2013, ApJ, 766, L11 [Google Scholar]
- Sbarufatti, B., Treves, A., & Falomo, R. 2005, ApJ, 635, 173 [NASA ADS] [CrossRef] [Google Scholar]
- Scargle, J. D. 1982, ApJ, 263, 835 [Google Scholar]
- Scarpa, R., Urry, C. M., Falomo, R., et al. 1999, ApJ, 521, 134 [NASA ADS] [CrossRef] [Google Scholar]
- Shukla, A., Chitnis, V. A., Singh, B. B., et al. 2015, ApJ, 798, 2 [Google Scholar]
- Sokolov, A., Marscher, A. P., & McHardy, I. M. 2004, ApJ, 613, 725 [NASA ADS] [CrossRef] [Google Scholar]
- Takalo, L. O., Nilsson, K., Lindfors, E., et al. 2008, in AIP Conf. Ser., 1085, 705 [NASA ADS] [CrossRef] [Google Scholar]
- Tammy, J., & Duffy, P. 2009, MNRAS, 393, 1063 [NASA ADS] [CrossRef] [Google Scholar]
- Tramacere, A., Giommi, P., Perri, M., Varrecchia, F., & Tosti, G. 2009, A&A, 501, 879 [NASA ADS] [CrossRef] [EDP Sciences] [Google Scholar]
- Tramacere, A., Massaro, E., & Taylor, A. M. 2011, ApJ, 739, 66 [Google Scholar]
- Tueller, J., Baumgartner, W. H., Markwardt, C. B., et al. 2010, ApJS, 186, 378 [Google Scholar]
- VanderPlas, J. T. 2018, ApJS, 236, 16 [Google Scholar]
- Vaughan, S., Edelson, R., Warwick, R. S., & Uttley, P. 2003, MNRAS, 345, 1271 [Google Scholar]
- Virtanen, J. J. P., & Vainio, R. 2005, ApJ, 621, 313 [Google Scholar]
- Willingale, R., Starling, R. L. C., Beardmore, A. P., et al. 2013, MNRAS, 431, 394 [NASA ADS] [CrossRef] [Google Scholar]
- Zahoor, M., Sahayanathan, S., Iqbal, N., Manzoor, A., & Bhatt, N. 2022, MNRAS, 511, 994 [NASA ADS] [CrossRef] [Google Scholar]
- Zhang, Y. H. 2010, ApJ, 713, 180 [NASA ADS] [CrossRef] [Google Scholar]
- Zhang, Y. H., Treves, A., Maraschi, L., Bai, J. M., & Liu, F. K. 2006, ApJ, 637, 699 [NASA ADS] [CrossRef] [Google Scholar]
Appendix A: Results from the Swift observations of 1ES 0033+595.
The XRT observations of 1ES 0033+595.
The results of the UVOT observations.
Results of the Swift-XRT spectral analysis with the log-parabolic model.
Results of the XRT spectral analysis with a simple power-law model.
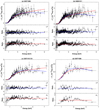 |
Fig. A.1. Examples of the XRT-band spectra with a∼1. The solid blue and red curves represent the logparabolic and simple powerlaw models, respectively. |
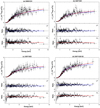 |
Fig. A.2. Examples of the XRT-band spectra with Ep> 10 keV. The solid blue and red curves represent the logparabolic and simple powerlaw models, respectively. |
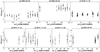 |
Fig. A.3. Extended XRT observations of 1ES 0033+595 without 0.3–10 keV IDVs. |
Appendix B: Results from the LAT observations.
Shortest time intervals with the significant Fermi-LAT detections of 1ES 0033+595.
All Tables
Summary of the 0.3–10 keV IDVs detected at the 99.997% and 99.5% confidence levels.
Shortest time intervals with the significant Fermi-LAT detections of 1ES 0033+595.
All Figures
|
Fig. 1. Historical MWL light curves from the observations with different instruments: Panels: (a) XRT, 0.3–10 keV; (b) BAT, 15–150 keV; (c) ASM, 15–12 keV; (d) MAXI, 2–20 keV; (e) UVOT V-band; (f) R-band (KAIT and Tuorla telescopes); and (g) LAT, 0.3–300 GeV. While the XRT, ASM, MAXI, UVOT, and R-band data are plotted using the 1 d bins, the BAT and LAT light curves are based on data binned every two and four weeks, respectively. In panelsb and d, the black and grey data points correspond to the detections of the source with 5σ and (3–4)σ significance, respectively. In panelf, the downward grey triangles show the upper limits to the V-band flux when the detection significance was lower than 3σ. The same symbol presents the 2σ upper limit to the 0.3–300 GeV flux in the bottom panel when TS < 9 and/or Npred < 8. |
| In the text | |
|
Fig. 2. Multi-wavelength variability of 1ES 0033+595 in different periods. The daily bins are used for the XRT, MAXI, UVOT, and R-band data, while a two-weekly integration is used for constructing light curves from the BAT and LAT observations. In the BAT and MAXI-band plots, the black and grey points correspond to the detections with the 5σ and (3–4)σ significances, respectively. The grey triangles in the LAT-related plots show the 2σ upper limits to the 0.3–300 GeV flux when the source was detected below the 3σ significance and/or showed Npred < 8. |
| In the text | |
|
Fig. 2. continued. |
| In the text | |
|
Fig. 3. Fastest 0.3–10 keV IDVs detected at the 99.99% (panels a–j) and 99.5% (panels k–n) confidence levels. The instances are arranged in order of increasing observation duration. |
| In the text | |
|
Fig. 4. 0.3–10 ke IDVs from the densely sampled XRT observations of 1ES 0033+595. |
| In the text | |
|
Fig. 5. Distribution of different spectral parameters (panels a–d) and MWL fluxes (panels f–o; the red and green curves show the lognormal and Gaussian fits to the histograms, respectively). |
| In the text | |
|
Fig. 6. De-absorbed fluxes and spectral parameters plotted versus time. Panels: (a) 0.3–2 keV and 2–10 keV fluxes (black and grey points, respectively); (b) photon index at 1 keV (black points) and the 0.3–10 keV photon index (grey points); (c) curvature parameter; (d) position of the synchrotron SED peak. The periods presented in Sect. 4.1.2 are located between the vertical dashed lines (with the acronym ‘P’ denoting ‘Period’). |
| In the text | |
|
Fig. 7. Correlation between the spectral parameters and MWL fluxes. Panels a–c: curvature parameter b plotted versus the unabsorbed 2–10 keV flux, the position of the synchrotron SED peak Ep, and the photon index a, respectively. The parameters a and Ep are plotted versus the 2–10 keV flux in panels d–e. The scatter plot Ep–log Sp is provided in panel f. The 0.3–10 keV photon index, unabsorbed 0.3–2 keV flux, and V-band and LAT-band fluxes are plotted versus the 2–10 keV flux in panels g–j, respectively. The one-day binned V- and B-band fluxes are plotted against each other in panel k. Finally, a fvar – F2 − 10 keV plot is provided in panell where the vertical dashed red line represents the weighted mean 2–10 keV flux from all XRT observations of 1ES 0033+595. The one-day binned MWL fluxes are used in the corresponding plots, except for panelj where the four-weekly bins are adopted. |
| In the text | |
|
Fig. 8. Examples of different types of spectral hysteresis. Panels: (a) CW loop; (b) CCW loop; (c) and (d) two subsequent CW and CCW loops; (e) transition from a CW loop into a CCW loop. |
| In the text | |
|
Fig. 9. Lomb-Scargle periodogram from the MWL observations of 1ES 0033+595. |
| In the text | |
|
Fig. A.1. Examples of the XRT-band spectra with a∼1. The solid blue and red curves represent the logparabolic and simple powerlaw models, respectively. |
| In the text | |
|
Fig. A.2. Examples of the XRT-band spectra with Ep> 10 keV. The solid blue and red curves represent the logparabolic and simple powerlaw models, respectively. |
| In the text | |
|
Fig. A.3. Extended XRT observations of 1ES 0033+595 without 0.3–10 keV IDVs. |
| In the text | |
Current usage metrics show cumulative count of Article Views (full-text article views including HTML views, PDF and ePub downloads, according to the available data) and Abstracts Views on Vision4Press platform.
Data correspond to usage on the plateform after 2015. The current usage metrics is available 48-96 hours after online publication and is updated daily on week days.
Initial download of the metrics may take a while.