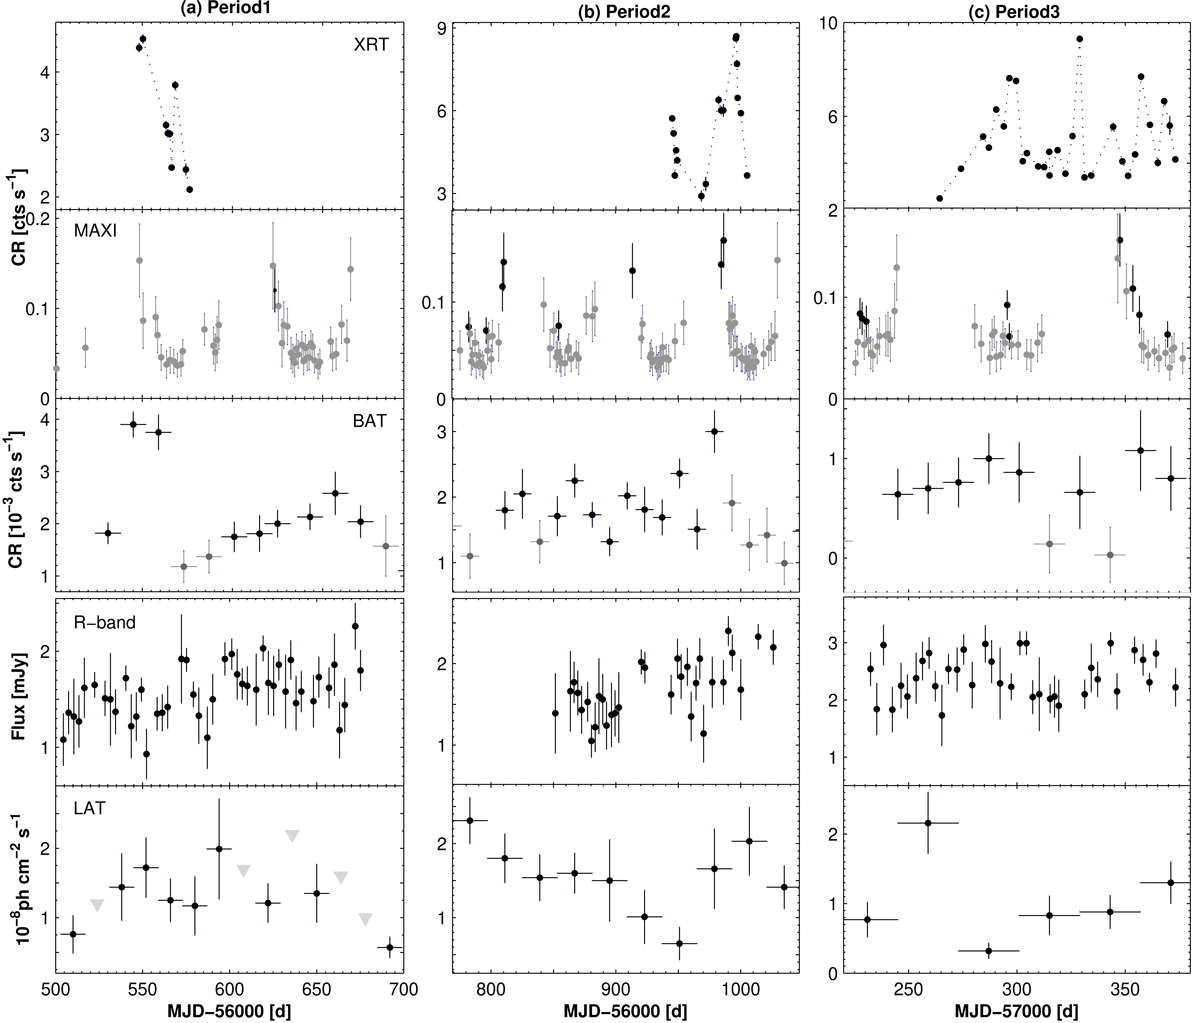
Fig. 2.
Download original image
Multi-wavelength variability of 1ES 0033+595 in different periods. The daily bins are used for the XRT, MAXI, UVOT, and R-band data, while a two-weekly integration is used for constructing light curves from the BAT and LAT observations. In the BAT and MAXI-band plots, the black and grey points correspond to the detections with the 5σ and (3–4)σ significances, respectively. The grey triangles in the LAT-related plots show the 2σ upper limits to the 0.3–300 GeV flux when the source was detected below the 3σ significance and/or showed Npred < 8.
Current usage metrics show cumulative count of Article Views (full-text article views including HTML views, PDF and ePub downloads, according to the available data) and Abstracts Views on Vision4Press platform.
Data correspond to usage on the plateform after 2015. The current usage metrics is available 48-96 hours after online publication and is updated daily on week days.
Initial download of the metrics may take a while.