Fig. 1.
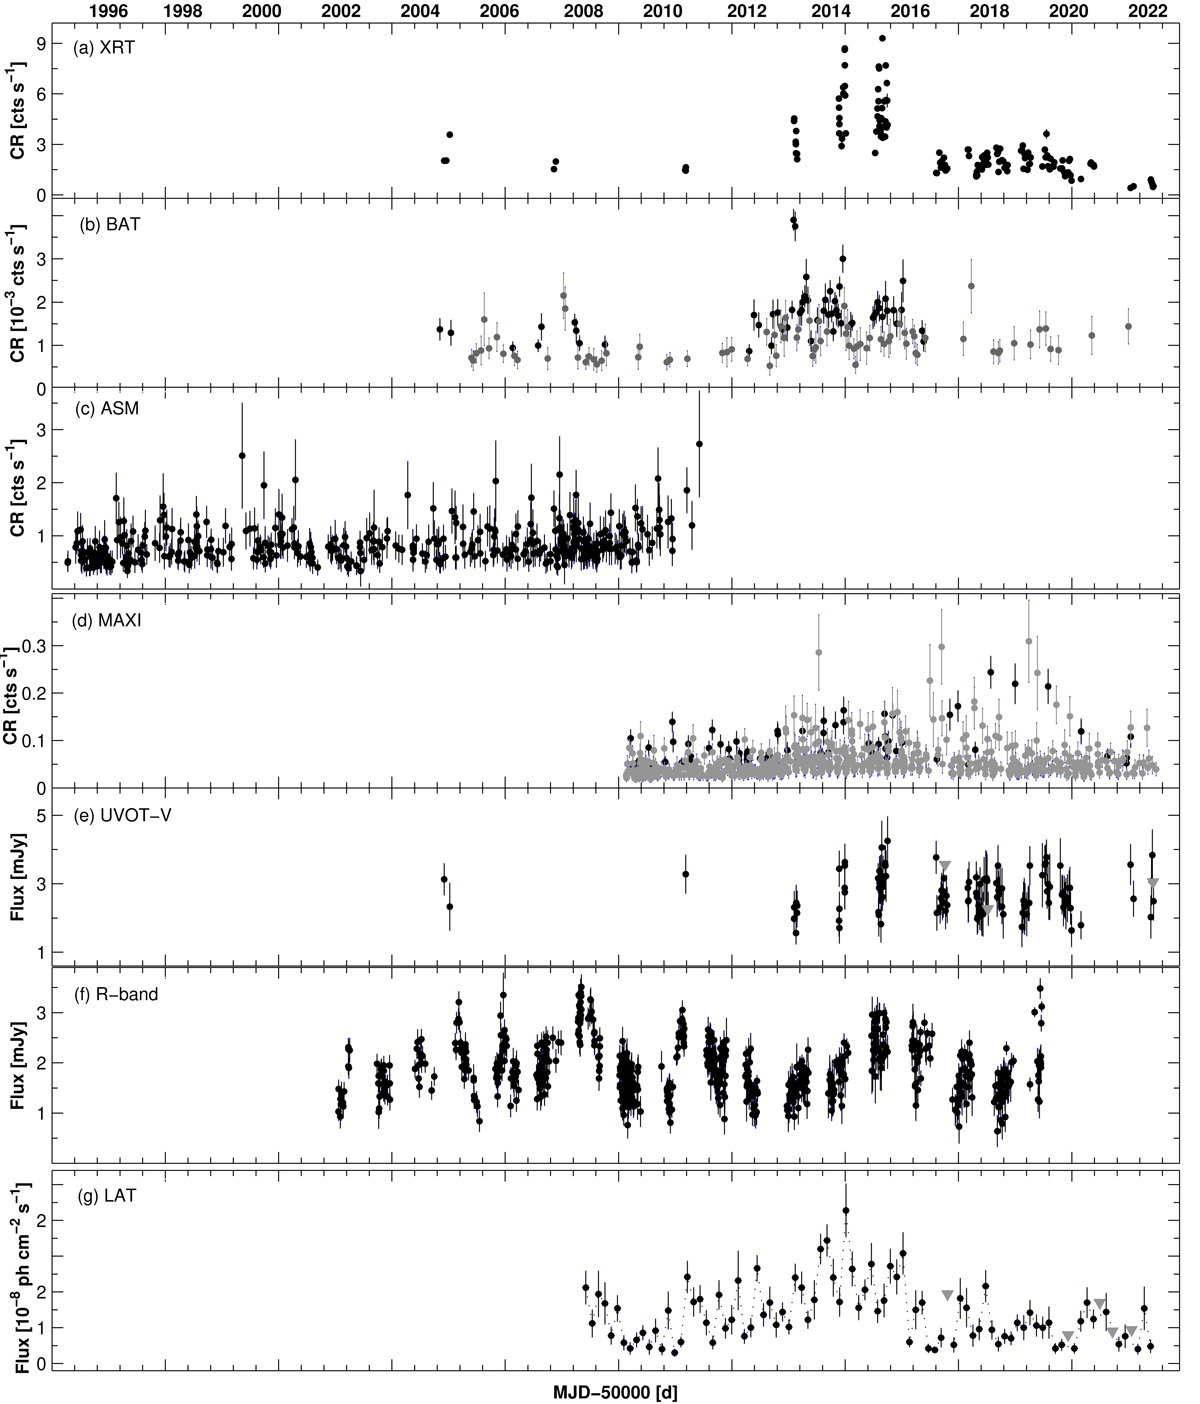
Download original image
Historical MWL light curves from the observations with different instruments: Panels: (a) XRT, 0.3–10 keV; (b) BAT, 15–150 keV; (c) ASM, 15–12 keV; (d) MAXI, 2–20 keV; (e) UVOT V-band; (f) R-band (KAIT and Tuorla telescopes); and (g) LAT, 0.3–300 GeV. While the XRT, ASM, MAXI, UVOT, and R-band data are plotted using the 1 d bins, the BAT and LAT light curves are based on data binned every two and four weeks, respectively. In panelsb and d, the black and grey data points correspond to the detections of the source with 5σ and (3–4)σ significance, respectively. In panelf, the downward grey triangles show the upper limits to the V-band flux when the detection significance was lower than 3σ. The same symbol presents the 2σ upper limit to the 0.3–300 GeV flux in the bottom panel when TS < 9 and/or Npred < 8.
Current usage metrics show cumulative count of Article Views (full-text article views including HTML views, PDF and ePub downloads, according to the available data) and Abstracts Views on Vision4Press platform.
Data correspond to usage on the plateform after 2015. The current usage metrics is available 48-96 hours after online publication and is updated daily on week days.
Initial download of the metrics may take a while.