Fig. 7.
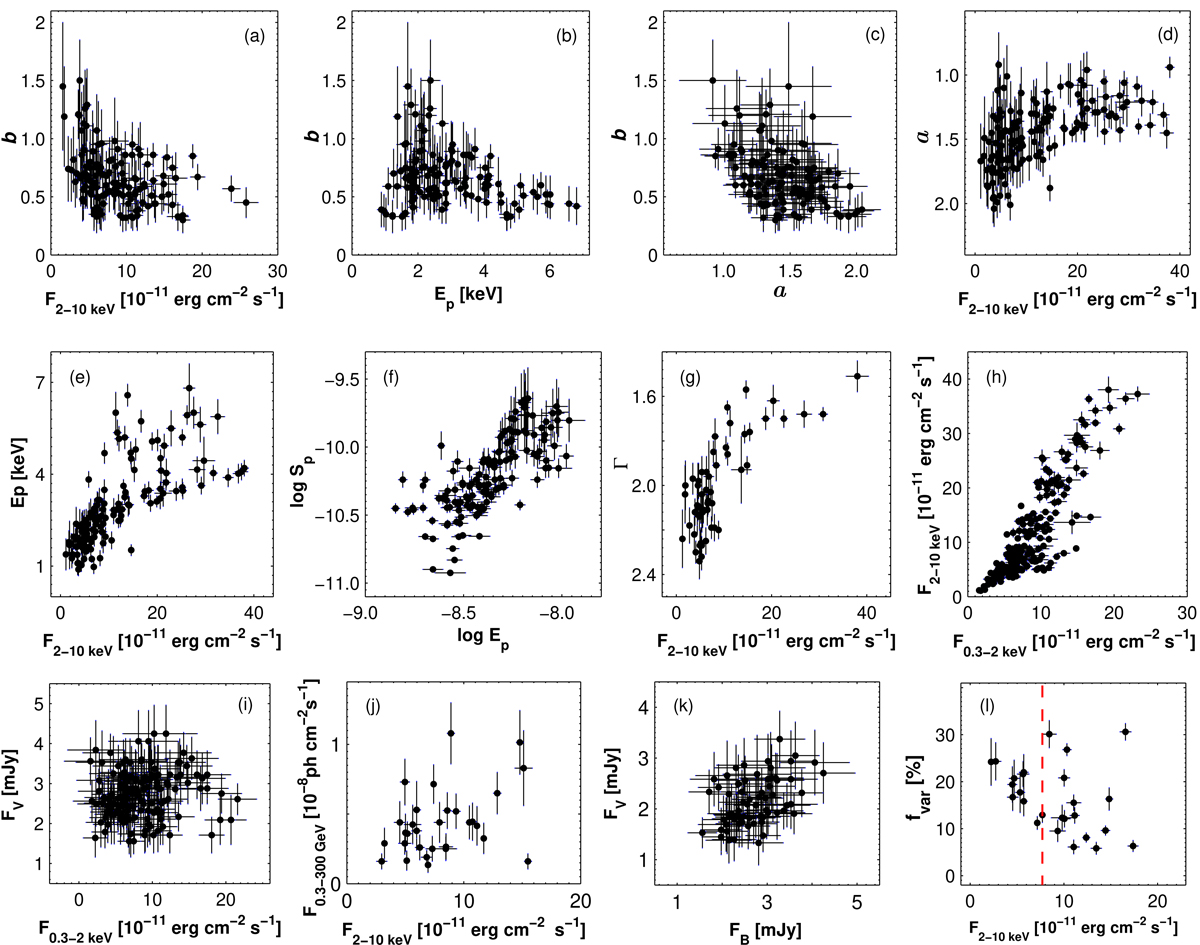
Download original image
Correlation between the spectral parameters and MWL fluxes. Panels a–c: curvature parameter b plotted versus the unabsorbed 2–10 keV flux, the position of the synchrotron SED peak Ep, and the photon index a, respectively. The parameters a and Ep are plotted versus the 2–10 keV flux in panels d–e. The scatter plot Ep–log Sp is provided in panel f. The 0.3–10 keV photon index, unabsorbed 0.3–2 keV flux, and V-band and LAT-band fluxes are plotted versus the 2–10 keV flux in panels g–j, respectively. The one-day binned V- and B-band fluxes are plotted against each other in panel k. Finally, a fvar – F2 − 10 keV plot is provided in panell where the vertical dashed red line represents the weighted mean 2–10 keV flux from all XRT observations of 1ES 0033+595. The one-day binned MWL fluxes are used in the corresponding plots, except for panelj where the four-weekly bins are adopted.
Current usage metrics show cumulative count of Article Views (full-text article views including HTML views, PDF and ePub downloads, according to the available data) and Abstracts Views on Vision4Press platform.
Data correspond to usage on the plateform after 2015. The current usage metrics is available 48-96 hours after online publication and is updated daily on week days.
Initial download of the metrics may take a while.