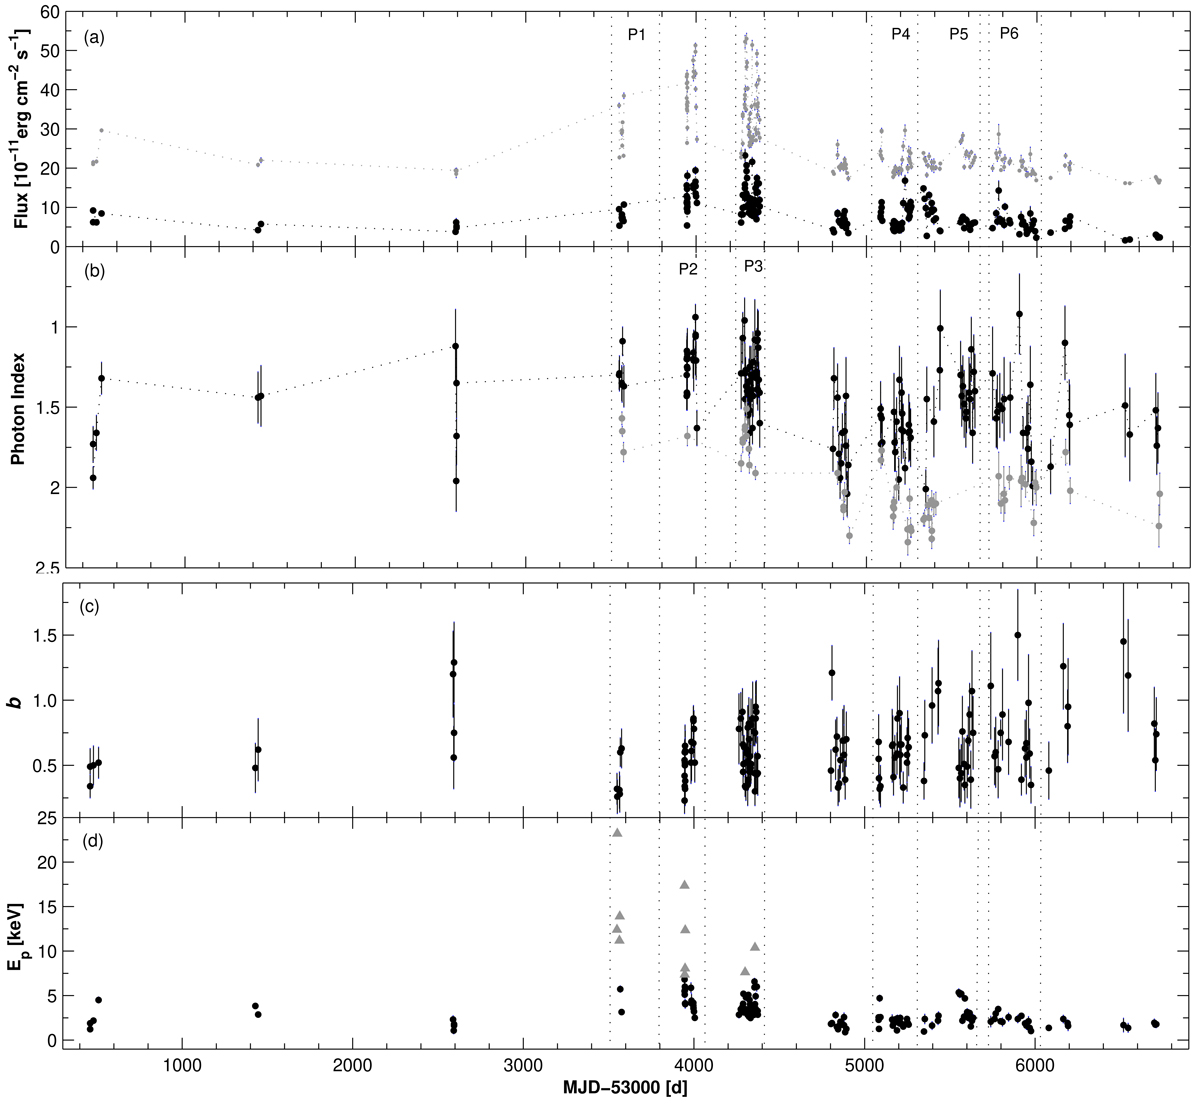
Fig. 6.
Download original image
De-absorbed fluxes and spectral parameters plotted versus time. Panels: (a) 0.3–2 keV and 2–10 keV fluxes (black and grey points, respectively); (b) photon index at 1 keV (black points) and the 0.3–10 keV photon index (grey points); (c) curvature parameter; (d) position of the synchrotron SED peak. The periods presented in Sect. 4.1.2 are located between the vertical dashed lines (with the acronym ‘P’ denoting ‘Period’).
Current usage metrics show cumulative count of Article Views (full-text article views including HTML views, PDF and ePub downloads, according to the available data) and Abstracts Views on Vision4Press platform.
Data correspond to usage on the plateform after 2015. The current usage metrics is available 48-96 hours after online publication and is updated daily on week days.
Initial download of the metrics may take a while.