| Issue |
A&A
Volume 663, July 2022
|
|
|---|---|---|
| Article Number | A99 | |
| Number of page(s) | 23 | |
| Section | Numerical methods and codes | |
| DOI | https://doi.org/10.1051/0004-6361/202243419 | |
| Published online | 19 July 2022 | |
Detection of eccentric close-binary supermassive black holes with incomplete interferometric data
1
Department of astronomy, Faculty of mathematics, University of Belgrade Studentski trg 16,
Belgrade
11000
Serbia
e-mail: andjelka@matf.bg.ac.rs
2
PIFI Research Fellow, Key Laboratory for Particle Astrophysics, Institute of High Energy Physics, Chinese Academy of Sciences,
19B Yuquan Road,
Beijing
100049
PR China
3
Key Laboratory for Particle Astrophysics, Institute of High Energy Physics,
CAS 19B Yuquan Road,
Beijing
100049, PR China
e-mail: wangjm@ihep.ac.cn
4
School of Astronomy and Space Sciences, University of Chinese Academy of Sciences,
Beijing
100049, PR China
5
Astronomical observatory Belgrade Volgina 7,
PO Box 74
Belgrade
11060, Serbia
Received:
25
February
2022
Accepted:
16
May
2022
Context. Recent studies have proposed that General Relativity Analysis via VLT InTerferometrY upgrade (GRAVITY+) on board the Very Large Telescope Interferometer (VLTI) is able to trace the circular orbit of the subparsec (≲0.1 pc) close-binary supermassive black holes (CB-SMBHs) by measuring the photo-centre variation of the hot dust emission. However, the CB-SMBHs orbit may become highly eccentric throughout the evolution of these objects, and the orbital period may be far longer than the observational time baseline.
Aims. We investigate the problem of detecting the CB-SMBH with hot dust emission and high eccentricity (eCB-SMBH, e = 0.5) when the observed time baselines of their astrometric data and radial velocities are considerably shorter than the orbital period.
Methods. The parameter space of the Keplerian model of the eCB-SMBH is large for exploratory purposes. We therefore applied the Bayesian method to fit orbital elements of the eCB-SMBH to combine radial velocity and astrometric data covering a small fraction of the orbital period.
Results. We estimate that a number of potential eCB-SMBH systems within reach of GRAVITY+ will be similar to the number of planned circular targets. We show that using observational time baselines that cover ≳10% of the orbit increases the possibility of determining the period, eccentricity, and total mass of an eCB-SMBH. When the observational time baseline becomes too short (~5%), the quality of the retrieved eCB-SMBH parameters degrades. We also illustrate how interferometry may be used to estimate the photo-centre at the eCB-SMBH emission line, which could be relevant for GRAVITY+ successors. Even if the astrometric signal for eCB-SMBH systems is reduced by a factor of √(1 - e2) compared to circular ones, we find that the hot dust emission of eCB-SMBHs can be traced by GRAVITY+ at the elementary level.
Key words: galaxies: active / quasars: supermassive black holes / techniques: interferometric
© A. B. Kovačević et al. 2022
 Open Access article, published by EDP Sciences, under the terms of the Creative Commons Attribution License (https://creativecommons.org/licenses/by/4.0), which permits unrestricted use, distribution, and reproduction in any medium, provided the original work is properly cited.
This article is published in open access under the Subscribe-to-Open model. Subscribe to A&A to support open access publication.
1 Introduction
It is now well known that almost all galaxies contain supermassive black holes (SMBHs) at their cores (Gültekin et al. 2009; Kormendy & Ho 2013), with SMBH masses in the range 105−109.5 M⊙ (Agarwal et al. 2012). Mergers of galaxies unavoidably lead to the formation of SMBH binaries (SMB-HBs; Begelman et al. 1980; Milosavljevic & Merritt 2001). As galaxy mergers have been shown to funnel considerable amounts of gas to the nuclear area (Robertson et al. 2006), binaries are expected to be surrounded by gas. This phenomena spurred a quest for detecting SMBHBs that may accrete gas and release variable bright electromagnetic emission due to their dynamic interplay with the surrounding gas (see review by Bogdanovic et al. 2022); and various imprints of electromagnetic signatures of dual and binary SMBH candidates were found, with separations from ~1kpc to subparsec values (see exhaustive reviews of Popović 2012; Roedig et al. 2014; De Rosa et al. 2019; Bogdanovic et al. 2022). Although dozens of dual active galactic nuclei (AGNs) have been spatially resolved, subparsec SMBHBs have remained elusive due to controversial electromagnetic characteristics (Charisi et al. 2022). In addition, particular effort has been made to obtain observational evidence for SMBHBs with subparsec separations of 0.1 pc, known as close-binary SMBHs (CB-SMBHs, Wang & Li 2020), built on the notion that they are viable nanohertz (nano-Hz) gravitational wave (GW) sources. Once the binary has reached subparsec scales, the SMBHs can spiral together and combine over timescales of less than the age of the Universe (Begelman et al. 1980). SMBHBs become significant gravitational wave generators in the final months or years before merger, and could be detected by pulsar timing arrays (Hobbs et al. 2010; Perera et al. 2019). The discovery of these binaries and the measurement of their orbital parameters would, without a doubt, be extremely beneficial in our efforts to detect nano-Hz gravitational waves in the nearby future (Sesana et al. 2009). To understand the ultimate destiny of an SMBH binary, not only the orbital decay but also the eccentricity evolution of the pair must be investigated (Dotti et al. 2012). For a CB-SMBH with eccentricity (e: hereafter eCB-SMBH), the decay (or inspiral) timescale driven by only GW emission is given by
 (1)
(1)
(Peters 1964), where G is the gravitational constant, c is the speed of light, M = M1 + M2 where M1 and M2 are the masses of the primary and secondary SMBHs, μ = M1M2/M2, M8 = M/108M⊙, a0.1 = a/0.lpc is the semi-major axis in units of 0.1 pc, e is the orbital eccentricity, and
 (2)
(2)
is enhancement factor which increases with eccentricity. Because F(e) increases monotonically as eccentricity increases, we find from Eqs. (1) and (2) that the inspiral timescale of a binary can be shorter than that of the circular case (i.e. F(0)−1 = 1). Also, the inspiral time1 is proportional to  . Because the mutual separations and eccentricities of eCB-SMBHs affect the inspiral time, eCB-SMBHs have recently become crucial for a wide range of studies, from black hole formation to gravitational wave physics (Saade et al. 2020).
Subparsec binary separations are typical in late-stage galactic mergers where two SMBHs are close enough to form a gravitationally bound system. The key theoretical feature of CB-SMBHs is that their electromagnetic signatures could be related to the orbital elements of their motion (De Paolis et al. 2004), but they are observationally elusive due to their small separation on the sky, as well as the uncertainties related to the uniqueness of their observational signatures. In addition, they are expected to be inherently scarce, as their occurrence relies on their unknown evolutionary rate on small scales; it is possible that a fraction (<0.001) of AGNs at redshift z < 0.7 may harbour CB-SMBH (Volonteri et al. 2009; De Rosa et al. 2019). Consequently, any observational search for CB-SMBHs must include a large sample of their host active galaxies and must discriminate signatures of binaries from those AGNs powered by a single SMBH.
So far, observational searches for such systems have primarily focused on photometry and spectroscopic data, and rarely on direct imaging (see e.g. De Rosa et al. 2019). For example, if CB-SMBHs hosted by active galaxies are made up of two distinct broad-line regions (BLRs; see e.g. Popović et al. 2000, 2021; Shen & Loeb 2010), they might be studied using either reverberation mapping (RM) of their nuclear region (Wang et al. 2018; Kovačević et al. 2020b; Songsheng et al. 2020), or a long-term monitoring campaign of profile variations (e.g. Eracleous et al. 2012; Ju et al. 2013; Li et al. 2016; Liu et al. 2014, 2016; Nguyen et al. 2019, 2020a,b; Runnoe et al. 2015; Shen et al. 2013). A specifically dedicated RM campaign focused on active galactic nuclei with Hβ asymmetry (Monitoring AGNs with Hβ Asymmetry, MAHA) has been running since 2017, which uses the Wyoming Infrared Observatory (WIRO) 2.3m telescope (Du et al. 2018; Brotherton et al. 2020; Bao et al. 2022). However, the observational data are inconclusive, and further monitoring is needed.
Thanks are given to GRAVITY (General Relativity Analysis via VLT InTerferometrY) on board the Very Large Telescope Interferometer (VLTI; Haguenauer et al. 2012; GRAVITY Collaboration 2017) for bringing in a new era of interferometry for high-spatial-resolution astronomy. GRAVITY operates in the K band, between 2.0 and 2.4 μm, interfero-metrically combining near-infrared (NIR) light collected by four telescopes at the VLTI (GRAVITY Collaboration 2017). It successfully observed 3C 273 and the data obtained allowed the inference of the radius of its broad line region (BLRs; GRAVITY Collaboration 2018; Wang et al. 2020b), a ~20% error in its SMBH mass estimate, and cosmic distances (Wang et al. 2020b). The second source is IRAS 09149-6206, for which GRAVITY Collaboration (2017) measured the size of the BLR (~0.075 pc) and the mass of the central black hole (~108 M⊙), while NGC 3783 is the third (GRAVITY Collaboration 2021b). The GRAVITY instrument partially resolved the continuum hot dust emission of eight AGNs, with hot dust continuum sizes ranging from 0.3 to 0.8 mas (GRAVITY Collaboration 2020a). The hot dust continuum of NGC 1068 was spatially resolved (GRAVITY Collaboration 2020b), revealing a thin, ring-like structure with a radius of ~0.24 pc.
The proposed GRAVITY/VLTI upgrade, known as GRAVITY+, is intended to broaden interferometric frontiers toward K > 22 mag (Gravity+ Collaboration 2022), where detection of CB-SMBHs is best accomplished in collaboration with current, high-precision radial velocity (RV; Dexter et al. 2020) and quantitative spectroscopy programs (Songsheng et al. 2019b,a, 2020; Wang et al. 2020b). GRAVITY+, by providing spatial information, will be the ultimate tool for securely establishing the binarity of candidates, which are predicted to be observed in the thousands in upcoming surveys.
Because of the uncertainty surrounding the photometrically and spectroscopically selected candidates, various searches for more signatures have been conducted and new detection methods are being developed. For example, the binary signature may also be imprinted on the IR emission from the dust in the AGN (D’Orazio & Haiman 2017). Recently, (Dexter et al. 2020) developed a new technique to identify CB-SMBHs with circular orbits (e = 0) based on astrometric signatures observed by GRAVITY+ that are a consequence of the morphology and evolution of hot dust emission in the system.
With the aid of GRAVITY+, high-precision astrometry it will be possible to further probe eCB-SMBH candidates selected from Doppler-shifted emission-line surveys. This spectroscopic method detects binaries with longer periods of at least a few decades (Charisi et al. 2022). It is commonly assumed that these two indirect detection methods require observational time baselines exceeding the orbital period to produce positive results.
In this work, we simulate synthetic and incomplete astromet-ric and radial velocity observations of eCB-SMBHs to investigate the effect of eccentricity on their astrometric and radial velocity signatures, the possibility of their detection, and recovery of basic orbital elements. Our technique differs from that of (Dexter et al. 2020) in that we used a greater parameter range (including eCB-SMBH eccentricity) and we considered a realistic and unfavourable percentage of the eCB-SMBH orbit covered by observations (5–10%). In a set of simulated astrometric and radial velocity (RV) observations covering only 5–10% of a whole orbital period of the source (which we refer to as the ‘interferometric gap’), we illustrate the Bayesian method as the plausible solution to this issue. Bayesian inference is used to combine the two sets of data, and Markov chain Monte Carlo (MCMC) is applied to produce random samples from a distribution of the orbital parameters based on the simulated observations (Metropolis et al. 1953; Hastings 1970; Salvatier et al. 2016).
The structure of the article is as follows. Section 2 presents our eCB-SMBH model, which includes astrometric and radial velocity data. In Sect. 3, we first discuss the detectability of eCB-SMBH s in general, as assessed by robust astrometric signature amplitudes. Section 3.1 outlines detectability based on the photo-centre offset generated by the intersection of the secondary SMBH dust ring and circumbinary disc (CBD). Section 3.2 highlights detectability in the limit of binary eccentricity, which influences orbital shape. Section 4 displays the results of the Bayesian procedure for orbital parameter recovery from synthetic multi-data sets (joint astrometric and radial velocity). Section 5 discusses eCB-SMBH detectability refinements based on the variation of q, forb parameters, the possibility of obtaining orbital eccentricity from radial velocity and acceleration data, and refinement of eCB-SMBH detectability in contrast to CBD emission phenomena. We finish this section by introducing the Joint Spectroastrometry and Reverberation Mapping (SARM) approach, which can be used for binary detection refinement via follow-up or as an independent binary-detection tool. In Sect. 6, we describe the limitations of model assumptions and the challenges in radial velocity and centroid measurements. Section 7 shows a possible approach for determining the angular position of the photo-centre at the emission line for future successors of the GRAVITY+ instrument. In addition, the overall expectation of eCB-SMBH gravitational wave(GW) measurements is outlined. In Sect. 8, we present our conclusions with some closing remarks.
2 eCB-SMBH model settings
2.1 Overview of accretion on to CB-SMBHs
Here, we briefly explain the technique we use for multi-data survey modelling of the eCB-SMBH, which includes astrometric measurements and RV observations, as well as the anticipated CBD and hot-dust ring characteristics of eCB-SMBH. The framework of our model is based on general CB-SMBH features deduced from theoretical studies. According to hydrodynamic simulations, an SMBHB opens a cavity in the surrounding gas, forming a circumbinary accretion disc (Artymowicz & Lubow 1994; MacFadyen & Milosavljević 2008; Farris et al. 2014). As gaseous streams enter the cavity, some of the matter becomes attached to the SMBHs, and at least one and possibly both of the SMBHs will acquire its own accretion disc and appear as an AGN (e.g. Farris et al. 2014). Furthermore, the accretion rate is higher on the component with the lowest mass in unequal-mass CB-SMBHs (Artymowicz & Lubow 1994; Hayasaki et al. 2007; Roedig et al. 2011; Farris et al. 2014), potentially making it more luminous than the primary (Bogdanović et al. 2022; Ji et al. 2021). Additionally, mass accretion is higher onto the secondary SMBH because it moves closer to the edge of the CBD. While the inner minidiscs are assumed to be responsible for the majority of the UV and X-ray emission (d’Ascoli et al. 2018; Sesana et al. 2012), the circumbinary disc is expected to be responsible for the optical and IR emission (D’Orazio et al. 2015). Simulations demonstrate that a dense and relatively cold circumbinary disc can transfer angular momentum whilst also being radiatively efficient and similar to discs that power AGNs, generating a luminous electromagnetic (EM) signal independently of GW emission during inspiraling (see Liu 2021, and references therein). Many simulation results (see e.g. Tang et al. 2018; Muñoz et al. 2019) show that after gap formation during the binary–disc interaction, unique observable signatures of the continuum emission could be observed (Gültekin & Miller 2012; Liu 2021).
The current premise for tracking binary SMBHs using GRAVITY is based on the relative astrometry between the BLR of an accreting black hole and hot dust in the surrounding circumbinary disc (Dexter et al. 2020). We assume that the secondary SMBH has a higher accretion rate and is more luminous than the primary (see e.g. Dexter et al. 2020; Ji et al. 2021), which is broadly referred to hereafter as the ‘active SMBH’. As the main unknown in this setup is where the NIR continuous emission comes from and how it evolves over the binary motion, we look at two scenarios as prescribed by (Dexter et al. 2020). First, hot dust emission is stationary (e.g. uniform or asymmetric around the circumbinary disc), allowing the relative astrome-try of the BLR to be exploited in order to compute the orbit of the secondary. Second, hot dust is assumed to originate outside the binary and at the sublimation radius of the secondary. The probable emission locations are then distributed along a circle of radius Rsub centred on the secondary position. When the sublimation radius intersects the circumbinary disc, it is anticipated that hot dust emission occurs with equal intensity all the way around the portion of the circle intersected by circumbinary disc. As assumed by (Dexter et al. 2020), when the sublimation radius is less than the distance from the secondary to the edge of the circumbinary disc, it is anticipated that a tiny region (e.g. in an accretion stream) at a distance of Rsub will develop and emit hot dust instead.
2.2 Number of possible eCB-SMBH systems within reach of GRAVITY+
To better gauge the frequency of eCB-SMBH s amongst the population of SMBHBs, we estimate their frequency distribution (feCB–SMBH) by integration of a differential fraction within an arbitrary range of eccentric binary masses M, eccentricities (e), and periods (P):
 (3)
(3)
where  is the normalisation constant dependent on the sample; p(M), p(P), and p(e) are the distributions of eCB-SMBH mass, eccentricity, and period; and pactive ~ 0.5 is an approximate probability that the secondary is active and more luminous. For probabilities, we use approximated functional power law forms p(M) = M−1.1, p(P) = P−1, and p(e) = e, which are simple because of the unknown sample of binaries in the range of parameters of interest. An estimate of the number of eCB-SMBH s at a given distance (z < 0.3) whose astrometric signal could be detected by GRAVITY with CI 95% is then given by Nd ~ 0.95feCB–SMBHNgravity, where Ngravity is the total number of AGNs detected by GRAVITY within a sphere of radius z < 0.3, while feCB–SMBH is calculated by integrating over a specific range of masses, periods, and eccentricities (M ∈ [107,1010] M⊙, P ∈ [5,100]yr, e ∈ [0.4,0.6]). If Ngravity is of the order of a few hundred (<500) within z < 0.3 (Gravity+ Collaboration 2022) then the number
  . We see that if
  , the number of eCB-SMBH s is 4–13, which is comparable to the established set of 10 circular GRAVITY+ targets. In addition to the above blind estimate, we can calculate the number of SMBHBs that can be detected by GRAVITY+ up to z ~ 3 using the estimated number of SMBHBs per log z (D’Orazio & Loeb 2019) and assuming the fraction of CB-SMBHs in local bright AGNs is fb ~ 10−3 (Volonteri et al. 2009):
 (4)
(4)
where d2 V/dzdΩ is the co-moving volume per redshift and solid angle (Ω ~ 4π),
 (5)
(5)
is the quasar luminosity function (see Hopkins et al. 2007, parameters are given in the last row of their Table 3),
 (6)
(6)
is the residence time of the binary due to gravitational wave emission, tl ~ 107 yr is the approximate AGN lifetime, W = 10 yr − Pmin where 10 yr is the approximate GRAVITY mission, and we adopt a flat probability of eccentricity distribution p(e) ~ e. For simplicity, we assume that, at larger redshifts, we expect brighter and more massive sources and e = 0.5. With these optimistic settings, we calculate that seven eccentric binaries could be detected in the sphere z < 3. As can be seen from Eqs. (3)–(4), the frequency distribution of eCB-SMBHs is reliant on binary system characteristics; in the following section, we therefore describe the models that are used in this study.
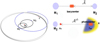 |
Fig. 1 Evolving model for the continuum hot dust emission of eCB-SMBH. Left: computer simulation snapshot illustrating the eCB-SMBH configuration at the time instance of pericentre passage. M1 and M2 are SMBH loci, black ellipses are their orbits, B is the barycentre of the system, the blue circle is the sublimation ring bound to the M2, the grey ring is the CBD, C is the centroid of the arc of the dust ring outside the CBD and the photo-centre of the continuum in GRAVITY’s K band. The masses of the SMBHs are M1 = 6 × 10⁷ M⊙ and M2 = 4 × 10⁷ M⊙, eCB-SMBH eccentricity is e = 0.5, and other orbital parameters are Ω1 = 0.1°, ω1 = 0.1°, Ω2 = 180.1°, and ω2 = 180.1°. See the main text for a description of the coordinate system. Right upper: schematic of the barycentric photo-centre displacement |


2.3 Setup of an astrometric model and an RV data model
We consider the eCB-SMBH model to be a two-body system of SMBHs, such that M1 > M2 (see the left panel in Fig. 1). The formalism is discussed briefly below, and further information may be found in Kovačević et al. (2020b). The true motion of the two components around the barycentre of the system (B) lies in the relative orbital plane of the binary. This is called a coplanar SMBHB system. The common orbital plane is set as the reference plane of the barycentric frame2. The common binary orbital plane is perpendicular to the vector of the binary orbital angular momentum, which is fixed to the barycentre. This vector serves as the Z-axis of the barycentric frame, whilst the barycentre B serves as the origin of the frame. The reference plane is spanned by the X-axis (aligned with the semimajor axis of binary relative orbit and pointing from the barycentre to the pericentre) and the Y-axis (perpendicular to both the X- and Z-axis, making a righthanded triad). The primary and secondary orbits could be orientated in any direction to the observer.
Naturally, dynamical parameters fully describe the SMBH position relative to the barycentre (see Table 1). The apparent relative orbit is that of the secondary around the primary projected on the sky plane, and it can be determined from measurements of the relative position of the components obtained through astro-metric imaging or interferometric observations. The projected spatial motion of the binary components is described using the reference frame centered on the primary component or barycen-tre and two axes in the plane tangent to the celestial sphere (Le Bouquin et al. 2013): the x-axis points north, while the y-axis points east. The z-axis runs parallel to the line of sight and points in the direction of rising radial velocities (positive radial velocities).
The transformations could be represented in the vectors P and Q (or equivalently Thiele-Innes parameters) instead of using cosine and sine terms of rotations. It is also feasible to include any observer position (Kovačević et al. 2020b). The vector of relative position r(t) = [x(t), y(t), z(t)] of an SMBH with regard to the barycentre of the system can be expressed in compact form as
![${\bf{r}}\left( t \right) = {\bf{r}}\left( {\bf{0}} \right) + {\partial _t}{\bf{r}}\left( 0 \right)t + {\bf{P}}\left[ {\cos \,E\left( t \right) - e} \right] + {\bf{Q}}\sqrt {1 - {e^2}} \sin \,E\left( t \right),$](/articles/aa/full_html/2022/07/aa43419-22/aa43419-22-eq13.png) (7)
(7)
where E(t) is the eccentric anomaly determined from the Kepler equation E(t) − e sin E(t) = 2πn(t − t0), n = P−1, and t0 is set to zero for simplicity. The inertial frame is defined by constant vectors of position r(0) and velocity ∂tr(0), which are set to zero for simplicity. P and Q, the auxiliary vectors, are defined as follows:
![${\bf{P}}\,{\rm{ = }}\,a\left[ {{\bf{p}}\,{\rm{cos}}\left( \omega \right) + {\bf{q}}\,\sin \left( \omega \right)} \right],$](/articles/aa/full_html/2022/07/aa43419-22/aa43419-22-eq14.png) (8)
(8)
![${\bf{Q}}\, = \,a\,\left[ { - {\bf{p}}\,\sin \left( \omega \right)\, + {\bf{q}}\,\cos \left( \omega \right)} \right],$](/articles/aa/full_html/2022/07/aa43419-22/aa43419-22-eq15.png) (9)
(9)
 (10)
(10)
 (11)
(11)
The data matching the third coordinate of body position (z(t)) cannot be obtained, but the radial velocity  , which is the time derivative of z(t), may be measured as follows:
![${V_{{\rm{rad}}}} = \dot z\left( t \right) = {{2\pi P} \over {\left[ {1 - \cos \,E\left( t \right)} \right]}}\left[ {C\,\sin \,E\left( t \right) - H\sqrt {1 - {e^2}} \cos \,E\left( t \right)} \right],$](/articles/aa/full_html/2022/07/aa43419-22/aa43419-22-eq19.png) (12)
(12)
 (13)
(13)
 (14)
(14)
Finally, the orbital position (Eq. (7)) and the radial velocity (Eq. (14)) may be expressed in compact form. Recognizing that the auxiliary vector components  and
and  are the Thiele–Innes (TI) elements, we may use Eqs. (7) and (14) to calculate SMBH positions on the sky plane from:
 (15)
(15)
 (16)
(16)
 (17)
(17)
![$\matrix{X \hfill & = \hfill & {\cos \,E - e,Y = \sqrt {1 - {e^2}} \sin \,E,} \hfill \cr {\dot X} \hfill & = \hfill & {{{2\pi P} \over {\left[ {1 - \cos \,E\left( t \right)} \right]}}\sin \,E\left( t \right),\dot Y = {{2\pi P} \over {\left[ {1 - \cos \,E\left( t \right)} \right]}}\sqrt {1 - {e^2}} \cos \,E\left( t \right).} \hfill \cr } $](/articles/aa/full_html/2022/07/aa43419-22/aa43419-22-eq27.png)
The barycentre coordinates (x0, y0, z0) can be included into fitting parameters (Kiyaeva & Zhuchkov 2017); however, in this case we assume the relative position of the secondary with respect to the primary, and therefore they are set to zero.
The preceding sets of equations should be modified for the semi-major axis of the apparent ellipse (ã), which should replace the barycentric semi-major axis of either component (a•). The Newtonian generalisation of Kepler s third law yields a semi-major axis of the apparent ellipse (ã):
![$\tilde a = {\left[ {{{{p^2}G\left( {{M_1} + {M_2}} \right)} \over {4{\pi ^2}}}} \right]^{1/3}}.$](/articles/aa/full_html/2022/07/aa43419-22/aa43419-22-eq28.png) (18)
(18)
As a result, the orbital parameters in Eqs. (15)–(17) match the relative orbit of the secondary. It is worth noting that X and Y are the displacement in the true plane. The measured separations and position angles (p, ϕ) of a secondary at time t are linked to the projected quantities (x, y) by the superficial equations x = Dp cos ϕ, y = Dρ sin ϕ, where D is the distance to the object, and ϕ is called the position angle (PA).
Because the astrometric data, ![$\Xi \left( t \right) = \left[ {{\xi _{x\left( t \right)}} = \rho \cos \phi ,{\xi _{y\left( t \right)}} = \rho \sin \phi } \right]$](/articles/aa/full_html/2022/07/aa43419-22/aa43419-22-eq29.png) , are orbital motions projected in the tangential plane and radial velocity
, are orbital motions projected in the tangential plane and radial velocity  data are radial projections, we may combine these sets into a multi-data ensemble:
![${\cal M}\left( t \right) = \left( {\Xi \left( t \right),\dot z} \right) = \left( {\left[ {{\xi _x}\left( t \right),{\xi _y}\left( t \right)} \right],\dot z} \right) = \left( {{D^{ - 1}} \times \left[ {x\left( t \right),y\left( t \right)} \right],\dot z\left( t \right)} \right).$](/articles/aa/full_html/2022/07/aa43419-22/aa43419-22-eq31.png) (19)
(19)
A complete description of the binary system contains, in addition to orbital elements, the masses M1, M2, and distance. We assume that both masses and distances are known.
To be fitted to the recorded data for epoch t, both the models for projected line-of-sight velocity and radial velocity and the projected locations in the plane of the sky  , known as astrometry (Mede & Brandt 2017), require anomalies (mean M, eccentric E, and true f). Thus, the anomalies are calculated first (Kovačević et al. 2020b), followed by radial velocity, and then the Thiele–Innes equations (Eqs. (8)–(17)) are used to estimate the relative positions.
Seven parameters required to describe a Keplerian orbit of eCB-SMBH in three dimensions.
2.4 Relevance of SMBHB eccentricity
We then addressed the extensive theoretical evidence of the relevance of SMBHB eccentricity as a general picture of SMBH binarity. Studies of the development of the orbital eccentricity of binary SMBHs contained in circumbinary discs suggest that the exchange of angular momentum within the system causes a continuous increase in binary eccentricity in the range 0.6–0.8. (Armitage & Natarajan 2005; Cuadra et al. 2009; Roedig et al. 2011). However, we focus on eCB-SMBH s with eccentricity ~0.5 (Nguyen & Bogdanovic 2016; Nguyen et al. 2019), for which the inner edge radius of the circumbinary disc is ~2.5a (Hayasaki et al. 2013). Because an eccentricity of 0.5 is less than the Laplace limit, the typical power series in the solution to the traditional Kepler equation converges (Moulton 1970; Tiwari & Gopakumar 2020).
Furthermore, even in the late inspiral phase, SMBHBs formed in gas-rich galaxy mergers may retain substantial eccentricities (Armitage & Natarajan 2005; Cuadra et al. 2009). Additionally, N-body simulations of large galaxy mergers produce SMBHBs on eccentric orbits as a result of star interactions (see e.g. Berentzen et al. 2009; Khan et al. 2012, 2013). Also, the Kozai–Lidov oscillation (Wen 2003) might lead to eccentric mergers, in which a distant third object perturbs the binary orbital motion.
N-body simulations of significantly non-spherical major mergers (Khan et al. 2011, 2012) reveal that the coalescence times of SMBHBs are shorter than those expected in spherical models, whereas binary eccentricities stay high throughout the simulations. In these simulations, SMBHBs, for example, could evolve in merger remnants to very high eccentricities of ~0.8–0.99 with coalescence times ranging from 1 to 1.5 Gyr. For steeper density profiles of merging galaxies, binary eccentricities are in the 0.5–0.8 range, although the coalescence time is shorter (0.6–0.8 Gyr). In very steep-profile galaxy mergers, SMBHBs with eccentricities of 0.4–0.6 and very short coalescence times of ~0.4 Gyr are found (Khan et al. 2011, 2012).
Furthermore, numerical simulations indicate that the evolution of the orbital eccentricity of an SMBHB embedded in a circumbinary disc is independent of the mass ratio of the system, but is reliant on the barycentric location (ℒ)3 of the inner edge of the disc (Taylor et al. 2016). For 2 < ℒ < 2.5, binaries will converge to a critical eccentricity value of 0.55 < ec < 0.79. Binaries with initial eccentricities e > ec will pass through a steady decrease in eccentricity, whereas binaries with e < ec will show the increase (Taylor et al. 2016). Also, numerical simulations of the interaction between an eccentric SMBHB and its circumbinary gas disc suggest that eccentricity can be at least 0.01 just a week before coalescence (Rauch & Tremaine 1996; Quinlan & Hernquist 1997; Armitage & Natarajan 2005).
2.5 Physical features of circumbinary discs and hot-dust rings
The quasi-simultaneous NIR and optical spectroscopy study of the continuum around 1 μm in 23 well-known broad emission line AGNs (Landt et al. 2011) reveals that the continuum around this wavelength is dominated by two emission components, a hot-dust ring and an accretion disc. The estimated average hot dust radii for most objects were less than 1 lyr, with more than half falling between a few tens of light days and 200 ld. The alleged sublimation radius changes for some objects (Koshida et al. 2009) have now been questioned, and if anything, the minor variations are debatable (Hönig & Kishimoto 2011; Kishimoto et al. 2013).
Our goal is to show the astrometric approach to studying eCB-SMBH s using the observing capabilities of ground-based facilities. The best AGN targets with hot-dust emission for such surveys are those in the redshift range 0.1 < z < 1.2. GRAVITY+ upgrades will increase the number of observable type 1 AGN to hundreds at z < 0.3, more than a hundred at z > 0.8 – 1, and a dozen quasars at z > 2 (Gravity+ Collaboration 2022). Another assumption (also used in spectroscopic searches for CB-SMBHs by Eracleous et al. 2012; Runnoe et al. 2017) is that the flux in the broad emission line is dominated by the gas flow bound to the secondary SMBH. Several theoretical studies of SMBHBs surrounded by CBD have directly motivated this notion (Hayasaki et al. 2007; Cuadra et al. 2009).
Based on the above, we facilitate our goal by assuming the simplest model in which hot-dust continuum emission is stationary, tracking the inner edge of the circumbinary disc, or hot dust is assumed to form outside the binary and at the sublimation radius (Rsub) of the secondary (Dexter et al. 2020). Furthermore, the dust is optically thin to its IR emission. The dust ring is expected to obscure the BLR for lines of sight close to the plane of the accretion disc (Landt et al. 2011).
In addition to the large body of literature addressing the theoretical aspects of CBDs, growing experimental evidence supports the CBD concept (see Wang et al. 2020a, and references therein). In simulations, (MacFadyen & Milosavljević 2008) detected small values of eccentricity and ellipticity4 of CBD, both between 0.05 and 0.15 at CBD radii of around 2a. The maximum of these two values is reached at much smaller radii ~a. In the case of a misaligned disc, the inner part of the CBD tends to align with the binary orbital plane, while the outer part tends to retain its original state (see Hayasaki et al. 2015, and references therein). As a result, we assume that the CBD is circular and that its orbit is coplanar with the orbits of the SMBHs.
Hydrodynamic simulations of prograde binaries (corotating with CBD) demonstrate that accretion occurs mostly on the secondary, which orbits closer to the inner edge of the CBD in unequal-mass binaries (Artymowicz & Lubow 1994; Roedig et al. 2011; Farris et al. 2014) and eccentric binaries (Cuadra et al. 2009; Hayasaki et al. 2007, 2013; Farris et al. 2014). Based on simulations of galaxy mergers, we analyse binaries with masses 107−1010 M⊙ and mass ratios of 0.1 ≤ q ≤ 1 for which SMBHBs are more likely to form (Callegari et al. 2011; Kelley et al. 2017a). Then, for the secondary SMBH, the range of considered masses is 106 ≤ M2 ≤ 109 M⊙. With a binary mass of 107−1010 M⊙ and an orbital separation of ~0.01 pc, orbital periods range from several decades to a few centuries. Rsub is associated to the secondary luminosity, which together with the black hole mass is linked to Eddington ratio, as follows:
 (20)
(20)
in units of parsecs, where LEdd is the Eddington luminosity, and ϵ = 0.1 is the assumed Eddington ratio of the secondary. This relation is derived (see Dexter et al. 2020) using scaling relations with luminosity (Bentz et al. 2013) and NIR continuum (GRAVITY Collaboration 2020a).
Here, we assume a circular CBD centred at the barycentre (B) of the eCB-SMBH. If the dust ring and CBD are coplanar, they will intersect in two locations, meaning that the following holds true:
 (21)
(21)
where Rsub and RCBD are the radii of the sublimation surface attached to the secondary and CBD, respectively, while  is not constant over time for an elliptical orbit.
Assuming ranges 0.5a < Rsub < 2.5a (Dexter et al. 2020) and RCBD ~ 2.5a(1 + e) ~ 2a(1 + e) (see Roedig & Sesana 2014; Wang & Bon 2020)5, the intersection condition is
 (22)
(22)
We briefly digress to explain the exceptional case of circular CB-SMBHs, for which  const holds, in order to highlight that the intersection requirements can be written using Rsub:
 (23)
(23)
 (24)
(24)
Clearly, if q = 1, then the CBD and dust ring will intersect if 1.5a < Rsub < 2.5a. However, if the planes of the CBD and dust ring are inclined6 and their densities are non-negligible at the crossing, then a slab-like region would be created with direction Lsub × Lcbd rather than a point-like emission structure.
Furthermore, if the dust ring and CBD are both centred in the barycentre of the eCB-SMBH, they will not intersect. Secondly, the dust ring is always considered to be centred on the emission source; therefore, if the secondary is active and producing ionising radiation, the dust ring will be centred on the secondary. The intersection of the dust ring and CBD will result in an irregularity region defined by their arcs. Because of the generated irregularity, the photo-centre location will shift outside the CBD arc to the centroid of the dust-ring arc. The new position of photo-centre will be referred to as the astrometric perturbation. Moreover, if the dust-ring is positioned at a radial distance Rdust from the hot accretion disc, the dust-ring will reprocess the UV/optical to thermal NIR radiation with a characteristic time-delay of τdust = Rdust/c. For around two-dozen Seyfert galaxies, reverberation lags between NIR (K-band, 2.2 μm) and optical (V-band, 0.55 μm) light curves are reported (Minezaki et al. 2004; Suganuma et al. 2006; Koshida et al. 2014; Pozo Nuñez et al. 2015).
Dust in the vicinity of AGNs absorbs the UV/optical radiation from the accretion disc and re-emits in the IR. The dust sublimates at ~1500 K, resulting in the hottest dust emission, which peaks at ~2 μm. Even though the Wein tail diminishes exponentially, part of the hot-dust emission will reach optical wavebands, as demonstrated by (Sakata et al. 2010). According to (Hönig 2014), the fractional contribution of the dust in filters i, z, and y is particularly sensitive to the redshift of the object. The dust contribution to the y-band is ~i0% up to redshift z ~ 0.1, but declines to ~5% at redshift z = 0.2. Consequently, in the following sections, we incorporate the NIR dust emission into the model.
We assume that NIR emission FNIR is a scaled version of the optical continuum  because the response of the IR emission to the driving time variability of the AGN UV/optical continuum may be described as the convolution of the UV/optical continuum with a transfer function (Almeyda et al. 2017). Similar relationships can be seen in the optical band (Cackett & Horne 2006). The left plot of Fig. 1 shows a 3D visualisation (in Mayavi2) of results from running simulations of the full model with typical eCB-SMBH values.
3 eCB-SMBH detectability
We derive analytic expressions for the detectability of eCB-SMBH s in astrometric data, while taking into account some basic GRAVITY+ parameters. We first find a simple analytical relation for detectability based on the photo-centre offset caused by the evolving hot dust emission model (Sect. 3.1). We then quantify detectability based on the astrometric signal in the limit of binary eccentricity as a main factor of orbital shape (Sect. 3.2). Both approaches are related to the signal amplitude, which is an order-of-magnitude estimate of detectability.
3.1 The detectability of eCB-SMBH astrometric signal based on a hot-dust emission source
We can estimate whether the astrometric signature of eCB-SMBH s is above the detection threshold of the GRAVITY+ instrument, understanding that a detailed insight is dependent on the physics of the target and equipment features. Because the secondary SMBH is active and bright enough to be observed, we explore the following definitions. The barycentric astrometric displacement of M2, ignoring the dust-ring and the CBD, caused by a companion with mass M1 is as follows (see e.g. Reffert & Quirrenbach 2011):
 (25)
(25)
where a1 is the barycentre-to-M1 distance, D is the observer-to-object distance (see upper right plot in Fig. 1), and a1 /D is the angular separation of M1. Based on our prior discussion of the physical properties of CBD and the hot-dust ring in Sect. 2.5, the NIR emission flux (FNIR) is a scaled version of the optical continuum Fc (at 5100 Å), as follows: 
We employ astrometry here in order to achieve accuracy below the resolution of the system. The dust region tied to the secondary intersects with CBD (see the left plot in Fig. 1) over a specific period of time and may serve the above purpose. Given the fact that the BLR detection limit of an AGN is on the order of ~40 μas for GRAVITY and 10 μas for GRAVITY+, NIR interferometric observations could be used to map out the binary orbit by measuring the photo-centre difference between a broad emission line and the hot-dust continuum, rather than by resolving hot-dust emission (Dexter et al. 2020).
Assuming that the photo-centre displacement is caused by an irregularity (arc of dust-ring cut by the CBD) at a distance  (see the right bottom plot in Fig. 1), the position of the centroid of brightness is
 (26)
(26)
Despite the exponential decrease of the Wien tail, some contribution of hot-dust emission will reach optical wavebands (Hönig 2014). (Sakata et al. 2010) detected a dust contribution in the I-band after estimating the colour variability of optical variability. As a result, optical emission is made up of contributions from two distinct emission regions. According to (Tomita et al. 2006), the accretion disc component contributes 15–30% of the NIR flux in the H band and 15–25% in the K band and may be calculated using V-band emission data (see Tomita et al. 2006; Koshida et al. 2009). Therefore, we assume that Fc was determined beforehand.
Simply subtracting the term r2 from the left and right sides of Eq. (26) yields the photo-centre displacement with respect to the M2, as seen below:
 (27)
(27)
The photo-centre angular displacement will then be determined using the following formula:
 (28)
(28)
with the assumption that the FNIR contribution is substantially smaller than the Fc contribution. The quantity  corresponds to Δx in (Dexter et al. 2020).
The total photo-centre displacement Δa is a superposition of the barycentric dynamical astrometric displacement  and the photo-centric displacement (‘perturbation’)
  produced by anomalies in the flux distribution of the unresolved sublimation surface intersecting CBD. If the scaling relation between the optical continuum (Fc) and NIR emission (FNIR) for the secondary SMBH is
  (Cackett & Horne 2006), the photo-centre angular offset relative to the secondary is as follows:
 (29)
(29)
where α =1/β
For different photo-centre displacements, we first show the flux ratios of the NIR emission originating in the dust ring with respect to the optical continuum as a function of dust-ring diameter. Using the mean distance of the ten best GRAVITY+ circular targets (~700 Mpc) and assuming late-Universe parameters H0 = 67.36kms−1,Ωm = 0.3166,ΩΛ = 0.6847 (Planck Collaboration VI 2020), we show in Fig. 2a that as the ratio  increases for a given h, so does
  . Next, we assess the detectability of such irregularities using the GRAVITY detection limit in K band to λlim ~ 1.95μm (GRAVITY Collaboration 2017).
To do so we compute a rough approximation of
 (30)
(30)
by estimating flux in FNIR with a modified surface brightness description that scales with ~1/h2 in proportion to the Planck curve (Kishimoto et al. 2011) and a continuum source whose brightness is equal to the GRAVITY wavelength detection threshold (i.e. setting astrometric observing wavelength λir = 2.2μm of irregularity region)7.
The blue curve in Fig. 2a shows the corresponding lower limit for GRAVITY+ observing wavelength. GRAVITY+ may detect the astrometric signal of irregularity whose FNIR/Fc is above the blue curve. Thermal emission and light scattering can be significant in the K-band (see Weigelt et al. 2004), and the lower limit detectability curve can vary. Different mechanisms in the system may broaden the parameter space where the ‘irregular region can be bright enough to cause a photo-centre shift yet remain unresolvable.
3.2 The detectability of eCB-SMBH astrometric signal in the limit of eccentricity
The astrometric signature of a given object decreases with increasing distance and is dependent on the signal-to-noise ratio (S/N). Here, we present an approximate estimate of the (S/N) for various eCB-SMBH mass ratios and eccentricities. A method like this will also provide an estimate of the distance from Earth at which an eCB-SMBH can be detected.
To establish a generic relation for an eCB-SMBH, we consider the astrometric signal of a circular binary, which is given by
![${\cal A} = {\left[ {{{{p^2}G({M_1} + {M_2})} \over {4{\pi ^2}}}} \right]^{1{\rm{/3}}}} \times {D^{ - 1}},$](/articles/aa/full_html/2022/07/aa43419-22/aa43419-22-eq55.png) (31)
(31)
where D is the distance to the object. However, when the radial velocity amplitudes of components  are available, the astrometric signature can be rewritten as follows:
![${\cal A} = \left[ {{{P({K_1} + {K_2}\sqrt {1 - {c^2}} )} \over {2\pi \sin (i)}}} \right] \times {D^{ - 1}}\~\left[ {{{P({K_1} + {K_2})\sqrt {1 - {e^2}} } \over {2\pi }}} \right] \times {D^{ - 1}}.$](/articles/aa/full_html/2022/07/aa43419-22/aa43419-22-eq57.png) (32)
(32)
We can simply approximate the relationship between astro-metric signals of circular and eccentric binaries using the above terms, as follows:
 (33)
(33)
However, (Reffert & Quirrenbach 2011) provide more stringent constraints on the astrometric signal of an eccentric orbit. We anticipate that orbital period P, binary mass, and the S\N will be the primary parameters influencing eCB-SMBH detectability. We define the astrometric S/N  based on standard data analysis, which suggests that enhanced S/N happens with increasing number of observations (N):
 (34)
(34)
where σ is the single epoch noise, and we use the factor Γ ~ 1 to accommodate for the characteristic of the signal and power index γ = 0.5 for simplicity.
Eccentricity makes detection more challenging at short periods, because uneven sampling frequently results in poor phase coverage during rapid pericentre passage. The width of peri-centre passage is ~(1 − e)2P (Cumming 2004), which means that for binaries with P = 1yr, e = 0.5, observations should cover a small window of 3 months of periastron passage. On the other hand, transition to a long-period regime occurs when  (Cumming 2004), which means that the number of orbits observed is
  . The final term should also represent the probability of a binary being in the correct phase (i.e. in the width of pericentre). However, the enhanced velocity amplitude and acceleration near the perias-tron boost detectability in long-period objects. Specifically, this means that if viewed at the right phase, can have tracks that are incompatible with linear motion even when the period is long. Taking the above into account, we can update Eq. (34) as follows:
 (35)
(35)
where NO takes into account the arc of the observed binary orbit in the long-period regime and  is related to degradation of the observational cadence due to unpredicted situations. Thus,
  gives the true coverage of the arc of orbit. When
  , there is no unpredicted loss of observations.
We may evaluate some aspects of eCB-SMBH detectabil-ity using Eq. (35). This is illustrated in Figs. 2b and c, which assume eCB-SMBH s of various mass ratios, semi-major axes,  , and σ ~ 6 μas. We optimistically expect the GRAVITY+ error in each coordinate to be about half of the present accuracy of GRAVITY in each coordinate σ ~ (9.5/2) μas (Lacour et al. 2014), such that the combined error measurement of both coordinates is
  .
.
The S/N can be subjected to a given threshold, such as  (i.e. the binary motion dominates over the error); hence, Figs. 2b and c provide the approximate S/N needed to detect eCB-SMBH s. As indicated by the overplotted GRAVITY+ targets, the S/N of objects in circular orbits is expected to be higher. For observation loss of
  , implying 10% observational coverage of pericentre width, it is expected that eCB-SMBH s with q = 0.1 at a mutual distance of 0.01 pc would be impossible to detect (see subplots b and c). However, S/N is approximately two or three times higher when there is no degradation in observational cadence (
 , subplot c). These estimates support the detectability of eCB-SMBH s, which is discussed throughout the text.
Given that the dust reverberation mapping technique may relate AGN V magnitudes and distances (Yoshii et al. 2014), we additionally mapped the expected detection distance across V magnitudes (see Fig. 2d). This is accomplished by solving the simple equation for ‘maximum detection distance’ (Casertano et al. 1996), which has been adjusted for our purposes. As the astrometric signature decreases with increasing distance, and the measurement error increases as the object (with absolute magnitude M) becomes fainter with increasing distance, the maximum detection distance is the solution for D of the equation
 (36)
(36)
where the right side of the equation represents the three times the error in one year normal point (see Casertano et al. 1996) assuming a single observation error of σ ~ 6 μas for objects with V = 15, and factor  for converting single-point measurement error (in two coordinates) to one year normal point error if GRAVITY+ made six observations per object in a year.
In the following section, we parameterise our simulations across a grid of eCB-SMBH orbital parameters, and display the results over a grid of the most important parameters impacting  : period, total mass, and eccentricity.
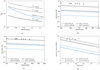 |
Fig. 2 Various aspects of eCB-SMBH detectability with GRAVITY+. (a) Flux ratios of the NIR emission originating in a dust ring with respect to the optical continuum as a function of h (dust-ring dimension), for different photo-centre displacements, shown as black lines. The GRAVITY approximate detection limit at λlim ~ 1.95 μm in terms of the flux ratio for dust emission arising at different distances and observed at 2.2 μas is shown as a blue curve. The shape of the blue curve depends on which power index of h is chosen; here its value is set to –2. (b) Expected S/N for NO = 0.25 and |


4 Synthetic survey data and orbit fitting results
4.1 Multi-data simulation
We simulate astrometric and RV data to evaluate the detectability of a eCB-SMBH when its orbit is incomplete. For binary stars, Aitken’s criterion typically needs $$, where forb is the portion of the observed orbit (Aitken 1964; Lucy 2014). In this section, we analyse incomplete orbit measurements of forb ~ 0.05–0.11, in which a binarity signal is barely detectable because of a limited number of observations, which may be realistic for some eCB-SMBH s. The fitting procedure on an incomplete data set might result in multi-modal MCMC posterior distributions (as confirmed in exoplanet detection Ford 2006).
Here, we let W be a space composed of vectors containing the eCB-SMBH parameters wk = (Mk,, ãk, ek, ik, Pk, Ωk, ω)k ∈ W, where k = 1,2. Given these vectors, the binary is ‘observed’ at times:
 (37)
(37)
for k = 1,…,N so that forb is uniformly sampled. At each time fn, the ‘observed’ multi-data set is obtained as: ℳ(wk, tn) The Bayesian approach does not require uniform sampling, and therefore it is assumed here for simplicity. The obvious alternative is random sampling, which might be an unrealistic model for GRAVITY+ observational time baselines.
The errors for each artificial observation are independent and identically distributed, resembling white noise at the level of 5%8. In order to avoid using the same model for the observations and finding the inverse solution (see Kaipio & Somersalo 2005; Tuomi et al. 2009), additional jitter was added in the model when simulating the data. Otherwise, the simulated observations and the corresponding solutions would only aid in examination of the model, which is not always encountered in reality (Tuomi et al. 2009).
In addition, three models of NIR continuum emission photo-centres (rm) are included in the synthetic observations:
 (38)
(38)
where L is the length of the arc determined by the intersection of the sublimation radius bound to the secondary SMBH (rsub) and CBD (rCBD). For simplicity, the density of the sublimation surface arc between any two loci g(rsub) is considered to be one. During eCB-SMBH orbital motion, the intersection points of the CBD and the sublimation ring are determined for each time instance t (see the left panel in Fig. 1). The average dust ring offset is assumed to be  .
.
If the continuum emission is stationary, that is, fixed to the inner edge of the CBD (rm ∝ c), then its position with regard to the eCB-SMBH barycentre is constant (see the first branch of the Eq. (38)). However, the centroid of the arc of the dust-ring split by the CBD, as seen in the second branch, will be the location of the evolving continuum emission photo-centre. Deriving its analytic form is simple (e.g. see Appendix A) and can take several forms depending on the coordinate system. In general, the behaviour of the astrometric offset of the photo-centre relative to the secondary for the non-static continuum emission of the eCB-SMBH (see the left panel in Fig. 3) follows the trend found in a circular CB-SMBH (Dexter et al. 2020), with slight modifications due to eccentric motion. We find that anti-aligment of the angular momenta of the sublimation surface (Lsub) and CBD (LCBD) has no effect on the overall behaviour of the photo-centre of the non-static hot-dust emission seen in Fig. 3. We show the temporal evolution of the offset in both astrometric coordinates across one orbital period for eCB-SMBH s of various masses {(M1, M2)} = {(60,40), (6,4), (2,1), (4,1), (10,1)} × 107M⊙, fixed orbital parameters e1 = e2 = 0.5, Ω1 = 250°, ω1 = 220°, Ω2 = 70°, ω2 = 40°, Rsub = 150ld, and a mean mutual distance of 100 ld for a non-static continuum emission model (see Fig. 3 right panel). Finally, the sinusoid variation of the continuum emission photo-centre in the dust torus is represented by the third branch of Eq. (38).
The simulated observational campaigns are constructed by C = (N, T, P), each with a different total number of observations (N), monitoring campaign length (T), and eCB-SMBH orbital period (P). When simulating the measurements, the monitoring campaign parameters are set to C1 = (10,12 yr, 221 yr) and C2 = (14,10 yr, 93.75 yr). In these scenarios, the values of all the other orbital parameters, including the masses and coplanarity of the eCB-SMBH and CBD were fixed.
4.2 Orbit fitting
Historically, the incompleteness of binary orbits has been handled by scanning parameter space for the global minimum, which may be the closest practical approximation to the truth, or by establishing a complete set of acceptable orbits and then computing an average (e.g. see Lucy 2014, and references therein). However, the posterior probability distribution of model parameters contains all of the information in a Bayesian framework. By scanning parameter space, the posterior means of the orbital elements or any function of them can be determined without finding minima.
As Bayes theorem indicates, by combining two or more measurement methods (e.g. astrometry and radial velocity in our case), we can infer more information about the observed target than relaying on a single method:
 (39)
(39)
where P(param|data) is the posterior distribution, which provides the probability distribution of the full Keplerian model parameters given the observed data (i.e.  ); P(param) is the prior distribution, which reflects the prior belief about the values that the unknown parameters w can take before observations are obtained; and P(data|param) is the likelihood distribution, which gives the probability distribution of data values that can be measured for the given parameter values. Because the astrometric data and radial velocity are measured independently, Eq. (39) may be rewritten as follows:
 (40)
(40)
In the Bayesian formulation, an increase in information is reflected either as an increasing set of model parameters or narrow parameter densities.
For all parameter combinations, the posterior probability distribution is calculated by integrating Eq. (40). However, the parameter space W (defined in Sect. 2.3) is large because of the high dimensionality of the Keplerian model. To estimate the posterior distribution in an acceptable period of time, we used the numerical sampler to efficiently explore the parameter space W. PyMC3 (Python package for Bayesian inference Salvatier et al. 2016) is adequately sampling the posterior without exploring unfeasible parts of parameter space. We also summarise the calculated posterior distribution by the region with the highest posterior density (HPD), and the lowest volume of all (1–α)% credible regions Cα, so that the following holds:
 (41)
(41)
For the unimodal posterior, the HPD region consists of a single region of the parameter space. However, if the posterior is multimodal, the HPD may consist of an ensemble of disjointed regions, the estimate of which is typically more computationally expensive. The HPD corresponds to locating the true parameter in the smallest possible region of the sample space with a given probability (1–α).
The use of Bayesian inference between RV and astrometric data allows the model parameters to be fit to the artificial data containing three types of perturbations. The PyMC3 NUTS sampler is an MCMC technique that avoids random walk behaviour and enables faster convergence to a target distribution. This has the advantage of not only being faster, but also allowing complex models to be fitted. Two chains of the PyMC3 NUTS sampler were run. The beginning state w(0) of each chain is picked at random from the prior distribution, affecting only the pace of convergence. We had 5000 samples per chain to auto-tune the sampling algorithm and 4000 productive draws yielding a total of 20 000 samples per chain. It is worth noting that, in addition to parameter priors, the model considers observed data while constructing the posterior distribution.
For the purpose of this study, we devised the following protocol. Three groups of tasks are identified: (1) the simulator generates the simulated observations, assuming specific characteristics of the eCB-SMBH; (2) the solver uses the simulated data to find ‘solutions’ of eCB-SMBH orbital parameters; and (3) the evaluation takes both the ‘truth’, that is, the input parameters, from the simulator and the solutions from the solver, compares the two, and draws a set of conclusions. All tasks require a separate set of simulations, and they are carried out in several steps:
Simulation of the observation: (a) For the synthetic observational campaign C1 = (10,12,221 yr), we assume that the binary is observed with the following parameters: M1 = 6 × 10⁷ M⊙, M2 = 4 × 10⁷ M⊙, e = 0.5, Ω1 = Ω2 = 180°, ω1 = 181°, ω2 = 1°, Rsub = 150 ld, mean mutual distance of 100 ld, an object distance of ~700Mpc, and an observer position angle of π/6. The average distance of the best ten GRAVITY+ circular binary candidates is 700 Mpc. (b) For comparison, we consider the monitoring campaign parameters C2 = (14,10,93.75 yr), eCB-SMBH parameters of M1 = 6 × 10⁸ M⊙, M2 = 4 × 10⁸ M⊙, and the same remaining orbital parameters as in (a).
Solver: the prior probability distributions for the model parameters that are assumed to be independent are shown in Table 2. Physical and geometric considerations lead to natural choices for the prior PDFs for most of the model parameters. We choose normal priors on M centred on 107 7.M⊙ as estimates of SMBH mass functions peak between 107M⊙ and 108 M⊙ for quasars at z ~ 0.50–1 (Kelly et al. 2009). The normal priors on P are centred on 200 yr, because the period for the binary at a mutual distance of 0.05 pc and total mass of 107.7 M⊙ would be ~150 yr. We adopt non-informative, uniform priors on orbital angles. The bounds of the uniform PDF are defined in such a way that the tool does not explore unphysical domains. Because of the uncertainties in the artificial data, the likelihood distribution of the fitting procedure is chosen as a Gaussian distribution centred at both astromet-ric variables
 and radial velocity ż given by Eq. (19) with standard deviations of 5%. The error priors are drawn from normal distributions that are centred at expected errors of artificial data and have a standard deviation of 5%.
Evaluation: It would be useful to assess how the detection algorithm performs across the entire parameter set. However, due to the great complexity of the problem, we use (M, P, , e) as proxies to understand the behaviour of the eCB-SMBH orbital solutions. We compare the results obtained from fitting observations from two different campaigns in this section and evaluate additional considerations in subsequent sections.
As an example, Fig. 4 shows the simulated RV and astromet-ric data for evolving offset obtained from the simulator for campaigns Ci, i = 1,2. The solver performed the Bayesian fitting procedure to determine how well the orbital parameters of an eCB-SMBH can be measured for two different campaigns determined by the simulator. The distributions of the modelled posteriors are depicted in Fig. 4. Figure 5 shows the corresponding densities of orbital parameters9 (P, M and e) for campaign C1 = (10, 12, 221 yr). We can observe that the maximum a posteriori estimates of these densities are fairly close to the original binary parameters. The period, eccentricity, and total mass are all feasible, although with a reduced degree of certainty.
For the second type of monitoring campaign C2 = (14, 10, 93.75 yr), the simulated observed data span ~10% of the orbital period (see Figs. 6 and 4). The solver found that the mass, orbital period, and eccentricity are more likely to be reconstructed when using a data set based on a model with evolving dust constant and variable dust offset models. In contrast, for objects of greater mass, the inferred periods are closer to the real value (compare results in Table 3 vs. those in Table 4), as well as the posterior distribution of RV curves and astrometric orbits for fitted parameters (see Fig. 4).
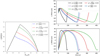 |
Fig. 3 Temporal evolution of the offset in both astrometric coordinates across one orbital period for different eCB-SMBH parameters (see the text). Left: general evolution of the astrometric offset of the photo-centre relative to the secondary with respect to Rsub/a at half orbital period (see the second branch in Eq. (38) and Appendices A and B) for eCB-SMBH of varying mass ratio (q) and at a distance of 700 Mpc. Right: evolution of the photo-centre offset in two astrometric coordinates with respect to varying mass ratio and complete orbital period. The mean distance between the components is 100 ld, and the assumed distance between the object and the observer is 700 Mpc. |
Priors for the model of the motion of the secondary component.
5 Refining the eCB-SMBH detectability
Motivated by the upcoming GRAVITY+ instrument operations, we evaluate the detectability of eCB-SMBH systems using simulated multi-data sets (astrometric and RV). We extended the investigation by (Dexter et al. 2020) to a broader parameter range (particularly eCB-SMBH eccentricity) while accounting for the realistic and unfavourable percentage of eCB-SMBH orbits covered by observations. For the continuum hot dust emission, we use constant, evolving, and fluctuating models, as well as the eCB-SMBH dynamical model for the astrometric and RV data simulations. We quantify eCB-SMBH detection by the GRAVITY+ instrument in terms of a simple detectability statistics as well as Bayesian inference of an incomplete (forb ~ 0.1) eCB-SMBH orbit using hot-dust emission models. Based on MCMC orbit fitting, we find that the evolving hot-dust emission model is more resilient10 when recovering the basic orbital parameters of the eCB-SMBH than constant and fluctuating models.
Besides the above general outline, eCB-SMBH detection refinements based on the additional considerations, for example, variation of q, forb parameters (Sect. 5.1), ability to retrieve orbital eccentricity from radial velocity and acceleration data (Sect. 5.2), and refinement of binary detectability in contrast to other CBD phenomena (Sect. 5.3), are discussed below. We conclude this section by recapitulating the SARM technique, which can be employed for refinement of binary detection either through follow-up or as an independent binary detection tool (Sect. 5.4).
5.1 Refinement of binary detectability based on variation of q, forb parameters
When formed in minor galactic mergers, it appears that typical eCB-SMBH s could have different mass ratios (q). If a binary is the outcome of a major merger, then the mass ratio can be moderate and deviate from unity q ~ 0.5 (Armitage & Natarajan 2005). Accounting for galaxy luminosity statistics leads to the conclusion that most galaxy interactions feature central black holes with mass ratios in the range of  (Gergely & Biermann 2008).
Two binaries should have slightly different astrometric signatures if their mass ratios are slightly different. If we compare a binary with parameters q = 0.1, M1 = 10 × 106 M⊙, M2 = 106 M⊙ to a binary with q = 0.11, M1 = 108 M⊙, M2 = 11 × 106 M⊙, then the latter system will have an 11% larger astro-metric signature. Consider the impact of extreme ratios of small integers (smaller or equal to 10), q = 1/10 = 0.1, extreme ratios of large integers q = 67/100 = 0.67, and non-extreme but unequal mass ratios, q = 0.25,0.5, on the astrometric signal detectability and astrometric data. The astrometric S/N and detection distance for eCB-SMBH s with equal mass ratios are greater than those with slightly non-equal mass ratios. The best GRAVITY+ circular targets are distinguished by their high S/N and large detection distance. Interestingly, the time evolutions of astrometric offsets are clustered into two distinct groups based on two types of SMBH mass ratios: extreme and moderately unequal (see Fig. 3b).
After describing the difference in time evolution of astro-metric offsets caused by different mass ratios, let us now address the incompleteness of orbits (forb ~ 0.05–0.1), when any time instance of observation meets the condition  (see e.g. Fig. 4). A basic inspection of Eq. (7) shows that in such small time instances, vector components vary little and can correlate. When assuming e ≈ 0, then the following expressions hold true: E(t) ~ 2πn(t − t0) and r(w, t) ~ a•(p cos(ω + 2πnt) + q sin(ω + 2πnt)). We can expect small perturbations of the model r(w, t) − r(w + δw, 2πn(t − t0 + δt0)) ≈ 0 for small perturbations of the vector of parameters w. However, this implies that δw ~ nδt0 (we note that n scales inversely with the period of the binary), resulting in a correlation between ω and t0. Furthermore, the right-hand side of the Kepler equation will converge to extremely small values. These tiny effects can distort posterior PDFs of parameters (see Fig. 5), causing orbital parameters to be underestimated or overestimated. A further challenge is that three parameters in the model (P, e, ω) contribute to the astrometric offsets and radial velocity in a non-linear fashion. Moreover, the values of the parameters under discussion typically differ across orders of magnitude. The binary total mass has magnitudes of order 107−10 M⊙ yet periodicity spans 10−103 yr. Another issue is that posteriors of mass and eccentricity are often highly correlated, leading to substantially slower Markov chain convergence.
Even for incomplete binary orbits (fobs ~ 0.05−0.1), we see impacts of Bayesian inference (see Eq. (40)); for example, conjugated multiple observational techniques generate more information on the system – either in a narrower posterior parameter density (Figs. 5 and 6) or in the potential of include additional parameters in the model or in the capability to include additional parameters in the model. Figures 5 and 6 show how posterior PDFs differ from perfect Gaussian distributions, particularly in the case of eccentricity. However, the vast majority of prior PDF samples have been discarded, and only a small subset of periods, masses, and eccentricities are compatible with the data. Even distorted posterior PDFs can give a very informative prior PDF for the design of future surveys (Price-Whelan et al. 2017). Tables 3 and 4 compare the median values recovered from three models; comparing posteriors to the true values. Except for the other true parameters, only the total mass for the eCB-SMBH with a 221 yr orbital period falls within the central 3σ credible intervals of the recovered value for the evolving model (Table 3).
At the same time, binary masses derived from the constant and fluctuating models are less well specified. In contrast, for the eCB-SMBH with a shorter orbital period (93.25 yr), the true values of period and total mass fall within the central 3σ credible intervals of the recovered values (see Table 4), but the true value for eccentricity is within the 3σ of the recovered values. We cannot rule out the possibility that the apparent effect of a specific type of ‘uncertainty principle’ in determining P and e is caused by their different roles: e (along with a) accounts for the two degrees of freedom in the shape of the orbit, whereas orbital period P locates a given object on its orbit at a given time.
Furthermore, such uncertainty can develop as a result of a lack of knowledge about the true eccentricity distribution expected for eCB-SMBH s. Namely, we do not know whether eCB-SMBH s can be separated into different subpopulations based on eccentricity and total mass as is the case with close stellar binaries (Halbwachs et al. 2003). We also allow for an overall jitter in the radial velocity curve and astrometry data to accommodate for imprecise knowledge of data uncertainties and any intrinsic scatter. However, in model fitting, we did not consider jitter to be a non-linear parameter (Price-Whelan et al. 2017). Finally, the Keplerian model is dependent on the data rather than being a simple function of the non-linear fitting parameters. Increasing the non-linear11 parameter e, for example, has an effect on the model, not just because it is more eccentric, but also because the linear parameters have different values at this new e value (see e.g. Wright & Howard 2009). A possible approach for these issues would be to introduce fitting on analytically transformed orbital elements.
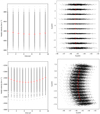 |
Fig. 4 Simulated incomplete observations of RV and astrometric data of the secondary SMBH (red crosses) and the distribution of the modelled posteriors (black dots) for the evolving model given in Fig. 5 (forb ~ 5%), upper row) and Fig. 6 (forb ~ 10%), bottom row). Left column: RV data for the secondary SMBH and the posterior distribution of simulations over time. We note here the RV curve gradient differences: almost constant (upper row) and variable (bottom row). Right column: astrometric observations of the secondary SMBH and the posterior distribution of simulations over time. |
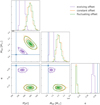 |
Fig. 5 Joint posterior distribution resulting from the Bayesian inference for three different perturbations in simulated data of eCB-SMBH with monitoring campaign C1 = (10, 12 yr, 221 yr), binary components M1 = 6 × 10⁷ M⊙, M2 = 4 × 10⁷ M⊙, and a mutual mean distance of 100 ld (other orbital parameters are given in the text) for (i) a constant offset hot-dust continuum, (ii) a fluctuating hot-dust continuum offset, and (iii) the evolving continuum model where the offset tracks the orbital motion of the secondary. The diagonal plots show the marginal distribution for each parameter (the projection of the posterior onto that parameter). The contour plots represent the 95% and 68 % credible regions (not proportional to one- and two-sigma level) described in Eq. (41). The solid blue lines represent the true parameter values. The covariance between the total mass and period seen here arises from Kepler s third law implemented in our model. |
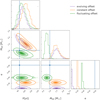 |
Fig. 6 Same as Fig. 5 but for an eCB-SMBH with monitoring campaign C2 = (14, 10 yr, 93.75 yr), binary components, M1 = 6 × 10⁸ M⊙, M2 = 4 × 10⁸ M⊙, and a mean mutual distance of 119 ld. |
5.2 Refinement of detecting binary orbital eccentricity from radial velocity and acceleration data
Another refinement that has yet to be addressed is how to independently test the eccentricity of the eCB-SMBH orbit. We recall that the expression for relative radial velocity can be provided by
 (42)
(42)
where f is the true anomaly, and  . It should be noted that the radial velocity of the secondary with respect to the barycentre is simply given by
  . For moderate values of mass ratio and separations, the barycentre will be outside the event horizon of the components (McKernan & Ford 2015). In such a case, the fluctuation of the barycentric radial velocity of the secondary can be represented as
 (43)
(43)

We can substitute f in Eq. (43) as follows:
![$\ddot z(t) = {{ - 2\pi \kappa } \over {P{{(1 - {e^2})}^{{3 \over 2}}}}}\sin \,\beta .\,\,{[1 + e\cos ( - \omega + \beta )]^2},$](/articles/aa/full_html/2022/07/aa43419-22/aa43419-22-eq111.png) (44)
(44)
where  . The relation
  holds for circular binaries, in which case Eq. (44) defines an ellipse
  . However, if e > 0, the curve provided by Eq. (44) will be distorted. Thus, fitting radial velocity and acceleration data with Eq. (44) results in a new test for the eccentricity of the eCB-SMBH. This can be useful when broad-line centroids or peaks exhibit velocity shifts that match those expected by orbital motion but are caused by varied BLR illumination (Lewis et al. 2010; Wang & Li 2011; Popović et al. 2014; Barth et al. 2015). Examining the relationship between acceleration and radial velocity will aid in the elimination of false binary candidates. Figure 7 shows differences in the velocity-acceleration curves when comparing circular to elliptical motion of the secondary SMBH. (Liu et al. 2014) and (Eracleous et al. 2012) measured the accelerations of binary SMBH candidates by dividing velocity changes by the rest-frame time intervals between observations, which can be affected by orbital phase and period (Liu et al. 2014). However, if the radial velocity curve can be folded over the photometric phase
  , the following will be true: dvrad/dψ = PdVrad/dt. The last equivalence suggests that without knowing the period P, the values of scaled radial acceleration by period (PdVrad/dt) can be obtained simply by computing the phase derivative of the curve.
5.3 Refinement of binary detectability in contrast to other CBD emission phenomena
Because of a periodic variation in the mutual distance of the SMBHs, there could be a range of orbital phases where the sublimation ring is totally contained in the cavity of the CBD. However, outside of this phase range, the dust ring and CBD may intersect. If the sublimation ring is completely inside the cavity, the emission may emanate from the intersection of the sublimation ring and the arms of the infalling matter from the CBD, assuming the CBD is sufficiently thin. The mass inflow from the CBD is greatest around the apoastron of the binary orbit, as demonstrated by (Hayasaki et al. 2007). The majority of infalling gas is captured by black holes shortly before the periastron, where we would expect the most of such emission to occur.
Nonetheless, when the CBD is sufficiently thick, we anticipate that optical and IR radiation will be released mostly from the outer regions of the CBD. In reality, the CBD imperfections may be more complicated, resulting in more complex occurrences in inflows. The Keplerian motion is not just a distinguishing feature of eCB-SMBH s in their early stages of evolution. Such motions can also be produced by disc spots (if their velocities are Keplerian; see e.g. Gezari et al. 2007). Whether the angular velocity of a hot spot is constant or not implies a circular or eccentric orbit in the disc (Newman et al. 1997). It is also feasible that the radial velocities of these non-static anomalies are not Keplerian (Gezari et al. 2007). For eCB-SMBH detection, it is critical to determine whether or not the photo-centre displacement is Keplerian.
Furthermore, if the displacement is caused by Keplerian motion, the inferred orbital eccentricity of the object based on the astrometric offsets could be used to distinguish between the eCB-SMBH and another phenomenon (bright spot, spiral) that is mimicking the signal. Bright spots and spirals may have small eccentricities, whereas the orbits of eCB-SMBH s may be more eccentric. The fact that the hot spot can remain with nearly constant strength for multiple orbits before decaying over a shorter time (Newman et al. 1997) allows us to rule out such emission as a binary possibility. The timescales related to one-armed spiral waves and precession of the warp might be too long to account for the observed orbital period (Newman et al. 1997).
The above arguments are not a prescription for distinguishing between eCB-SMBH s and other occurrences, but rather provide some ideas as to the various possible phenomena that may be seen in observations.
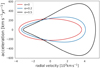 |
Fig. 7 Effects of eccentricity on deformation of the curve defined by the radial acceleration of the secondary SMBH and its radial velocity relative to the primary. eCB-SMBH parameters are P = 100 yr, ω = π/3, i = π/4, ã = 100 ld, and M1 + M2 = 5.2 × 10⁸ M⊙. |
5.4 Refinement of binary detectability via Joint SpectroAstrometry and Reverberation Mapping
We highlight the possibility of combining SpectroAstrometry (SA) and Reverberation Mapping (RM; SARM) for future detection of CB-SMBHs using GRAVITY+. In practice, GRAVITY measures the spatial distributions of ionised gas in the nuclear region via SA, whereas RM provides the most information on the radial distributions of the nuclear regions. As a result, SARM analysis will, in theory, reveal the global picture of nuclear regions first advocated for 3C 273 by (Wang et al. 2020b) and effectively applied to NGC 3783 by (GRAVITY Collaboration 2021a). Considering profile variations during the RM campaign, (Li et al. 2022) developed more sophisticated method for two-dimensional SARM which will improve measurements of SMBH masses and cosmic distances. The use of SARM with observations of CB-SMBHs in the future appears to be promising.
6 Discussions: models and measurements
Here, we distill a list of potentially important issues for the interpretation of CB-SMBH interferometric observations arising because of model limitations (Sect. 6.1) and challenges faced in measurements of binary radial velocity (Sect. 6.2). Also, we infer the lower limit on eCB-SMBH mass based on radial velocity with a brief summary of radial velocity measurement methods that could be employed (Sect. 6.3).
6.1 eCB-SMBH models
The fitted models to the AGN interferometric data need to be as straightforward as possible to avoid degeneracies (López-Gonzaga et al. 2016). Despite the fact that the actual brightness distribution of a CB-SMBH can be quite complex, the model given by (Dexter et al. 2020) can provide a first-order approximation of the shape and size and serve as a building block for more complex geometries (e.g. similar to the mid-infrared interferometry of AGNs; Jaffe et al. 2004; Davies et al. 2015; López-Gonzaga et al. 2016). The technique used by (Dexter et al. 2020) implies that periodicity associated with SMBHBs manifests in a Keplerian form. However, there are indicators that a certain category of non-Keplerian periodic SMBHBs can exist (see Susobhanan et al. 2020); for example, flaring, such as OJ 287 (Dey et al. 2018). It should be noted that the (Dexter et al. 2020) method is designed to represent the brightness distribution as simply as possible without assuming any physical link (power law or otherwise) to the unresolved spatial scales.
The interaction between CBD material and the CB-SMBH provides instructive instances of the relationship between processes occurring at different scales. Because of perturbations, matter in the CBD disc, for example, can traverse the gap in tiny streams, the eventual destinations of which depend on the precise angular momentum of the matter (d’Ascoli et al. 2018). One scenario is that the binary torques thrust falling matter back, causing it to shock against the CBD; deflection in these shocks creates gas with substantially lower angular momentum, which plunges into the binary zone (d’Ascoli et al. 2018). Accretion rates in the CB-SMBH system are another example of a phenomenon at a smaller scale that can influence the detection of these objects. Periodic mass accretion rates can cause an overdense lump to form in the inner circumbinary accretion disc (Farris et al. 2014), which can mimic the astrometry signal.
Furthermore, because the spectral energy distribution of a circumbinary disc has a steeper power-law curve, accretion changes will be more noticeable at shorter wavelengths (Graham et al. 2015). Another complexity of the binary–CBD interaction could be cycling transitions between type-1 and type-2 AGNs (Wang & Bon 2020). In this scenario, both black holes are forming mini-discs around themselves by striping gas from the inner edge of the circumbinary disc. The tidal torque caused by black holes on the mini-discs is strong enough to cause an exchange of angular momentum between the discs and the binary orbit. For retrograde mini-discs, tidal torque rapidly squeezes the tidal parts of the mini-discs into much smaller radii, causing higher accretion and short flares before the discs shift into type-2 AGNs. Prograde mini-discs gain angular momentum from the binary and rotate outward, rapidly transitioning from type-1 to type-2 AGNs.
Some specific occurrences in binary motion can cause the astrometric signal to be perturbed. In the case of an eccentric binary, with different masses of components, the less massive black hole may get closer to the circumbinary disc than the larger one, tidally splitting gas from its inner edge (Hayasaki et al. 2013) or exciting spiral density waves. Such disturbances can cause the centre of mass of the circumbinary disc to move and even produce an additional wobble in the secondary SMBH position, while time-varying, asymmetric light scattering by the disc can cause shifts in the photo-centre position. Likewise, while beamed jet emission is expected to be associated with an individual black hole in a binary system, it is possible to encounter a non-thermal contribution from a precessing jet (Wehrle et al. 2003).
The consequences of finite sampling on eccentric ( ) RV curves can be anticipated. The RV curves (see Eq. (42)) seem flatter across a larger fraction of a period as the orbits become more eccentric (the binary component spends more time near apoastron). Because there is a greater chance of sampling RV data in these flat places (then at the peak), the observed RV curve may appear to be consistent with a constant velocity (no binary companion) even when numerous periods are sampled; unless the peak in the RV curve is sampled as the binary component passes through periastron.
Also, the RV data can be influenced by ω for higher eccentricities (Eq. (42)). For the circular binaries, a small portion of the RV curve near maximum and minimum velocity has a flat slope and closely resembles a constant velocity (no binary), but a small portion near systemic velocity has a steep slope and would be easier to distinguish from a constant velocity, assuming a sufficient number of data points.
Astrometric data are similar to RV data in the sense that they are modified sine functions (e.g. see right panels in Fig. 3). However, astrometric data are presented in two mutually orthogonal directions. GRAVITY+ data collected near the pericentre, where the gradient varies quickly, will be better for eccentric binary model fitting than data collected near the apocentre. Because the binary component spends very little time near pericentre at high e and small orbital period, sparsely sampled data may miss this key region of the orbit.
6.2 Measurement of binary radial velocity as a shift of a spectral line centroid wavelength
While double-peaked broad lines are unlikely to be a useful diagnostic of SMBHBs (Popović et al. 2000, 2021; Shen & Loeb 2010; Popović 2012; Simic & Popović 2016), single-peaked broad-line offsets can be analysed (Eracleous et al. 2012). The probability of one component being active is substantially higher than the probability of both components being active at the same time, and the permitted binary parameter space is likewise larger than in the case of double-peaked broad lines (Liu et al. 2014). Monitoring campaigns are unlikely to be able to record several cycles of radial velocity curves from eCB-SMBH s. As a result, the signature of a binary will be monotonic (increase or decrease) or even flat in the observed radial velocity (see Runnoe et al. 2017, and their Figs. 3, 4, and 5), whilst the spectral lines will oscillate around their rest centroid wavelengths by Vrad/c.
The spectral line will be single-peaked if the secondary SMBH has dominant BLR radiation. Radial velocity can be expressed as a wavelength shift (Δλ) in a spectral line centroid wavelength λ as follows:
![${{\Delta \lambda } \over \lambda } = \sqrt {{{{R_{\rm{g}}}} \over {\tilde a}}} {1 \over {1 + q}}{{\sin i} \over {\sqrt {1 - {e^2}} }}[\cos (f + \omega ) + e\cos \omega ],$](/articles/aa/full_html/2022/07/aa43419-22/aa43419-22-eq117.png) (45)
(45)
where Rg = G(M1 + M2)/c2 denotes the gravitational radius of the binary and q = M2/M1. Even if the line profile is perturbed, the periodic wobbling will be imprinted and may still be observable, as shown above.
For observer inclination i = 90°, Δλ/λ reaches maximum value. Under such geometric constraints, the amplitude at 1000Rg will be approximately 10−0.5 less than the amplitude at 100Rg. If the term cos(f + ω) ~ 0 is valid, the amplitude will be multiplied by e cos ω; whereas, when cos( f+ ω) ~ 1 holds, the amplitude will be multiplied by a factor of (1 + e cos ω).
6.3 Measurement of the lower limit on binary mass from radial velocity
Until now, the velocity curves have been produced by a few long-term spectroscopic monitorings (Eracleous et al. 2012; Runnoe et al. 2015, 2017). (Runnoe et al. 2017) estimated the radial velocities of eCB-SMBH candidates with broad (single-peaked) Hα or Hβ lines and offsets of |ΔV| > 1000 km s−1 (Eracleous et al. 2012). It has also been shown that long-term radial velocity curves can be fitted to get constraints on orbital elements (Runnoe et al. 2017). We expect that the amplitude increases with binary total mass M1 + M2 (see e.g. Eq. (42)). Taking these constraints into consideration we can infer the lower limit on binary mass as
![${M_1} + {M_2} > {{{{(1000\,{\rm{km }}{{\rm{s}}^{ - 1}})}^2}\tilde a(1 - {e^2})} \over {G{{\sin }^2}i\,{{[\cos (f + \omega ) + e\cos \omega ]}^2}}}.$](/articles/aa/full_html/2022/07/aa43419-22/aa43419-22-eq118.png) (46)
(46)
or if the secondary is located in pericentre f= 0,
 (47)
(47)
Here, we provide a quick summary of the methodologies for radial velocity measurement that could be employed and eventually upgraded in the context of the concerns discussed above. Observational searches for close binary SMBHs using single broad-line spectroscopic spectra can be divided into several categories. The first type has targeted the quasars with broad lines located at their systemic velocities (that would be binaries in conjunction; Ju et al. 2013; Shen et al. 2013; Wang et al. 2017). The second type of survey targets sources with broad emission lines that are offset from the rest frame by thousands of kms−1 (Tsalmantza et al. 2011; Eracleous et al. 2012; Decarli et al. 2013; Liu et al. 2014). In most cases, two spectra taken years apart were used to measure or constrain the radial velocity fluctuations of binary candidates. These methods take into consideration the fact that, for example, the Hα narrow line (NL) is assumed to be at zero velocity. The velocity of a displaced peak of the Hα broad line (BL) is given by (Liu et al. 2016)
 (48)
(48)
7 Outlook for the future
We describe the potential of using interferometry to measure the angular position of the photo-centre at the emission line of eCB-SMBH s which could be useful for GRAVITY+ successors, and eCB-SMBH relevance for nano-Hz gravitational wave astronomy.
7.1 Centroid measurements
When employing spectro-astrometry to determine the origin of a certain emission line, the source position should be precisely mapped by taking into consideration the centroid of the continuum emission. The approach provided here for determining the angular position of the photo-centre at the emission line might be useful for GRAVITY+ successors. The intensity ratio of the continuum and emission line is used to weight the extent of the emission line region offset. Estimates of associated Keplerian velocities can be used to make a preliminary determination of whether the emission line originates near the secondary or from a CBD. The corresponding Keplerian velocities for CBD and the active secondary, respectively, are  and
and  where a2 is the barycentric distance of the secondary. Their straightforward comparison shows that the Keplerian velocity at CBD distance would have been around ~(2(1 + q)(1 + e))−0.5 times that of the active secondary component. However, if the full width at half maximum (FWHM) of observed emission line spectra is substantially larger than the expected Keplerian velocity associated with CBD, this indicates that the emission line is emerging from the disc surrounding the secondary.
If an emission line comes from the BLR region bound to the secondary, then our raw centroid measurements will include both emission line and the continuum centroids:
 (49)
(49)
where Fc and F1 are the continuum and line fluxes, respectively, and rc rblr are their corresponding locations. Notably, the centroid of the emission line (the first term) naturally vanishes for F1 → 0. Similarly, the distance between the centroid positions and secondary r2 is as follows:
 (50)
(50)
When the emission line flux is weak (F1 → 0), the centroid separation coincides with the continuum separation, that is, C − r2 ~ rc − r2. Otherwise, when the contribution of the emission line is substantial (F1 ≫ 0) and the time lag rBLR/rc ∝ τ is assumed, the individual term rc/rc can multiply the right side of Eq. (49), yielding the relation
 (51)
(51)
Because the discs can be brighter on one side than the other, temperature variations can arise along the inner and outer edges of the CBD and the SMBH disc (Roedig et al. 2014). However, the CBD can be hotter than the binary component disc by a factor of two, but not as hot as the innermost regions of the disc of the binary component (Generozov & Haiman 2014). However, if we relax the assumption that there is a sharp surface density cut-off at these boundaries, and assume that both the dust ring and CBD emit radiation at distances of rsub and rCBD, respectively, the expression for the photo-centre offset with regard to the secondary is as follows:
 (52)
(52)
The second term on the right side of Eq. (52) could be accounted for as in the case of the dust ring and CBD intersection, so that the centroid offset with regard to the secondary (i.e. C − r2) is augmented by the CBD contribution to total emission:
 (53)
(53)
If the inequality rCBD > rsub is true, the emission will be dominated by CBD, and the first term on the right side of Eq. (52) will vanish, implying that C ~ rCBD holds. In reality, the continuum emission could come through the emission line channel. In this case, the emission line centroid offset can be calculated by subtracting the continuum astrometric signal (the second term on the right side of Eq. (52)) from the observed signal (the term on the left side). This indicates that the photo-centre of a line will be displaced with respect to the photo-centre of the continuum. This shift reflects the fact that the photo-centre of continuum emission is shifted towards the CBD rather than the location of the secondary SMBH.
If the emission line comes from the disc-like BLR of the primary SMBH, but the continuum is emitted from the dust ring surrounding the secondary, we can express the raw measurement of the astrometric centroid as:
 (54)
(54)
where r1 and r2 are the positions of the primary and secondary SMBH,  , respectively, and
  are the positions of line and continuum emissions with respect to the primary and secondary. Another possibility is that the continuum emission can be extracted (by subtracting the second term on the right side of Eq. (54) from the total centroid), in which case we may also measure the centroid of the line (the first term on the left-hand side). The photo-centre of the emission line will be displaced from the axis defined by the primary and secondary SMBH positions; however the centroid of the continuum will be anchored to this axis. The photo-centre of an emission line will clearly be closer to the primary SMBH, which is supposed to be a line-emitting source. It is worth noting that Eq. (54) is written in a barycentric coordinate system, implying that the calculation procedure must include the barycentre as an unknown parameter.
However, if Eq. (54) is rewritten relative to the primary component as follows:
 (55)
(55)
then extracting the centroid of the line (the first term on the right side) becomes more difficult because, in addition to the photo-centre of the continuum (the second term), there is a third term related to the relative positions of the primary and secondary components. For example, if an emission line originates at 70 ld from the primary, the angular separation between the source and primary at the distance of 700 Mpc is ~20 μas, which can potentially be measured. To make it easier to assess these effects, we generated 13 artificial observations of the position of the three photo-centres (see Fig. 8). The red dots in represent the photo-centre of the emission line originating from the primary BLR, whereas the blue dots represent continuum photo-centres computed as centroids of dust rings bound to the secondary. We can observe that any triplet of the CB-SMBH barycentre (cross), emission line, and continuum photo-centre is non-collinear. As a result of non-collinearity, the relative position of the emission line centroid with respect to the continuum centroid will have an asymmetric ‘wavey’ shape (green dots).
Finally, photo-centre displacements determined by spectro-astrometry (C) are mathematically equivalent to phase (ϕ) determined by spectro-interferometry, and therefore the following relationship holds (Kraus et al. 2012):
 (56)
(56)
where σ is the FWHM. To demonstrate the above formula, consider an unresolved source  , where
  is the interferometric baseline vector, (α, δ) is the source position on the sky, and the phase is proportional to the photo-centre of the source projected onto the baseline (see Kovačević et al. 2020a, and references therein)
  . If the unresolved source is an AGN with two components of emission, the continuum emission from hot dust and the line emission from the BLR, the centroid of brightness of the system will be
 (57)
(57)
To calculate the differential phase, we subtract the continuum emission location (xc) from both sides of the preceding equation and multiply both sides by a factor of  as follows:
 (58)
(58)
Similar information can be obtained by using the Fourier transform to relate visibility and object brightness distribution, as well as Fourier transform properties. The Fourier phase stores deviation from centre-symmetry, which is one of these features (Whelan & Garcia 2008). For example, an angular shift of (α, δ) of the brightness distribution results in a visibility phase shift of ϕ = (b1, b2) · (α, δ)/λ (Whelan & Garcia 2008).
 |
Fig. 8 Simulation of photo-centres for continuum source (blue dots), emission line (red dots), and relative positions (green dots) of emission line photo-centre with respect to the continuum photo-centre. The binary system parameters are: M1 = 6 × 10⁷ M⊙, M2 = 4 × 10⁷ M⊙, e = 0.5, Ω1 = 180°, Ω2 = 100°, ω1 = 0.1°, ω2 = 180.1°, Rsub = 150 ld. The mean mutual distance of the components is 100 ld, the binary distance is ~700 Mpc, and the observer position angle is 40°. The emission line source is located in the BLR that is bound to the primary, whereas the continuum is defined as the barycentre of the dust ring arc that is bound to the secondary and split by the CBD. The cross represents the barycentre of the eCB-SMBH. |
7.2 eCB-SMBH in the context of gravitational waves
The anticipated eccentricities and eccentricity evolution for SMBHBs is discussed above (Sect. 1). How this relates to the signals that could be detected by pulsar timing arrays (PTAs) is briefly mentioned here. The expected timescales of AGN electromagnetic activity are much longer than those of their gravitational-wave channel. Mergers of black holes of similar masses could be one route for generating SMBHs found in quasars (Sanchis-Gual et al. 2021). In such case, the number of mergers between black holes with masses larger than 106 M⊙ would be between 1 and 10 (Sesana et al. 2009). Moreover, the number of galaxy mergers harbouring SMBHs could be a few, as data imply that this layout may be sufficient to explain the presence of SMBHs in quasars (Treister et al. 2010; Sanchis-Gual et al. 2021).
Gravitational radiation enters the low nano-Hz frequency band at sub-parsec length scales of CB-SMBH mergers, where it is strong enough to be detected by PTAs (Huerta et al. 2015). The International PTA (IPTA) consortium combines resources from multiple PTAs in order to identify nano-Hz GWs more quickly (Hobbs et al. 2010; Perera et al. 2019).
In theory, continuous GW detection using PTAs might offer orbital frequency and eccentricity measurements for the SMBH binary system (Burke-Spolaor et al. 2019). However, chirp mass and source distance cannot be determined directly until the orbital frequency evolution is detected during the PTA observations or the host galaxy of the continuous-wave source is identified (Burke-Spolaor et al. 2019). The North American Nanohertz Observatory for Gravitational Waves (NANOGrav) discovered an unusual low-frequency signal in data collected over a 13-year period (Arzoumanian et al. 2020). Under the assumption that the signal is genuinely astrophysical, the potential implications for the binary population of SMBHs were investigated by (Arzoumanian et al. 2020).
Even without invoking a third perturbing SMBH, stellar ‘loss cone scattering can increase binary eccentricity. This has been seen in some numerical simulations (Quinlan 1996; Sesana 2010), where it appears that equal-mass binaries (essential for PTAs) with extremely low initial eccentricity would either retain eccentricity or grow somewhat more eccentric. At any starting eccentricity, for binaries with extreme mass ratios, the eccentricity can evolve considerably, allowing high values to be maintained even into the PTA range (Sesana 2010; Roedig & Sesana 2012). (Nguyen et al. 2020b) found that the timescales to coalescence of spectroscopically selected, subparsec, circular binary candidates (Eracleous et al. 2012) are in the range of 104−109 yr, assuming that their orbital evolution in the PTA frequency band is driven by emission of gravitational waves. For PTA, the eccentricity e = 0.5 of CB-SMBHs is a threshold where the difference between eccentric and circular signal models is greatest (Taylor et al. 2016).
The orbital eccentricities of SMBHBs generating nano-Hz GWs can be rather large (Burke-Spolaor et al. 2019; Kelley et al. 2017b). Due to GW emission, such CB-SMBHs will coalesce in less than a Hubble time, depending on the orbital eccentricity (Peters & Mathews 1963; Peters 1964). In very-steep-profile galaxy mergers, SMBHBs with eccentricities of 0.4–0.6 and very short coalescence times of ~0.4 Gyr are found (Khan et al. 2011, 2012). The dependence on eccentricity of the coalescence time under gravitational wave emission Tcoal,GW in such mergers may scale as Tcoal,GW ~ (1 − e2)3.5 (Khan et al. 2012).
Theoretically, it is expected that eccentricity and the Keplerian orbital frequency of binaries co-evolve in a mass-independent way (Taylor et al. 2016). For example, if a binary starts with an eccentricity of e0 = 0.95 at an initial epoch and its orbital frequency is 1 nHz, it will reach e ~ 0.3 by the time its orbital frequency reaches 100 nHz (Burke-Spolaor et al. 2019). SMBHBs in eccentric orbits, as in the blazar OJ 287 (Dey et al. 2018), are promising nanoHz GW sources for the rapidly maturing PTA efforts (PTA McLaughlin 2013; Ransom et al. 2019), and (Susobhanan et al. 2020) devised an accurate and effective prescription for obtaining PTA signals caused by isolated SMBHBs inspiraling along general relativistic eccentric orbits.
8 Conclusion
In this work, we predict the performance of GRAVITY+ observational campaigns regarding the detection and analysis of eccentric binary SMBHs (eCB-SMBH s). It is commonly assumed that, to extract the signal from such objects, an observational timeline much longer than the orbital period of the object is needed. Because of the lack of data for eCB-SMBH s, we simulate two example cases of GRAVITY+ campaigns, each with a different total number of observations (N), a different time baseline (T), and different eCB-SMBH dynamical parameters. We show that when both GRAVITY+ accurate astro-metric and high-precision RV measurements are available, it is possible to detect the basic orbital parameters (M, P, e) of eCB-SMBH s with observational timelines that are considerably shorter than their orbital period. Based on current GRAVITY+ instrument information, we constructed mock astrometric and RV observations of eCB-SMBH s using the binary dynamical model (with constant, evolving, and fluctuating hot dust emission) as a representative of our current understanding of these eccentric SMBHBs. We then examined the detectability of eCB-SMBH s using the photo-centre offset caused by the intersection of the dust ring of the secondary SMBH and the CBD; the astrometric signal in the limit of binary eccentricity as a main factor of eCB-SMBH orbital shape; and Bayesian inference of eCB-SMBH basic orbital parameters (M, P, e) from GRAVITY+ mock campaigns covering 5% and 10% of a whole orbital period of the source.
Based on these considerations, we reach the following conclusions:
We estimate that the expected number of eCB-SMBH s within reach of GRAVITY+ inside a sphere of z < 0.3 is between approximately 4 and 13, assuming an arbitrary range of eccentric binary masses M, eccentricities (e), and periods (P). In addition to the above blind estimate, using the expected distributions of SMBHBs per log z, the quasar luminosity function, and assuming that ~10−3 is the fraction of CB-SMBHs in local bright AGNs, we obtain a similar prediction that GRAVITY+ could discover about 7 eCB-SMBH s.
Using the GRAVITY+ wavelength detection limit, we assess the detectability of evolving hot dust emission in a eCB-SMBH system. We compute the minimum value of flux ratios of NIR emission originating in the dust ring to the optical continuum as a function of dust ring dimension for different photo-centre displacements. At an astrometric observing wavelength of ~2 μm, we predict that GRAVITY and GRAVITY+ could detect non-static hot dust emission of an eCB-SMBH. However, there may be a band of parameter space where some dust emission goes undetected.
We find analytic expressions for the S/N for astromet-ric observations in the limit of single-epoch astrometric error, and eCB-SMBH parameters: mass ratios, periodicities (semi-major axes), eccentricity, the arc of the observed binary orbit, and observation loss. The width of pericentre passage is ~(1 − e)2P, implying that the enhanced velocity amplitude and acceleration near the periastron boost detectability in long-period objects, whereas eccentricity makes detection more challenging at short periods, because uneven sampling frequently results in poor phase coverage during rapid pericentre passage. When the pericentre width observational coverage is ~10%, we predict that eCB-SMBH s with a binary mass ratio of q = 0.1 at a mutual distance of 0.01 pc would be impossible to detect. However, we demonstrate that the S/N of eCB-SMBH s and their detectability increase with increasing q and with better observational coverage of the pericentre passage. Also, we mapped the expected detection distance of eCB-SMBH s for different mass ratios and semi-major axes across V magnitudes.
We adopt the Bayesian inference approach to extract eCB-SMBH signals from GRAVITY+ simulated campaigns, because resolving the eCB-SMBH orbits is a non-linear problem. The results of the tests of orbital solutions indicate that, with observational timelines covering at least ~0.1P, models with evolving dust are more likely to identify the period, eccentricity, and the total mass of an eCB-SMBH. When the observational coverage is low (~0.05P), the quality of the detected period decreases, resulting in a relative discrepancy between the detected period and the true value of around 30 percent, whereas other parameters are unaffected. In general, Bayesian inference can improve the time efficiency of the GRAVITY+ observations.
Specifically, we describe a method for measuring the angular position of the photo-centre at the emission line of an eCB-SMBH, which we expect will be useful for GRAVITY+ successors.
Additionally, we analysed the effects of various eccentric binary mass ratios on signal and show that for incomplete binary orbits (observational coverage of 5%–10%), Bayesian inference, which joins multiple observational techniques, generates more information on the system, either in a narrower posterior parameter density, or in the potential if we include additional parameters in the model We addressed how to independently test the eccentricity of the eCB-SMBH based on radial velocity and acceleration data, and also provide a few possibilities that may be met in GRAVITY+ observations that could imitate detection of an eCB-SMBH. Finally, we propose that the SARM technique (Wang et al. 2020b; GRAVITY Collaboration 2021a; Li et al. 2022) can assist GRAVITY+ in binary detection, either as a follow-up or as an independent binary detection tool.
Acknowledgements
A.K. acknowledges the funding provided by the Faculty of Mathematics University of Belgrade (the Ministry of Education, science and technological development of Republic Serbia contract 451-03-68/2022-14/200104). A.K. and L.Č.P. thank the support by Chinese Academy of Sciences President’s International Fellowship Initiative (PIFI) for visiting scientist. J.M.W. and Y.Y.S. thank the support from the National Key R&D Program of China 2016YFA0400701, NSFC(-11991050, -11991054, -11833008). L.Č.P acknowledges the funding provided by Astronomical Observatory (the Ministry of Education, science and technological development of Republic Serbia contract 451-03-68/2022-14/ 200002).
Appendix A Astrometric offset for the evolving hot-dust model in the context of the eCB-SMBH system
(Dexter et al. 2020) demonstrated that the astrometric offset for the geometric evolving continuum model can be connected to the centroid of the intersection of two circles. Using the generic geometrical considerations discussed below, we demonstrate how this notion can be connected to the configuration of the eCB-SMBH.
Let parametric curve C describe an arc of a ring with constant density g(x,y,z) and cross-sectional area A(x(t),y(t),z(t)) as shown below:
 (A.1)
(A.1)
 (A.2)
(A.2)
 (A.3)
(A.3)
Because density and area are constant along arc L, the centroid and centre of mass coincide, resulting in
 (A.4)
(A.4)
where dm = g(r)A(r)dL denotes the mass of an infinitesimal element in a ring. We can rewrite the centroid equation as follows, assuming A = 1 for ease of calculation:
 (A.5)
(A.5)
Finally, the centroid of an arc of a curve r(t) within the finite parameter interval t ∈ [a, b] can be represented as follows:
 (A.6)
(A.6)
Depending on the curve parametrisation, this general equation will take on multiple forms. For example, defining a circular arc in polar coordinates yields the arc centroid in its most compact form. Here, we assume that the x-axis is the axis of the symmetry of the arc, and that the arc has radius r, and a central angle 2α. Taking into account that the differential element of arc length is dL = rdθ, the length of the arc is L = 2αr, and integration limits are (−α, α), we may calculate the centroid  (see also Dexter et al. 2020). We now present the astrometric offset of the evolving hot-dust emission model in the general concept of the eCB-SMBH system. Let M1 and M2 be the SMBHs loci, points P1 and P2 be the intersections of the CBD and dust ring bound to the secondary, and P3 be the intersection of the line M1M2 and dust ring outside of the CBD. The barycentre of that arc of the dust ring is provided by:
 (A.7)
(A.7)

and Lsub is the orbital angular momentum of the dust sublimation surface.12 Because both the dust ring and the CBD are circular, the dust ring arc barycentre C is placed on the line M1M2 as a bisector of angle  , at any point of the eCB-SMBH orbit. The developed formula is applicable to both eccentric and circular CB-SMBH configurations. Because of the features of the sinc function, there is no difference in cen-troid position whether the motion of the dust is clockwise or anticlockwise, implying that it is independent of Lsub orientation.
Appendix B Approximation of fluctuating hot dust continuum offset
We now establish formulations for astronomical offset, as indicated in the third branch of Equation 38, for fluctuating the dust continuum model. Suppose that only continuum emission from the sublimation radius is taken into account, ignoring CBD. In that case, the continuum flux offset (relative to the secondary or even barycentre of the CB-SMBH) will correspond to the dust ring position. There are some empirical inferences regarding the dimension of the hot dust ring. For example, (Koshida et al. 2014) discovered that the dust reverberation radius of a sample of 17 Seyfert galaxies is four to five times greater than their BLR radius and typically a factor of two lower than the equivalent interferometric radius. Additionally, the BLR radius determined by reverberation mapping is less than that determined by NIR interferometry (see Mandal et al. 2018, and references therein). However, some exceptions are found in the literature. For example, the dust radii of NGC 4151 (Bentz et al. 2006; Shapovalova et al. 2008), Mrk 335 (Du et al. 2014), and NGC 4593 (Barth et al. 2013) are approximately ten times larger than the respective BLR radii (Koshida et al. 2014). These considerable differences in dust radius and BLR radius indicate fluctuating dust emission (Schnülle et al. 2015), suggesting that the sublimation radius expands simultaneously with bright UV/optical and vice versa. It is crucial to note that there may be deviations from this simple scenario suggesting that the inner dust torus did not reach an equilibrium state immediately following the UV/optical flux change (Koshida et al. 2014).
For the sake of simplicity and generality, we assume that luminosity of an AGN, as a sinusoidally pulsating source of emission, is  with average luminosity
  (D’Orazio & Haiman 2017), and that Rsub is a dimension of dust ring. The dust time lag τsub then scales with luminosity L as Rsub ∝ τsub/c ∝ L0.5(Hönig 2014). A simple algebraic manipulation of previous equations results in the formulation of dust radius fluctuation as follows:
 (B.1)
(B.1)
where the average dust ring offset is  , the amplitude is A, and the period of the orbital motion of eCB-SMBH is P. We suppose that the amplitude scales as
  where
where  , as with a sinusoidally pulsating source of emission (D’Orazio & Haiman 2017).
References
- Agarwal, B., Khochfar, S., Johnson, J. L., et al. 2012, MNRAS, 425, 2854 [NASA ADS] [CrossRef] [Google Scholar]
- Aitken, R. G. 1964, The Binary Stars [Google Scholar]
- Almeyda, T., Robinson, A., Richmond, M., Vazquez, B., & Nikutta, R. 2017, ApJ, 843, 3 [NASA ADS] [CrossRef] [Google Scholar]
- Aly, H., Gonzalez, J.-F., Nealon, R., et al. 2021, MNRAS, 508, 2743 [NASA ADS] [CrossRef] [Google Scholar]
- Armitage, P. J., & Natarajan, P. 2005, ApJ, 634, 921 [NASA ADS] [CrossRef] [Google Scholar]
- Artymowicz, P., & Lubow, S. H. 1994, ApJ, 421, 651 [Google Scholar]
- Arzoumanian, Z., Baker, P. T., Blumer, H., et al. 2020, ApJ, 905, L34 [NASA ADS] [CrossRef] [Google Scholar]
- Bao, D.-W., Brotherton, M., Du, P. E. A., et al. 2022, ApJS, submitted [Google Scholar]
- Barth, A. J., Pancoast, A., Bennert, V. N., et al. 2013, ApJ, 769, 128 [NASA ADS] [CrossRef] [Google Scholar]
- Barth, A. J., Bennert, V. N., Canalizo, G., et al. 2015, ApJS, 217, 26 [NASA ADS] [CrossRef] [Google Scholar]
- Begelman, M. C., Blandford, R. D., & Rees, M. J. 1980, Nature, 287, 307 [Google Scholar]
- Bentz, M. C., Denney, K. D., Cackett, E. M., et al. 2006, ApJ, 651, 775 [NASA ADS] [CrossRef] [Google Scholar]
- Bentz, M. C., Denney, K. D., Grier, C. J., et al. 2013, ApJ, 767, 149 [Google Scholar]
- Berentzen, I., Preto, M., Berczik, P., Merritt, D., & Spurzem, R. 2009, ApJ, 695, 455 [NASA ADS] [CrossRef] [Google Scholar]
- Bogdanovic, T., Coleman Miller, M., & Brecha, L. 2022, Liv. Rev. Rel., 25, 3 [NASA ADS] [CrossRef] [Google Scholar]
- Brotherton, M. S., Du, P., Xiao, M., et al. 2020, ApJ, 905, 77 [NASA ADS] [CrossRef] [Google Scholar]
- Burke-Spolaor, S., Taylor, S. R., Charisi, M., et al. 2019, A&ARv, 27, 5 [Google Scholar]
- Cackett, E. M., & Horne, K. 2006, MNRAS, 365, 1180 [Google Scholar]
- Callegari, S., Kazantzidis, S., Mayer, L., et al. 2011, ApJ, 729, 85 [NASA ADS] [CrossRef] [Google Scholar]
- Casertano, S., Lattanzi, M. G., Perryman, M. A. C., & Spagna, A. 1996, Ap&SS, 241, 89 [Google Scholar]
- Charisi, M., Taylor, S. R., Runnoe, J., Bogdanovic, T., & Trump, J. R. 2022, MNRAS, 510, 5929 [NASA ADS] [CrossRef] [Google Scholar]
- Cuadra, J., Armitage, P. J., Alexander, R. D., & Begelman, M. C. 2009, MNRAS, 393, 1423 [Google Scholar]
- Cumming, A. 2004, MNRAS, 354, 1165 [Google Scholar]
- d’Ascoli, S., Noble, S. C., Bowen, D. B., et al. 2018, ApJ, 865, 140 [CrossRef] [Google Scholar]
- Davies, R. I., Burtscher, L., Rosario, D., et al. 2015, ApJ, 806, 127 [Google Scholar]
- Decarli, R., Dotti, M., Fumagalli, M., et al. 2013, MNRAS, 433, 1492 [Google Scholar]
- De Paolis, F., Ingrosso, G., & Nucita, A. A. 2004, A&A, 426, 379 [NASA ADS] [CrossRef] [EDP Sciences] [Google Scholar]
- De Rosa, A., Vignali, C., Bogdanovic, T., et al. 2019, New A Rev., 86, 101525 [NASA ADS] [CrossRef] [Google Scholar]
- Dexter, J., Lutz, D., Shimizu, T. T., et al. 2020, ApJ, 905, 33 [NASA ADS] [CrossRef] [Google Scholar]
- Dey, L., Valtonen, M. J., Gopakumar, A., et al. 2018, ApJ, 866, 11 [NASA ADS] [CrossRef] [Google Scholar]
- D’Orazio, D. J., & Haiman, Z. 2017, MNRAS, 470, 1198 [CrossRef] [Google Scholar]
- D’Orazio, D. J., & Loeb, A. 2019, Phys. Rev. D, 100, 103016 [CrossRef] [Google Scholar]
- D’Orazio, D. J., Haiman, Z., & Schiminovich, D. 2015, Nature, 525, 351 [Google Scholar]
- Dotti, M., Sesana, A., & Decarli, R. 2012, Adv. Astron., 2012, 940568 [CrossRef] [Google Scholar]
- Du, P., Hu, C., Lu, K.-X., et al. 2014, ApJ, 782, 45 [NASA ADS] [CrossRef] [Google Scholar]
- Du, P., Brotherton, M. S., Wang, K., et al. 2018, ApJ, 869, 142 [CrossRef] [Google Scholar]
- Eracleous, M., Boroson, T. A., Halpern, J. P., & Liu, J. 2012, ApJS, 201, 23 [Google Scholar]
- Farris, B. D., Duffell, P., MacFadyen, A. I., & Haiman, Z. 2014, ApJ, 783, 134 [NASA ADS] [CrossRef] [Google Scholar]
- Ford, E. B. 2006, ApJ, 642, 505 [Google Scholar]
- Generozov, A., & Haiman, Z. 2014, MNRAS, 443, L64 [NASA ADS] [CrossRef] [Google Scholar]
- Gergely, L. Á., & Biermann, P. L. 2008, in Journal of Physics Conference Series, 122, 012040 [NASA ADS] [CrossRef] [Google Scholar]
- Gezari, S., Halpern, J. P., & Eracleous, M. 2007, ApJS, 169, 167 [CrossRef] [Google Scholar]
- Graham, M. J., Djorgovski, S. G., Stern, D., et al. 2015, Nature, 518, 74 [Google Scholar]
- Gravity Collaboration (Abuter, R., et al.) 2017, A&A, 602, A94 [NASA ADS] [CrossRef] [EDP Sciences] [Google Scholar]
- Gravity Collaboration (Sturm, E., et al.) 2018, Nature, 563, 657 [Google Scholar]
- Gravity Collaboration (Dexter, J., et al.) 2020a, A&A, 635, A92 [NASA ADS] [CrossRef] [EDP Sciences] [Google Scholar]
- Gravity Collaboration (Pfuhl, O., et al.) 2020b, A&A, 634, A1 [NASA ADS] [CrossRef] [EDP Sciences] [Google Scholar]
- Gravity Collaboration (Amorim, A., et al.) 2021a, A&A, 654, A85 [NASA ADS] [CrossRef] [EDP Sciences] [Google Scholar]
- Gravity Collaboration (Amorim, A., et al.) 2021b, A&A, 648, A117 [NASA ADS] [CrossRef] [EDP Sciences] [Google Scholar]
- Gravity+ Collaboration (Eisenhauer, F., et al.) 2022, https://mpe.mpg.de/7480772/GRAVITYplus_WhitePaper.pdf [Google Scholar]
- Gültekin, K., & Miller, J. M. 2012, ApJ, 761, 90 [CrossRef] [Google Scholar]
- Gültekin, K., Richstone, D. O., Gebhardt, K., et al. 2009, ApJ, 695, 1577 [CrossRef] [Google Scholar]
- Haguenauer, P., Abuter, R., Andolfato, L., et al. 2012, SPIE Conf. Ser., 8445, 84450D [NASA ADS] [Google Scholar]
- Halbwachs, J. L., Mayor, M., Udry, S., & Arenou, F. 2003, A&A, 397, 159 [NASA ADS] [CrossRef] [EDP Sciences] [Google Scholar]
- Hastings, W. K. 1970, Biometrika, 57, 97 [Google Scholar]
- Hayasaki, K., Mineshige, S., & Sudou, H. 2007, PASJ, 59, 427 [NASA ADS] [Google Scholar]
- Hayasaki, K., Saito, H., & Mineshige, S. 2013, PASJ, 65, 86 [NASA ADS] [Google Scholar]
- Hayasaki, K., Sohn, B. W., Okazaki, A. T., et al. 2015, J. Cosmology Astropart. Phys., 2015, 005 [CrossRef] [Google Scholar]
- Hobbs, G., Archibald, A., Arzoumanian, Z., et al. 2010, Class. Quant. Grav., 27, 084013 [NASA ADS] [CrossRef] [Google Scholar]
- Hönig, S. F. 2014, ApJ, 784, L4 [CrossRef] [Google Scholar]
- Hönig, S. F., & Kishimoto, M. 2011, A&A, 534, A121 [NASA ADS] [CrossRef] [EDP Sciences] [Google Scholar]
- Hopkins, P. F., Richards, G. T., & Hernquist, L. 2007, ApJ, 654, 731 [Google Scholar]
- Huerta, E. A., McWilliams, S. T., Gair, J. R., & Taylor, S. R. 2015, Phys. Rev. D, 92, 063010 [NASA ADS] [CrossRef] [Google Scholar]
- Jaffe, W., Meisenheimer, K., Röttgering, H. J. A., et al. 2004, Nature, 429, 47 [NASA ADS] [CrossRef] [Google Scholar]
- Ji, X., Lu, Y., Ge, J., Yan, C., & Song, Z. 2021, ApJ, 910, 101 [NASA ADS] [CrossRef] [Google Scholar]
- Ju, W., Greene, J. E., Rafikov, R. R., Bickerton, S. J., & Badenes, C. 2013, ApJ, 777, 44 [Google Scholar]
- Kaipio, J., & Somersalo, E. 2005, Statistical and Computational Inverse Problems (Dordrecht: Springer) [Google Scholar]
- Kelly, B. C., Vestergaard, M., & Fan, X. 2009, ApJ, 692, 1388 [NASA ADS] [CrossRef] [Google Scholar]
- Kelley, L. Z., Blecha, L., & Hernquist, L. 2017a, MNRAS, 464, 3131 [NASA ADS] [CrossRef] [Google Scholar]
- Kelley, L. Z., Blecha, L., Hernquist, L., Sesana, A., & Taylor, S. R. 2017b, MNRAS, 471, 4508 [NASA ADS] [CrossRef] [Google Scholar]
- Khan, F. M., Just, A., & Merritt, D. 2011, ApJ, 732, 89 [Google Scholar]
- Khan, F. M., Preto, M., Berczik, P., et al. 2012, ApJ, 749, 147 [Google Scholar]
- Khan, F. M., Holley-Bockelmann, K., Berczik, P., & Just, A. 2013, ApJ, 773, 100 [Google Scholar]
- Kishimoto, M., Hönig, S. F., Antonucci, R., et al. 2011, A&A, 536, A78 [CrossRef] [EDP Sciences] [Google Scholar]
- Kishimoto, M., Hönig, S. F., Antonucci, R., et al. 2013, ApJ, 775, L36 [NASA ADS] [CrossRef] [Google Scholar]
- Kiyaeva, O. V., & Zhuchkov, R. Y. 2017, Open Astron., 26, 64 [NASA ADS] [CrossRef] [Google Scholar]
- Kormendy, J., & Ho, L. C. 2013, ARA&A, 51, 511 [Google Scholar]
- Koshida, S., Yoshii, Y., Kobayashi, Y., et al. 2009, ApJ, 700, L109 [NASA ADS] [CrossRef] [Google Scholar]
- Koshida, S., Minezaki, T., Yoshii, Y., et al. 2014, ApJ, 788, 159 [Google Scholar]
- Kovacevic, A. B., Songsheng, Y.-Y., Wang, J.-M., & Popović, L. C. 2020a, A&A, 644, A88 [NASA ADS] [CrossRef] [EDP Sciences] [Google Scholar]
- Kovacevic, A. B., Wang, J.-M., & Popović, L. C. 2020b, A&A, 635, A1 [NASA ADS] [CrossRef] [EDP Sciences] [Google Scholar]
- Kraus, S., Calvet, N., Hartmann, L., et al. 2012, ApJ, 752, 11 [NASA ADS] [CrossRef] [Google Scholar]
- Lacour, S., Eisenhauer, F., Gillessen, S., et al. 2014, A&A, 567, A75 [NASA ADS] [CrossRef] [EDP Sciences] [Google Scholar]
- Landt, H., Elvis, M., Ward, M. J., et al. 2011, MNRAS, 414, 218 [NASA ADS] [CrossRef] [Google Scholar]
- Le Bouquin, J. B., Beust, H., Duvert, G., et al. 2013, A&A, 551, A121 [NASA ADS] [CrossRef] [EDP Sciences] [Google Scholar]
- Lewis, K. T., Eracleous, M., & Storchi-Bergmann, T. 2010, ApJS, 187, 416 [NASA ADS] [CrossRef] [Google Scholar]
- Li, Y.-R., Wang, J.-M., Ho, L. C., et al. 2016, ApJ, 822, 4 [NASA ADS] [CrossRef] [Google Scholar]
- Li, Y.-R., Wang, J.-M., Songsheng, Y.-Y., et al. 2022, ApJ, 927, 58 [NASA ADS] [CrossRef] [Google Scholar]
- Liu, W. 2021, MNRAS, 504, 1473 [NASA ADS] [CrossRef] [Google Scholar]
- Liu, X., Shen, Y., Bian, F., Loeb, A., & Tremaine, S. 2014, ApJ, 789, 140 [Google Scholar]
- Liu, J., Eracleous, M., & Halpern, J. P. 2016, ApJ, 817, 42 [NASA ADS] [CrossRef] [Google Scholar]
- López-Gonzaga, N., Burtscher, L., Tristram, K. R. W., Meisenheimer, K., & Schartmann, M. 2016, A&A, 591, A47 [NASA ADS] [CrossRef] [EDP Sciences] [Google Scholar]
- Lucy, L. B. 2014, A&A, 563, A126 [NASA ADS] [CrossRef] [EDP Sciences] [Google Scholar]
- MacFadyen, A. I., & Milosavljević, M. 2008, ApJ, 672, 83 [Google Scholar]
- Mandal, A. K., Rakshit, S., Kurian, K. S., et al. 2018, MNRAS, 475, 5330 [NASA ADS] [CrossRef] [Google Scholar]
- McKernan, B., & Ford, K. E. S. 2015, MNRAS, 452, L1 [NASA ADS] [CrossRef] [Google Scholar]
- McLaughlin, M. A. 2013, Class. Quant. Grav., 30, 224008 [NASA ADS] [CrossRef] [Google Scholar]
- Mede, K., & Brandt, T. D. 2017, AJ, 153, 135 [NASA ADS] [CrossRef] [Google Scholar]
- Metropolis, N., Rosenbluth, A. W., Rosenbluth, M. N., Teller, A. H., & Teller, E. 1953, J. Chem. Phys., 21, 1087 [Google Scholar]
- Milosavljević, M., & Merritt, D. 2001, ApJ, 563, 34 [Google Scholar]
- Minezaki, T., Yoshii, Y., Kobayashi, Y., et al. 2004, ApJ, 600, L35 [NASA ADS] [CrossRef] [Google Scholar]
- Moulton, F. R. 1970, An introduction to celestial mechanics [Google Scholar]
- Muñoz, D. J., Miranda, R., & Lai, D. 2019, ApJ, 871, 84 [CrossRef] [Google Scholar]
- Newman, J. A., Eracleous, M., Filippenko, A. V., & Halpern, J. P. 1997, ApJ, 485, 570 [NASA ADS] [CrossRef] [Google Scholar]
- Nguyen, K., & Bogdanović, T., 2016, ApJ, 828, 68 [Google Scholar]
- Nguyen, K., Bogdanović, T., Runnoe, J. C., et al. 2019, ApJ, 870, 16 [Google Scholar]
- Nguyen, K., Bogdanović, T., Runnoe, J. C., et al. 2020a, ApJ, 894, 105 [NASA ADS] [CrossRef] [Google Scholar]
- Nguyen, K., Bogdanović, T., Runnoe, J. C., et al. 2020b, ApJ, 900, L42 [NASA ADS] [CrossRef] [Google Scholar]
- Perera, B. B. P., DeCesar, M. E., Demorest, P. B., et al. 2019, MNRAS, 490, 4666 [Google Scholar]
- Peters, P. C. 1964, Phys. Rev., 136, B1224 [NASA ADS] [CrossRef] [Google Scholar]
- Peters, P. C., & Mathews, J. 1963, Phys. Rev., 131, 435 [Google Scholar]
- Planck Collaboration VI. 2020, A&A, 641, A6 [NASA ADS] [CrossRef] [EDP Sciences] [Google Scholar]
- Popović, L. Č., 2012, New A Rev., 56, 74 [CrossRef] [Google Scholar]
- Popović, L. Č., Shapovalova, A. I., Ilić, D., et al. 2014, A&A, 572, A66 [NASA ADS] [CrossRef] [EDP Sciences] [Google Scholar]
- Popović, L. Č., Mediavilla, E. G., & Pavlović, R. 2000, Serb. Astron. J., 162, 1 [CrossRef] [Google Scholar]
- Popović, L. Č., Simić, S., Kovaćević, A., & Ilić, D. 2021, MNRAS, 505, 5192 [CrossRef] [Google Scholar]
- Pozo Nuñez, F., Ramolla, M., Westhues, C., et al. 2015, A&A, 576, A73 [NASA ADS] [CrossRef] [EDP Sciences] [Google Scholar]
- Price-Whelan, A. M., Hogg, D. W., Foreman-Mackey, D., & Rix, H.-W. 2017, ApJ, 837, 20 [NASA ADS] [CrossRef] [Google Scholar]
- Quinlan, G. D. 1996, New A, 1, 35 [NASA ADS] [CrossRef] [Google Scholar]
- Quinlan, G. D., & Hernquist, L. 1997, New A, 2, 533 [NASA ADS] [CrossRef] [Google Scholar]
- Ransom, S., Brazier, A., Chatterjee, S., et al. 2019, Bull. AAS, 51, https://baas.aas.org/pub/2020n7i195 [Google Scholar]
- Rauch, K. P., & Tremaine, S. 1996, New A, 1, 149 [NASA ADS] [CrossRef] [Google Scholar]
- Reffert, S., & Quirrenbach, A. 2011, A&A, 527, A140 [NASA ADS] [CrossRef] [EDP Sciences] [Google Scholar]
- Robertson, B., Bullock, J. S., Cox, T. J., et al. 2006, ApJ, 645, 986 [NASA ADS] [CrossRef] [Google Scholar]
- Roedig, C., & Sesana, A. 2012, in Journal of Physics Conference Series, 363, 012035 [NASA ADS] [CrossRef] [Google Scholar]
- Roedig, C., & Sesana, A. 2014, MNRAS, 439, 3476 [Google Scholar]
- Roedig, C., Dotti, M., Sesana, A., Cuadra, J., & Colpi, M. 2011, MNRAS, 415, 3033 [NASA ADS] [CrossRef] [Google Scholar]
- Roedig, C., Krolik, J. H., & Miller, M. C. 2014, ApJ, 785, 115 [NASA ADS] [CrossRef] [Google Scholar]
- Runnoe, J. C., Eracleous, M., Mathes, G., et al. 2015, ApJS, 221, 7 [NASA ADS] [CrossRef] [Google Scholar]
- Runnoe, J. C., Eracleous, M., Pennell, A., et al. 2017, MNRAS, 468, 1683 [Google Scholar]
- Saade, M. L., Stern, D., Brightman, M., et al. 2020, ApJ, 900, 148 [NASA ADS] [CrossRef] [Google Scholar]
- Sakata, Y., Minezaki, T., Yoshii, Y., et al. 2010, ApJ, 711, 461 [NASA ADS] [CrossRef] [Google Scholar]
- Salvatier, J., Wiecki, T., & Fonnesbeck, C. 2016, Probabilistic programming in Python using PyMC3 [Google Scholar]
- Sanchis-Gual, N., Quilis, V., & Font, J. A. 2021, Phys. Rev. D, 104, 024027 [NASA ADS] [CrossRef] [Google Scholar]
- Schnülle, K., Pott, J. U., Rix, H. W., et al. 2015, A&A, 578, A57 [NASA ADS] [CrossRef] [EDP Sciences] [Google Scholar]
- Sesana, A. 2010, ApJ, 719, 851 [Google Scholar]
- Sesana, A., Volonteri, M., & Haardt, F. 2009, Class. Quant. Grav., 26, 094033 [NASA ADS] [CrossRef] [Google Scholar]
- Sesana, A., Roedig, C., Reynolds, M. T., & Dotti, M. 2012, MNRAS, 420, 860 [NASA ADS] [CrossRef] [Google Scholar]
- Shapovalova, A. I., Popović, L. Č., Collin, S., et al. 2008, A&A, 486, 99 [NASA ADS] [CrossRef] [EDP Sciences] [Google Scholar]
- Shen, Y., & Loeb, A. 2010, ApJ, 725, 249 [NASA ADS] [CrossRef] [Google Scholar]
- Shen, Y., Liu, X., Loeb, A., & Tremaine, S. 2013, ApJ, 775, 49 [Google Scholar]
- Simić, S., & Popović, L. Č. 2016, Ap&SS, 361, 59 [CrossRef] [Google Scholar]
- Songsheng, Y.-Y., Wang, J.-M., & Li, Y.-R. 2019a, ApJ, 883, 184 [NASA ADS] [CrossRef] [Google Scholar]
- Songsheng, Y.-Y., Wang, J.-M., Li, Y.-R., & Du, P. 2019b, ApJ, 881, 140 [NASA ADS] [CrossRef] [Google Scholar]
- Songsheng, Y.-Y., Xiao, M., Wang, J.-M., & Ho, L. C. 2020, ApJS, 247, 3 [NASA ADS] [CrossRef] [Google Scholar]
- Suganuma, M., Yoshii, Y., Kobayashi, Y., et al. 2006, ApJ, 639, 46 [NASA ADS] [CrossRef] [Google Scholar]
- Susobhanan, A., Gopakumar, A., Hobbs, G., & Taylor, S. R. 2020, Phys. Rev. D, 101, 043022 [NASA ADS] [CrossRef] [Google Scholar]
- Tang, Y., Haiman, Z., & MacFadyen, A. 2018, MNRAS, 476, 2249 [NASA ADS] [CrossRef] [Google Scholar]
- Taylor, S. R., Huerta, E. A., Gair, J. R., & McWilliams, S. T. 2016, ApJ, 817, 70 [NASA ADS] [CrossRef] [Google Scholar]
- Tiwari, S., & Gopakumar, A. 2020, Phys. Rev. D, 102, 084042 [NASA ADS] [CrossRef] [Google Scholar]
- Tomita, H., Yoshii, Y., Kobayashi, Y., et al. 2006, ApJ, 652, L13 [NASA ADS] [CrossRef] [Google Scholar]
- Treister, E., Natarajan, P., Sanders, D. B., et al. 2010, Science, 328, 600 [NASA ADS] [CrossRef] [Google Scholar]
- Tsalmantza, P., Decarli, R., Dotti, M., & Hogg, D. W. 2011, ApJ, 738, 20 [Google Scholar]
- Tuomi, M., Kotiranta, S., & Kaasalainen, M. 2009, A&A, 494, 769 [NASA ADS] [CrossRef] [EDP Sciences] [Google Scholar]
- Volonteri, M., Miller, J. M., & Dotti, M. 2009, ApJ, 703, L86 [NASA ADS] [CrossRef] [Google Scholar]
- Wang, J.-M., & Bon, E. 2020, A&A, 643, L9 [NASA ADS] [CrossRef] [EDP Sciences] [Google Scholar]
- Wang, J. M., & Li, Y. 2011, ApJ, 742, L12 [NASA ADS] [CrossRef] [Google Scholar]
- Wang, J.-M., & Li, Y.-R. 2020, Res. Astron. Astrophys., 20, 160 [CrossRef] [Google Scholar]
- Wang, L., Greene, J. E., Ju, W., et al. 2017, ApJ, 834, 129 [Google Scholar]
- Wang, J.-M., Songsheng, Y.-Y., Li, Y.-R., & Yu, Z. 2018, ApJ, 862, 171 [NASA ADS] [CrossRef] [Google Scholar]
- Wang, J.-M., Songsheng, Y.-Y., Li, Y.-R., Du, P., & Yu, Z. 2020a, MNRAS, 497, 1020 [NASA ADS] [CrossRef] [Google Scholar]
- Wang, J.-M., Songsheng, Y.-Y., Li, Y.-R., Du, P., & Zhang, Z.-X. 2020b, Nat. Astron., 4, 517 [NASA ADS] [CrossRef] [Google Scholar]
- Wehrle, A. E., Unwin, S. C., Jones, D. L., Meier, D. L., & Piner, B. G. 2003, SPIE Conf. Ser., 4852, 152 [NASA ADS] [Google Scholar]
- Weigelt, G., Wittkowski, M., Balega, Y. Y., et al. 2004, A&A, 425, 77 [NASA ADS] [CrossRef] [EDP Sciences] [Google Scholar]
- Wen, L. 2003, ApJ, 598, 419 [NASA ADS] [CrossRef] [Google Scholar]
- Whelan, E., & Garcia, P. 2008, in Jets from Young Stars II, eds. F. Bacciotti, L. Testi, & E. Whelan, 742, 123 [NASA ADS] [CrossRef] [Google Scholar]
- Wright, J. T., & Howard, A. W. 2009, ApJS, 182, 205 [Google Scholar]
- Yoshii, Y., Kobayashi, Y., Minezaki, T., Koshida, S., & Peterson, B. A. 2014, ApJ, 784, L11 [NASA ADS] [CrossRef] [Google Scholar]
On that timescale, the eccentricity reduces as well (Bogdanović et al. 2022). Because the velocity of components is greater at the pericentre, binaries emit more gravitational waves while in pericentre than when in apocentre. Due to this asymmetric emission of gravitational radiation, the orbit of a binary changes from elliptical to circular (Bogdanović et al. 2022).
Also it is possible to set Rcbd ~ 2.75a (see e.g. Hayasaki et al. 2007).
In analogy with the misalignment between dust and gas rings in cir-cumbinary planetary discs due to differences in their precession profiles (Aly et al. 2021).
(Landt et al. 2011) show that the continuum around the rest frame 1 μm comprises mainly two emission components, a hot-dust blackbody and an accretion disc, where the latter is dominant. For objects at z ~ 0.95, such a continuum would translate into the lower end of GRAVITY detection limits (1.95–2.45)μm.
(Dexter et al. 2020) generate mock astrometric data, adopting errors of 4 μas in both astrometric coordinates based on current GRAVITY parameters, which are about 13% and 26% of the largest astrometric offsets that these authors estimated for SDSS J140251.19+263117.5.
All Tables
Seven parameters required to describe a Keplerian orbit of eCB-SMBH in three dimensions.
All Figures
|
Fig. 1 Evolving model for the continuum hot dust emission of eCB-SMBH. Left: computer simulation snapshot illustrating the eCB-SMBH configuration at the time instance of pericentre passage. M1 and M2 are SMBH loci, black ellipses are their orbits, B is the barycentre of the system, the blue circle is the sublimation ring bound to the M2, the grey ring is the CBD, C is the centroid of the arc of the dust ring outside the CBD and the photo-centre of the continuum in GRAVITY’s K band. The masses of the SMBHs are M1 = 6 × 10⁷ M⊙ and M2 = 4 × 10⁷ M⊙, eCB-SMBH eccentricity is e = 0.5, and other orbital parameters are Ω1 = 0.1°, ω1 = 0.1°, Ω2 = 180.1°, and ω2 = 180.1°. See the main text for a description of the coordinate system. Right upper: schematic of the barycentric photo-centre displacement |
| In the text | |
|
Fig. 2 Various aspects of eCB-SMBH detectability with GRAVITY+. (a) Flux ratios of the NIR emission originating in a dust ring with respect to the optical continuum as a function of h (dust-ring dimension), for different photo-centre displacements, shown as black lines. The GRAVITY approximate detection limit at λlim ~ 1.95 μm in terms of the flux ratio for dust emission arising at different distances and observed at 2.2 μas is shown as a blue curve. The shape of the blue curve depends on which power index of h is chosen; here its value is set to –2. (b) Expected S/N for NO = 0.25 and |
| In the text | |
|
Fig. 3 Temporal evolution of the offset in both astrometric coordinates across one orbital period for different eCB-SMBH parameters (see the text). Left: general evolution of the astrometric offset of the photo-centre relative to the secondary with respect to Rsub/a at half orbital period (see the second branch in Eq. (38) and Appendices A and B) for eCB-SMBH of varying mass ratio (q) and at a distance of 700 Mpc. Right: evolution of the photo-centre offset in two astrometric coordinates with respect to varying mass ratio and complete orbital period. The mean distance between the components is 100 ld, and the assumed distance between the object and the observer is 700 Mpc. |
| In the text | |
|
Fig. 4 Simulated incomplete observations of RV and astrometric data of the secondary SMBH (red crosses) and the distribution of the modelled posteriors (black dots) for the evolving model given in Fig. 5 (forb ~ 5%), upper row) and Fig. 6 (forb ~ 10%), bottom row). Left column: RV data for the secondary SMBH and the posterior distribution of simulations over time. We note here the RV curve gradient differences: almost constant (upper row) and variable (bottom row). Right column: astrometric observations of the secondary SMBH and the posterior distribution of simulations over time. |
| In the text | |
|
Fig. 5 Joint posterior distribution resulting from the Bayesian inference for three different perturbations in simulated data of eCB-SMBH with monitoring campaign C1 = (10, 12 yr, 221 yr), binary components M1 = 6 × 10⁷ M⊙, M2 = 4 × 10⁷ M⊙, and a mutual mean distance of 100 ld (other orbital parameters are given in the text) for (i) a constant offset hot-dust continuum, (ii) a fluctuating hot-dust continuum offset, and (iii) the evolving continuum model where the offset tracks the orbital motion of the secondary. The diagonal plots show the marginal distribution for each parameter (the projection of the posterior onto that parameter). The contour plots represent the 95% and 68 % credible regions (not proportional to one- and two-sigma level) described in Eq. (41). The solid blue lines represent the true parameter values. The covariance between the total mass and period seen here arises from Kepler s third law implemented in our model. |
| In the text | |
|
Fig. 6 Same as Fig. 5 but for an eCB-SMBH with monitoring campaign C2 = (14, 10 yr, 93.75 yr), binary components, M1 = 6 × 10⁸ M⊙, M2 = 4 × 10⁸ M⊙, and a mean mutual distance of 119 ld. |
| In the text | |
|
Fig. 7 Effects of eccentricity on deformation of the curve defined by the radial acceleration of the secondary SMBH and its radial velocity relative to the primary. eCB-SMBH parameters are P = 100 yr, ω = π/3, i = π/4, ã = 100 ld, and M1 + M2 = 5.2 × 10⁸ M⊙. |
| In the text | |
|
Fig. 8 Simulation of photo-centres for continuum source (blue dots), emission line (red dots), and relative positions (green dots) of emission line photo-centre with respect to the continuum photo-centre. The binary system parameters are: M1 = 6 × 10⁷ M⊙, M2 = 4 × 10⁷ M⊙, e = 0.5, Ω1 = 180°, Ω2 = 100°, ω1 = 0.1°, ω2 = 180.1°, Rsub = 150 ld. The mean mutual distance of the components is 100 ld, the binary distance is ~700 Mpc, and the observer position angle is 40°. The emission line source is located in the BLR that is bound to the primary, whereas the continuum is defined as the barycentre of the dust ring arc that is bound to the secondary and split by the CBD. The cross represents the barycentre of the eCB-SMBH. |
| In the text | |
Current usage metrics show cumulative count of Article Views (full-text article views including HTML views, PDF and ePub downloads, according to the available data) and Abstracts Views on Vision4Press platform.
Data correspond to usage on the plateform after 2015. The current usage metrics is available 48-96 hours after online publication and is updated daily on week days.
Initial download of the metrics may take a while.