Fig. 5
Download original image
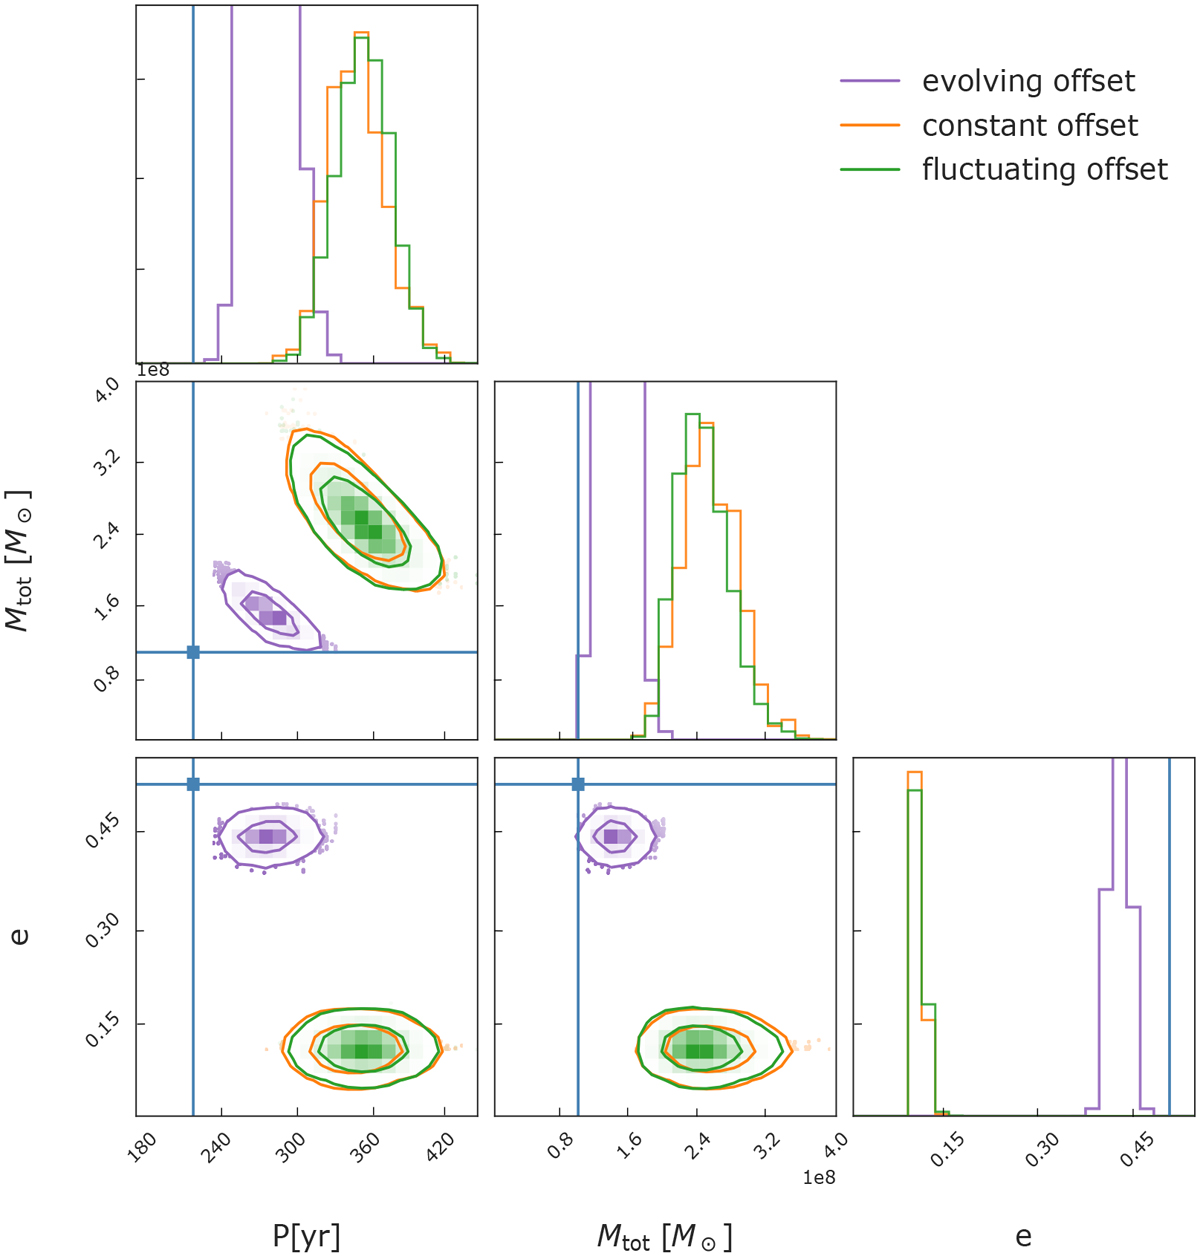
Joint posterior distribution resulting from the Bayesian inference for three different perturbations in simulated data of eCB-SMBH with monitoring campaign C1 = (10, 12 yr, 221 yr), binary components M1 = 6 × 10⁷ M⊙, M2 = 4 × 10⁷ M⊙, and a mutual mean distance of 100 ld (other orbital parameters are given in the text) for (i) a constant offset hot-dust continuum, (ii) a fluctuating hot-dust continuum offset, and (iii) the evolving continuum model where the offset tracks the orbital motion of the secondary. The diagonal plots show the marginal distribution for each parameter (the projection of the posterior onto that parameter). The contour plots represent the 95% and 68 % credible regions (not proportional to one- and two-sigma level) described in Eq. (41). The solid blue lines represent the true parameter values. The covariance between the total mass and period seen here arises from Kepler s third law implemented in our model.
Current usage metrics show cumulative count of Article Views (full-text article views including HTML views, PDF and ePub downloads, according to the available data) and Abstracts Views on Vision4Press platform.
Data correspond to usage on the plateform after 2015. The current usage metrics is available 48-96 hours after online publication and is updated daily on week days.
Initial download of the metrics may take a while.