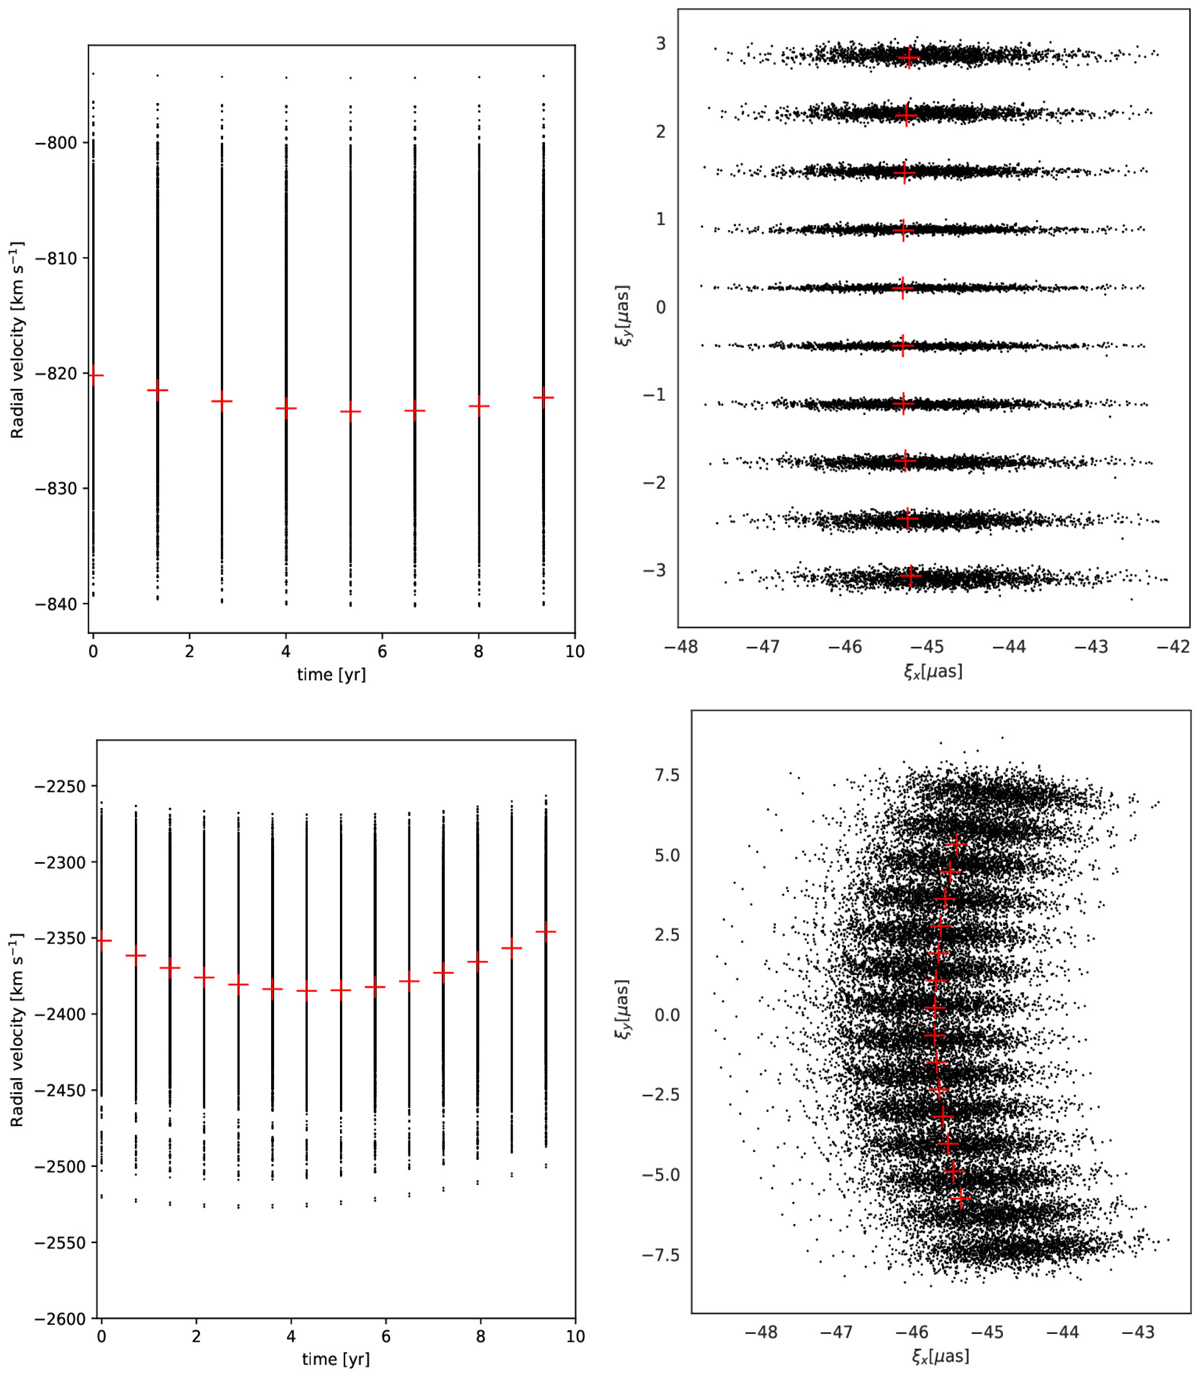
Fig. 4
Download original image
Simulated incomplete observations of RV and astrometric data of the secondary SMBH (red crosses) and the distribution of the modelled posteriors (black dots) for the evolving model given in Fig. 5 (forb ~ 5%), upper row) and Fig. 6 (forb ~ 10%), bottom row). Left column: RV data for the secondary SMBH and the posterior distribution of simulations over time. We note here the RV curve gradient differences: almost constant (upper row) and variable (bottom row). Right column: astrometric observations of the secondary SMBH and the posterior distribution of simulations over time.
Current usage metrics show cumulative count of Article Views (full-text article views including HTML views, PDF and ePub downloads, according to the available data) and Abstracts Views on Vision4Press platform.
Data correspond to usage on the plateform after 2015. The current usage metrics is available 48-96 hours after online publication and is updated daily on week days.
Initial download of the metrics may take a while.