| Issue |
A&A
Volume 652, August 2021
|
|
|---|---|---|
| Article Number | A97 | |
| Number of page(s) | 5 | |
| Section | Stellar atmospheres | |
| DOI | https://doi.org/10.1051/0004-6361/202141741 | |
| Published online | 16 August 2021 | |
12C/13C ratio and CNO abundances in the classical very old metal-poor dwarf HD 140283★
1
GEPI, Observatoire de Paris, PSL Research University, CNRS, Place Jules Janssen,
92190
Meudon,
France
e-mail: This email address is being protected from spambots. You need JavaScript enabled to view it.
2
Universidade de São Paulo, IAG, Rua do Matão 1226, Cidade Universitária,
05508-900
São Paulo,
Brazil
Received:
7
July
2021
Accepted:
18
July
2021
Abstract
Context. The isotope abundances provide powerful diagnostics of the chemical enrichment in our Galaxy. The star HD 140283 is one of the best-studied very metal-poor dwarf stars. It is very old, and the chemical abundance in this star is a good witness of the chemical composition of the matter in the early Galaxy.
Aims. The aim of this work is to measure the precise abundances of carbon, nitrogen, oxygen, and mainly the 12C/13C isotopic ratio in this very old metal-poor star in order to have a good reference for the computations of the chemical evolution of the Galaxy.
Methods. We used very high spectral resolution data, with extremely high signal-to-noise ratios obtained with the spectrographs ESPaDOnS at the CFHT, ESPRESSO at the VLT, and HARPS at the ESO 3.6 m telescope.
Results. For the first time, we were able to measure the 12C/13C ratio in a very old metal-poor dwarf that was born at the very beginning of the Galaxy: 12C/13C = 33−6+12. We also obtained a precise determination of the abundance of the CNO elements in this star. These abundances give information about the early composition of the cloud from which HD 140283 was formed. They suggest that the effect of super-asymptotic giant branch stars or fast-rotating massive stars was significant in the early Galaxy.
Key words: stars: abundances / stars: Population II
Based on observations collected at the CFHT under program 11AB01 (PI: B. Barbuy). We have also used a new ESPRESSO spectrum and HARPS and UVES spectra from observations collected at the European Organisation for Astronomical Research in the Southern Hemisphere: Programme 0101.A-0229(A), PI: M.Spite, and archives of programmes 0103.D-0118(A), PI: V.Adibekian, and 080.D-0347(A), PI: U.Heiter).
© M. Spite et al. 2021
 Open Access article, published by EDP Sciences, under the terms of the Creative Commons Attribution License (https://creativecommons.org/licenses/by/4.0), which permits unrestricted use, distribution, and reproduction in any medium, provided the original work is properly cited.
1 Introduction
During the life of a galaxy, different elements are produced inside stars of different masses and different lifetimes. The element abundances and the isotopic ratios depend on the mass of the star. Therefore elemental and isotopic abundance ratios can provide information on the age of a system and have often been used as a cosmic clock. The abundance of the CNO isotopes in metal-poor stars is indeed an important parameter for building models of galactic evolution (e.g. Romano & Matteucci 2003; Chiappini et al. 2008; Kobayashi et al. 2011). Romano et al. (2017, 2019) studied the evolution of the CNO isotopic ratios in different systems with different star formation histories and different stellar initial mass functions (IMFs). For our Galaxy, these models have to explain the 12C/13C ratio in the primitive Galactic stars, in the Sun, and in the present-day interstellar medium (ISM).
The 12C/13C ratio in the Sun has been precisely measured by Ayres et al. (2013). From a 3D computation of the profile of the infrared (2–6 μm) rovibrational bands of carbon monoxide (CO), they measured 12C/13C = 91.4 ± 1.3 dex.
In the molecular clouds of the ISM, Milam et al. (2005) found, based on the intensities of the hyperfine components of 12CN and 13CN at 113.5 and 108.8 GHz, that in the solar neighborhood, 12C/13C = 68 ± 15 dex. Moreover, Casassus et al. (2005) measured the 12C/13C ratio in the diffuse ISM from absorption lines of the CH+ molecule toward nearby stars. They reported a significant variation of this ratio with a mean value of 78.3 ± 1.8 and a weighted rms dispersion of 12.7.
Only few measurements of the 12C/13C ratio in the very old primitive stars of our Galaxy have been made. Moreover, we are interested in the 12C/13C ratio in the cloudthat formed the star, and this ratio in the atmosphere of the stars is strongly affected by the stellar evolution process (Chanamé et al. 2005). When a low-mass star becomes a subgiant and then a giant, the atmosphere and the deeper layers become mixed. Globally, Li and C abundances decrease, as does the 12C/13C ratio, but the N abundance increases. In the frame of the ESO large program “First stars, first nucleosynthesis”, the carbon abundance was measured in a sample of extremely metal-poor (EMP) turnoff and giant stars, but the 12C/13C ratio could only be estimated in giants. To date, it has not been measured in normal very metal-poor dwarfs or turnoff stars, whose atmosphericchemical composition is the same as the chemical composition of the cloud that formed the star. The 13CH lines are indeed too weak in these stars.
The 12C/13C ratio has been measured in carbon-enhanced metal-poor (CEMP) turnoff stars (see e.g. Sivarani et al. 2006; Behara et al. 2010). The high carbon abundance in these stars can be due to an accretion of the ejecta of a more massive companion in its AGB phase, and thus the 12C/13C ratio does not reflect the original abundance in the cloud that formed this star.
The 12C/13C ratio could be estimated in the sample of EMP giants on the lower red giant branch (RGB) and was found to be close to 30 (Spite et al. 2006). These stars were called “unmixed giants” by Spite et al. (2005), in comparison with the stars at the top of the RGB that have undergone a deep mixing and were called “mixed giants”. In these mixed giants, compared with the abundance in dwarf stars, the Li abundance has decreased by more than 100 and the C abundance by more than 10. In contrast, in the unmixed giants on the lower RGB branch, the carbon abundance appears to have decreased by less than a factor of 2 (Bonifacio et al. 2009) and the Li abundance by a factor of only about 10. It is clear, however, that these unmixed giants have undergone some mixing that might have affected the 12C/13C ratio in particular.
Because the 12C/13C ratio in the unmixed giants is used as an important parameter when models of the chemical evolution of the Galaxy are constructed (Chiappini et al. 2006, 2008; Romano et al. 2017), it is important to measure this ratio in metal-poor dwarfs or turnoff stars. In these stars, the original CNO abundances are more certain to be unaltered by mixing processes.
2 Nucleosynthesis of the 13C isotope
In the early Galaxy, the main contributors to the matter enrichment were massive stars. They have a very short lifetime. These stars are assumed to eject a material with a high 12C/13C ratio (see e.g. Nomoto et al. 2013). To explain the relatively low observed 12C/13C ratio, in particular, in the very metal-poor unmixed giants (Spite et al. 2006), Kobayashi et al. (2011) invoked the effect of massive asymptotic giant branch (AGB) stars (with 4 M⊙ < M < 7 M⊙) and fast-rotating massive stars (FRMS) (Meynet et al. 2006; Chiappini et al. 2008; Frischknecht et al. 2016). Our paper is an attempt to measure this ratio in a classical very metal-poor star that has just passed the turnoff: HD 140283.
3 Main characteristics of HD 140283
In recent years, the old star HD 140283 has been the subject of numerous studies. The main atmospheric parameters have been determined from different characteristics of the star: excitation and ionisation equilibrium of the lines in the UV, the visible and the infrared, profiles of H α wings, and colours. All these values agree very well. All the recent determinations are gathered in Table 1, together with our adopted parameters, which are the same as were adopted by Gallagher et al. (2010) and Siqueira Mello et al. (2012, 2015).
HD 140283 is a classical very metal-poor star. Its chemical composition has been studied in detail in particular by Siqueira Mello et al. (2015). They found a metallicity [Fe/H] = –2.591.
It is a very old star that formed shortly after the Big Bang. From isochrones computed using the 2012 version of the University of Victoria code (VandenBerg et al. 2012) with a parallax obtained from the Fine Guidance Sensors of the Hubble Space Telescope (π = 17.15 ± 0.14 mas), Bond et al. (2013) found an age of 14.46 ± 0.31 Gyr.
This parallax is larger than the more precise measurement of the Gaia EDR3 (Gaia Collaboration 2021): π = 16.30 ± 0.03 mas (after a 0.03 offset correction; Lindegren et al. 2018). In Fig. 1 we present the position of HD 140283 in a G versus BP-RP diagram. The G magnitude and the BP-RP colour given by the Gaia-DR2 were corrected for the distance and the reddening of the star using the map STILISM2 (Lallement et al. 2018). The error in G is negligible and the error on BP-RP is mainly due to the uncertainty in the reddening. The position of HD 140283 in Fig. 1 is compared to the PARSEC isochrones (Bressan et al. 2012)computed for 10, 12, and 14 Gyr. This diagram confirms that the age of HD 140283 is very close to 14 Gyr.
Recent stellar parameters for HD 140283 in the literature and adopted values.
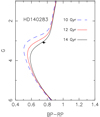 |
Fig. 1 Position of HD 140283 (black dot) in a G vs. BP-RP diagram compared to PARSEC isochrones (Bressan et al. 2012), computed for 10, 12, and 14 Gyr. |
4 Observations
HD 140283 was observed in 2011 within the program 11AB01 (PI: B. Barbuy) at the Canada-France-Hawaii Telescope (CFHT) with the spectrograph ESPaDOnS in order to obtain a high-resolution spectrum with a very high signal-to-noise ratio (S/N) in the wavelength range 3700–10475 Å. The spectrum was reduced using the CFHT pipeline Upena (more information about the reduction procedure is given by Siqueira Mello et al. 2015). The resolving power of the resulting spectrum is R = 81 000, and the S/N perpixel is about 1500 at 4200 Å.
A very good spectrum of HD 140283 was recently also obtained with the ESPRESSO spectrograph, which is installed at the incoherent combined Coudé facility of the Very Large Telescope. The resolving power of this spectrum, 140 000 at 4200 Å, is higher than the resolving power of the CFHT spectrum, but the S/N is lower: about 700.
The full width at half maximum (FWHM) of the lines in this spectrum is about 0.06 Å and the size of a pixel is 0.005 Å. Following Cayrel (1988), it is thus possible to measure lines as weak as 0.04 mÅ on this spectrum. This theoretical formula is rather optimistic (it neglects, in particular, the uncertainty on the location of the continuum), therefore observers generally multiply this estimate by 2. To be on the safe side of the estimation, we conclude that it is possible to detect lines as weak as 0.1 mÅ. This value is also a good estimate of the error on the equivalent widths of the weak lines. The same Cayrel formula applied to the ESPaDOnS spectrum leads to about the same estimate of the error (the higher S/N of this spectrum compensates for its lower resolution).
The ESO archive also contains a HARPS spectrum with a resolving power R = 120 000, but the S/N is only 300 around 4200 Å. This HARPS spectrum was used to check the compatibility of our results.
5 Determination of C, 12C, and 13C abundances
We interpolated an atmosphere model in the MARCS grid (Gustafsson et al. 1975, 2003, 2008; Plez 2008) with the parameters defined in Table 1, and in Fig. 2 we show a synthetic spectrum in the region of the G carbon-band with the current version of the turbospectrum code (Alvarez & Plez 1998).
We made use of the updated line list of the 12C and 13C bands given by Masseron et al. (2014). A major improvement in these data was achieved because they are the result of a global fit of astronomical observations and laboratory measurements for the three electronic transitions A–X, B–X, and C–X. Several features of the 13C band exist, but the stronger 13CH lines are at 4230.3 and 4231.45 Å. The best fit was obtained for A(12C) = 6.31 and A(13C) = 4.80 (mean of the ESPaDOnS and ESPRESSO values, Fig. 2).
These values correspond to A(C) = 6.32, or, with A(C)⊙ = 8.50 (Caffau et al. 2009), [C/H] = –2.18, and thus [C/Fe] = +0.41. This agrees well with the value found by Siqueira Mello et al. (2015), [C/Fe] = +0.46. This value of [C/Fe] is also very close to the mean value found in the turnoff very metal-poor stars, [C/Fe] = +0.45 ± 0.10 (Bonifacio et al. 2009).
The 13C features are well fitted with A(13C) = 4.80, and the equivalent width of the 13C feature at 4231.4 mÅ (measured on the synthetic spectrum) is close to 0.4 mÅ. If we adopt an error of 0.1 mÅ on the equivalent width (see Sect. 4), this error therefore corresponds to A(13C)  or 12C/13C
  .
.
6 Nitrogen and oxygen abundance
From the profile of the CN band at 3883 Å, Siqueira Mello et al. (2015) derived a very high value of the nitrogen abundance A(N) = 6.30 and thus [N/Fe] = +1.06. Because in dwarf stars, the CN band is very weak, a very smallchange in the position of the continuum induces a large variation of the nitrogen abundance. We thus decided to determine the nitrogen abundance from the NH band in the near UV from a recently obtained UVES spectrum (Fig. 3, top panel). The line list and the molecular data of the NH band comes from Kurucz. The best fit was obtained with A(N) = 5.85 or [N/H] = –2.01 and [N/Fe] = +0.56 (adopting A(N) ⊙ = 7.86 following Caffau et al. 2009).
Spite et al. (2005) showed that there is a systematic difference between the N abundance derived from the NH or the CN bands based on the Kurucz data: A(N)NH - A(N)CN = 0.4 dex. It is generally admitted that the loggf values in the NH data of Kurucz are 0.4 dex too low. This correction was also applied by Pasquini et al. (2008) in globular clusters stars. In Table 2 we list the corrected value.
With this CN scale, the N abundance in HD 140283 is even lower: A(N) = 5.45 and [N/Fe] = +0.16.
In Fig. 3, the value A(N) = 6.3 (Siqueira Mello et al. 2015) is incompatible with the observed spectrum of the NH band. On the other hand, we verified that the low value of the N abundance found from the NH band is compatible with the observed CN profile.
The oxygen abundance was also computed from the ESPRESSO spectrum around 7770 Å. We found A(O) = 7.06 (Fig. 3, bottom panel), which perfectly agrees with the value deduced from the ESPaDOnS spectrum by Siqueira Mello et al. (2015). This value was corrected by –0.1 dex for non-local thermodynamic equilibrium (NLTE) following Zhao et al. (2016). As a consequence, in this star (with A(O)⊙ = 8.76 following Caffau et al. 2009; Steffen et al. 2015), [O/H] = –1.76 and [O/Fe] = +0.77.
Abundance ratios of the C, N, O elements in HD 140283, with [Fe/H] = –2.57.
7 Discussion and conclusion
For the first time, we have measured the precise value of the 12C ∕13C ratio in a very old galactic metal-poor dwarf HD 140283. We also derived precise oxygen and nitrogen abundances in this star. The abundance ratios of the C, N, O elements are summarised in Table 2.
At the evolution stage of HD 140283, the star has not undergone any mixing with the deep layers. In particular, the Li abundance, which is more sensitive to mixing processes than the C and N elements, is normal in this star according to Siqueira Mello et al. (2015): A(Li) = 2.14, a value very close to the “plateau”. (In the low RGB stars, which have until now been used as a reference forthe abundance of the CNO elements in the early Galaxy, the Li abundance is more than ten times lower than in the dwarfs).
As a consequence, in HD 140283 the C, N, O abundances and the isotopic 12C ∕13 C ratio should be the same as the original values in the cloud that formed the star. The [C/Fe] ratio in HD 140283 (+0.41) perfectly agrees with the mean value found by Bonifacio et al. (2009) in a sample of very and extremely metal-poor dwarfs and turnoff stars. The [O/Fe] ratio in HD 140283 also agrees well with the value measured by González Hernández et al. (2008) in the EMP dwarf CS 22876-032. Moreover, the ratios [C/Fe], [N/Fe], [O/Fe], [N/O], [C/O], and 12C ∕13 C in HD 140283 are not very different from the mean value found in the low RGB stars called unmixed giants in Spite et al. (2005, see their Figs. 6, 11, and 14). The first dredge-up does not seem to have severely affected the CNO abundance ratios and in particular the ratio 12C ∕13C.
HD 140283 is a very old star whose atmosphere is assumed to be a good witness of the original abundances of the CNO elements. We measured 12C ∕13 C = 32 (or 30 in mass fraction), a rather low ratio. Because the classical massive supernovae are not able to eject a significant amount of 13C (see e.g. Nomoto et al. 2013), this low 12C ∕13C ratio suggests that the material that forms the very old galactic stars has been enriched by FRMS or massive AGB stars.
In FRMS, rotation triggers the production of primary 13C. It indeed allows the diffusion of 12C that is produced in the He-burning zone into the H-burning region, where it is converted into 13C by the CNO cycle.
Another possibility is an enrichment of the matter by super-AGB or massive AGB stars. This could be an additional source of 13C in the early stages of the Galaxy formation (Doherty et al. 2014; Gil-Pons et al. 2021).
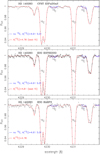 |
Fig. 2 Observed ESPaDOnS (CFHT) ESPRESSO and HARPS (ESO) spectra (crosses) in the region of the 13C features. Synthetic spectra (thin blue lines) are shown for A(12C) = 6.31, and A(13C) = –5 (no 13C), A(13C) = 4.61 (12C/13C = 50), and A(13C) = 5.01 (12C/13C = 20). The red linerepresents the best fit. |
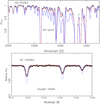 |
Fig. 3 Top panel: NH band in the UVES spectrum computed with A(N) = 5.7 and A(N) = 6.3 (blue lines) and with A(N) = 5.85(best fit, red line). Bottom panel: O I triplet in the ESPRESSO spectrum. The synthetic spectra have been computed with A(O) = 6.7, 7.3 (blue lines) and the best fit A(O) = 7.06 (red line). The crosses represent the observed spectra. Theabundances are raw values. The N abundances must be corrected by –0.4 (shift of the Kurucz log gf values) and the oxygen abundance by –0.1 (NLTE). |
Acknowledgements
B.B. acknowledges partial financial support from Fapesp, CNPq, and CAPES. This work uses results from the European Space Agency (ESA) space mission Gaia. Gaia data are being processed by the Gaia Data Processing and Analysis Consortium (DPAC). Funding for the DPAC is provided by national institutions, in particular the institutions participating in the Gaia MultiLateral Agreement (MLA). The Gaia mission website is https://www.cosmos.esa.int/gaia. The Gaia archive website is https://archives.esac.esa.int/gaia.
References
- Afşar, M., Sneden, C., Frebel, A., et al. 2016, ApJ, 819, 103 [Google Scholar]
- Alvarez R., & Plez B. 1998, A&A 330, 1109 [Google Scholar]
- Aoki, W., Inoue, S., Kawanomoto, S., et al. 2004, A&A, 428, 579 [NASA ADS] [CrossRef] [EDP Sciences] [Google Scholar]
- Asplund, M., Lambert, D. L., Nissen, P. E., et al. 2006, ApJ, 644, 229 [Google Scholar]
- Ayres, T. R., Lyons, J. R., Ludwig, H.-G., et al. 2013, ApJ, 765, 46 [Google Scholar]
- Behara, N. T., Bonifacio, P., Ludwig, H.-G., et al. 2010, A&A, 513, A72 [NASA ADS] [CrossRef] [EDP Sciences] [Google Scholar]
- Bond, H. E., Nelan, E. P., VandenBerg, D. A., et al. 2013, ApJ, 765, L12 [Google Scholar]
- Bonifacio, P., Spite, M., Cayrel, R., et al. 2009, A&A, 501, 519 [NASA ADS] [CrossRef] [EDP Sciences] [Google Scholar]
- Bressan, A., Marigo, P., Girardi, L., et al. 2012, MNRAS, 427, 127 [NASA ADS] [CrossRef] [Google Scholar]
- Caffau, E., Ludwig, H.-G., & Steffen, M. 2009, Mem. Soc. Astron. It., 80, 643 [Google Scholar]
- Casagrande, L., Ramírez, I., Meléndez, J., et al. 2010, A&A, 512, A54 [NASA ADS] [CrossRef] [EDP Sciences] [Google Scholar]
- Casassus, S., Stahl, O., & Wilson, T. L. 2005, A&A, 441, 181 [NASA ADS] [CrossRef] [EDP Sciences] [Google Scholar]
- Cayrel, R. 1988, IAU Symp., 132, 345 [Google Scholar]
- Chanamé, J., Pinsonneault, M., & Terndrup, D. M. 2005, ApJ, 631, 540 [Google Scholar]
- Chiappini, C., Hirschi, R., Meynet, G., et al. 2006, A&A, 449, L27 [NASA ADS] [CrossRef] [EDP Sciences] [Google Scholar]
- Chiappini, C., Ekström, S., Meynet, G., et al. 2008, A&A, 479, L9 [NASA ADS] [CrossRef] [EDP Sciences] [Google Scholar]
- Doherty, C. L., Gil-Pons, P., Lau, H. H. B., et al. 2014, MNRAS, 441, 582 [NASA ADS] [CrossRef] [Google Scholar]
- Frischknecht, U., Hirschi, R., Pignatari, M., et al. 2016, MNRAS, 456, 1803 [Google Scholar]
- Gaia Collaboration (Brown, A. G. A., et al.) 2021, A&A, 649, A1 [NASA ADS] [CrossRef] [EDP Sciences] [Google Scholar]
- Gallagher, A. J., Ryan, S. G., García Pérez, A. E., et al. 2010, A&A, 523, A24 [NASA ADS] [CrossRef] [EDP Sciences] [Google Scholar]
- Gil-Pons, P., Doherty, C. L., Gutiérrez, J., et al. 2021, A&A, 645, A10 [EDP Sciences] [Google Scholar]
- González Hernández, J. I., Bonifacio, P., Ludwig, H.-G., et al. 2008, A&A, 480, 233 [NASA ADS] [CrossRef] [EDP Sciences] [MathSciNet] [Google Scholar]
- Gustafsson B., Bell R. A., Eriksson K., & Nordlund, Å. 1975, A&A, 42, 407 [Google Scholar]
- Gustafsson B., Edvardsson B., Eriksson K., et al. 2003, ASP Conf. Ser., 288, 331 [Google Scholar]
- Gustafsson, B., Edvardsson, B., Eriksson, K., et al. 2008, A&A, 486, 951 [NASA ADS] [CrossRef] [EDP Sciences] [Google Scholar]
- Hirschi, R. 2007, A&A, 461, 571 [NASA ADS] [CrossRef] [EDP Sciences] [Google Scholar]
- Hosford, A., Ryan, S. G., García Pérez, A. E., et al. 2009, A&A, 493, 601 [NASA ADS] [CrossRef] [EDP Sciences] [Google Scholar]
- Kobayashi, C., Karakas, A. I., & Umeda, H. 2011, MNRAS, 414, 3231 [NASA ADS] [CrossRef] [Google Scholar]
- Lallement, R., Capitanio, L., Ruiz-Dern, L., et al. 2018, A&A, 616, A132 [NASA ADS] [CrossRef] [EDP Sciences] [Google Scholar]
- Lindegren, L., Hernández, J., Bombrun, A., et al. 2018, A&A, 616, A2 [NASA ADS] [CrossRef] [EDP Sciences] [Google Scholar]
- Masseron, T., Plez, B., Van Eck, S., et al. 2014, A&A, 571, A47 [NASA ADS] [CrossRef] [EDP Sciences] [Google Scholar]
- Meynet, G., Ekström, S., & Maeder, A. 2006, A&A, 447, 623 [NASA ADS] [CrossRef] [EDP Sciences] [Google Scholar]
- Milam, S. N., Savage, C., Brewster, M. A., et al. 2005, ApJ, 634, 1126 [Google Scholar]
- Nomoto, K., Kobayashi, C., & Tominaga, N. 2013, ARA&A, 51, 457 [Google Scholar]
- Pasquini, L., Ecuvillon, A., Bonifacio, P., et al. 2008, A&A, 489, 315 [NASA ADS] [CrossRef] [EDP Sciences] [Google Scholar]
- Peterson, R. C., & Kurucz, R. L. 2015, ApJS, 216, 1 [Google Scholar]
- Plez, B. 2008, Phys. Scr. T, 133, 014003 [Google Scholar]
- Roederer, I. U. 2012, ApJ, 756, 36 [Google Scholar]
- Romano, D., & Matteucci, F. 2003, MNRAS, 342, 185 [Google Scholar]
- Romano, D., Matteucci, F., Zhang, Z.-Y., et al. 2017, MNRAS, 470, 401 [NASA ADS] [CrossRef] [Google Scholar]
- Romano, D., Matteucci, F., Zhang, Z.-Y., et al. 2019, MNRAS, 490, 2838 [NASA ADS] [CrossRef] [Google Scholar]
- Siqueira Mello, C., Barbuy, B., Spite, M., et al. 2012, A&A, 548, A42 [NASA ADS] [CrossRef] [EDP Sciences] [Google Scholar]
- Siqueira Mello, C., Andrievsky, S., Barbuy, B., et al. 2015, A&A, 584, A86 [NASA ADS] [CrossRef] [EDP Sciences] [Google Scholar]
- Sivarani, T., Beers, T. C., Bonifacio, P., et al. 2006, A&A, 459, 125 [NASA ADS] [CrossRef] [EDP Sciences] [Google Scholar]
- Spite, M., Cayrel, R., Plez, B., et al. 2005, A&A, 430, 655 [NASA ADS] [CrossRef] [EDP Sciences] [Google Scholar]
- Spite, M., Cayrel, R., Hill, V., et al. 2006, A&A, 455, 291 [NASA ADS] [CrossRef] [EDP Sciences] [Google Scholar]
- Steffen, M., Prakapavicius, D., Caffau, E., et al. 2015, A&A, 583, A57 [NASA ADS] [CrossRef] [EDP Sciences] [Google Scholar]
- VandenBerg, D. A., Bergbusch, P. A., Dotter, A., et al. 2012, ApJ, 755, 15 [Google Scholar]
- Zhao, G., Mashonkina, L., Yan, H. L., et al. 2016, ApJ, 833, 225 [Google Scholar]
For each element X, we adopted the classical notations A(X) = (log (N(X)/N(H)) + 12), [X∕H] = A(X)⋆ −A(X)⊙, and [X/Fe] = [X/H]–[Fe/H].
All Tables
All Figures
|
Fig. 1 Position of HD 140283 (black dot) in a G vs. BP-RP diagram compared to PARSEC isochrones (Bressan et al. 2012), computed for 10, 12, and 14 Gyr. |
| In the text | |
|
Fig. 2 Observed ESPaDOnS (CFHT) ESPRESSO and HARPS (ESO) spectra (crosses) in the region of the 13C features. Synthetic spectra (thin blue lines) are shown for A(12C) = 6.31, and A(13C) = –5 (no 13C), A(13C) = 4.61 (12C/13C = 50), and A(13C) = 5.01 (12C/13C = 20). The red linerepresents the best fit. |
| In the text | |
|
Fig. 3 Top panel: NH band in the UVES spectrum computed with A(N) = 5.7 and A(N) = 6.3 (blue lines) and with A(N) = 5.85(best fit, red line). Bottom panel: O I triplet in the ESPRESSO spectrum. The synthetic spectra have been computed with A(O) = 6.7, 7.3 (blue lines) and the best fit A(O) = 7.06 (red line). The crosses represent the observed spectra. Theabundances are raw values. The N abundances must be corrected by –0.4 (shift of the Kurucz log gf values) and the oxygen abundance by –0.1 (NLTE). |
| In the text | |
Current usage metrics show cumulative count of Article Views (full-text article views including HTML views, PDF and ePub downloads, according to the available data) and Abstracts Views on Vision4Press platform.
Data correspond to usage on the plateform after 2015. The current usage metrics is available 48-96 hours after online publication and is updated daily on week days.
Initial download of the metrics may take a while.