Fig. 3
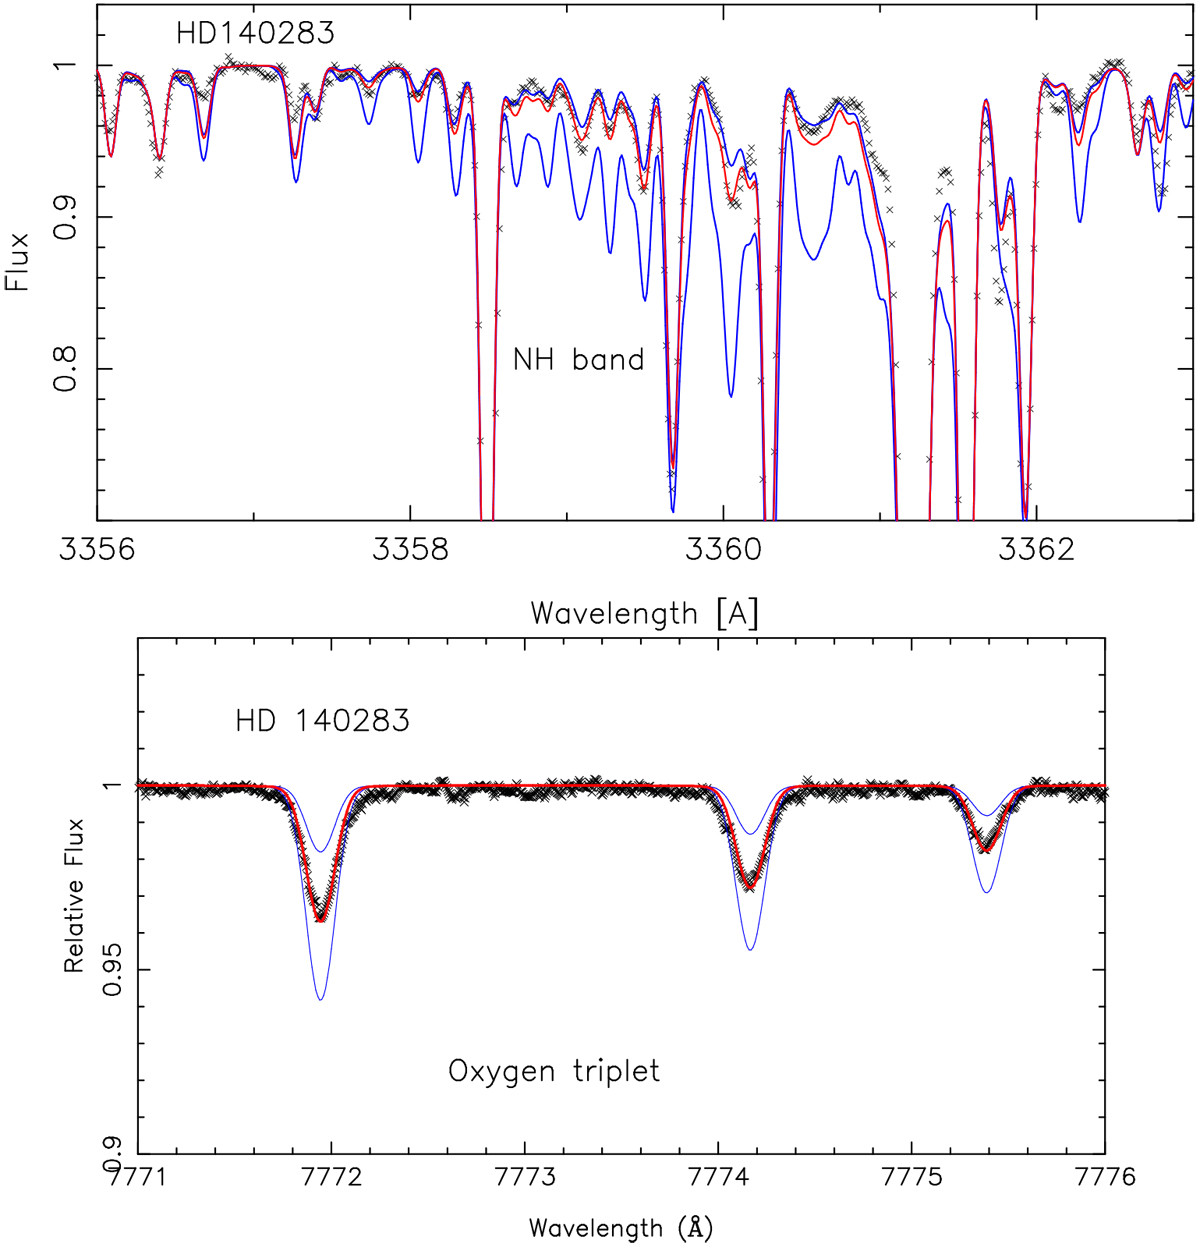
Top panel: NH band in the UVES spectrum computed with A(N) = 5.7 and A(N) = 6.3 (blue lines) and with A(N) = 5.85(best fit, red line). Bottom panel: O I triplet in the ESPRESSO spectrum. The synthetic spectra have been computed with A(O) = 6.7, 7.3 (blue lines) and the best fit A(O) = 7.06 (red line). The crosses represent the observed spectra. Theabundances are raw values. The N abundances must be corrected by –0.4 (shift of the Kurucz log gf values) and the oxygen abundance by –0.1 (NLTE).
Current usage metrics show cumulative count of Article Views (full-text article views including HTML views, PDF and ePub downloads, according to the available data) and Abstracts Views on Vision4Press platform.
Data correspond to usage on the plateform after 2015. The current usage metrics is available 48-96 hours after online publication and is updated daily on week days.
Initial download of the metrics may take a while.