| Issue |
A&A
Volume 644, December 2020
|
|
|---|---|---|
| Article Number | A30 | |
| Number of page(s) | 9 | |
| Section | Planets and planetary systems | |
| DOI | https://doi.org/10.1051/0004-6361/202039385 | |
| Published online | 26 November 2020 | |
Phase-angle dependence of colour ratios and potential implications for lunar remote sensing
1
State Key Laboratory of Space Weather, National Space Science Center, Chinese Academy of Sciences,
Beijing, PR China
2
Planetary Science Institute, School of Earth Sciences, China University of Geosciences,
Wuhan, PR China
e-mail: This email address is being protected from spambots. You need JavaScript enabled to view it.
3
Shandong Key Laboratory of Optical Astronomy and Solar-Terrestrial Environment, School of Space Science and Physics, Shandong University,
Weihai, PR China
4
Center for Excellence in Comparative Planetology, Chinese Academy of Sciences,
Hefei, PR China
5
The University of Alabama,
Tuscaloosa,
AL, USA
Received:
10
September
2020
Accepted:
10
October
2020
Abstract
Context. The colour-ratio technique has been widely used in mapping planetary surfaces, but its solar phase-angle dependence is not well understood. Understanding the phase-angle dependence of the colour ratio would enhance our abilities in interpreting planetary remote sensing data.
Aims. We aim to investigate the dependence of the colour ratio indices on mineralogy, phase angle, particle size, and the degree of simulated space weathering.
Methods. We measured the multi-band (i.e. 458, 633, 750, and 905 nm) and multi-angle reflectance spectra of four typical lunar-type minerals with different particle sizes using a custom multi-angular imaging device.
Results. The colour ratio does have a phase-angle dependence that is more sensitive to the mineralogy and wavelength and less sensitive to particle size distribution.
Conclusions. The combined analysis of the colour ratio and its phase dependence can improve efficiency in mapping the lunar surface. With a prior knowledge of the phase behaviours of colour ratios of specific lunar-type minerals, an optimised colour ratio at certain phase angles can be found to efficiently distinguish the composition of a target surface.
Key words: instrumentation: photometers / techniques: photometric / Moon / planets and satellites: surfaces / planets and satellites: composition
When this work began, Y. Yang was with China University of Geosciences (Wuhan).
© ESO 2020
1 Introduction
Optical remote sensing plays an important role in planetary exploration, as light reflected from planetary surfaces contains a wealth of information of the surficial material. The light scattering features of a planetary surface are determined by both the mineralogical and chemical compositions and physical properties of the regolith (e.g. particle size distribution, transparency, porosity, and roughness). The spectral bidirectional reflectance (Hapke 1981) is the most widely used quantity to characterise the photometric and spectral properties of a surface. Photometric observations focus on the angular dependence of reflectance and are usually measured at several wavelengths (e.g. Jiang et al. 2019), while spectral measurements focus on the wavelength dependence of the reflected light and are usually measured at one or several fixed angular positions. The reason is that for most natural surfaces, the spectral features can be different at different measurement geometries (e.g. Gradie et al. 1980; Sanchez et al. 2012; Yang et al. 2019, 2020). Therefore, photometric correction that transforms spectra measured at different measurement angles to a standard configuration is important for quantitative spectral analysis. For example, the NASA Reflectance Experiment LABoratory (RELAB) releases most of its library reflectance spectra measured at incident zenith (i) 30°, viewing zenith (e) 0°, and phase angle (g) 30° (Pieters 1983).
The correction methods that applied to various lunar orbital data, including the Clementine ultraviolet-visible (UVVIS) camera, Kaguya Multiband Imager (MI) and Spectral Profiler (SP), Moon Mineral Mapper (M3), and Chang’E-1 data (e.g. McEwen 1996; Yokota et al. 2011; Besse et al. 2013; Wu et al. 2013), treat the lunar surface as two or several major terrains (i.e. mafic mare and feldspathic highland) and assume each terrain has a uniform scattering property. This assumption ignores the inhomogeneous surface properties within each region, while both the lunar mare and highland regions have shown their own variations in surface properties (e.g. Sato et al. 2014; Jeong et al. 2015). In principle, the photometric functions needed in photometric corrections can only be acquired by taking repeated measurements at a wide range of phase angles in the same area. However, it is difficult for orbiters to obtain remote sensing data with high resolutions in both angular and spectral domains simultaneously, especially when a high spatial resolution is required. Applying an identical photometric function for all parts within one region may cause large errors for areas with a diverse photometric property and thus affect the subsequent spectral analysis.
Various methods have been developed to study the target surface for different optical detection data. For example, the colour ratio (i.e. the ratio of reflectance in two spectral bands) has been widely used to distinguish different surface units of the Moon and other planetary bodies when only limited numbers of spectral bands are available. The colour ratio is a measure of the spectral slope and strongly depends on composition. It can enhance the colour differences among different surface units and integrate the information of two bands into one index. McCord (1969) carried out a series of Earth-based observations of the Moon and found composition-related colour variations on the surface. Rava & Hapke (1987) developed a model for the factors that control colour ratios of a silicate regolith and applied it to the interpretations of multi-spectral data obtained by Mariner 10.
Besides the composition, the colour ratio may be dependent on other factors as well. According to Blewett et al. (1995), colour ratios of R410/R760-nm and R760/R990-nm can change with soil maturity, the relative strength of the 1 μm band, and the titanium (Ti) content of the mare basalt. Therefore, colour ratios are often used to characterise the maturity (Lucey et al. 2000a) and derive the abundance of TiO2 or FeO (e.g. Melendrez et al. 1994; Lucey et al. 1995, 1998, 2000b; Blewett et al. 1997).
When measurements cover a wide range of phase angles, photometric modelling can be used to retrieve the physical properties of the observed surface (e.g. Hapke et al. 2012; Sato et al. 2014; Jin et al. 2015; Lin et al. 2020). However, not all datasets can cover sufficient phase angles over the same region. The data obtained by the Lunar Reconnaissance Orbiter Camera (LROC), Wide Angle Camera (WAC), and Narrow Angle Camera (NAC) have covered a large portion of the lunar surface with a wide phase angle coverage and thus made photometric modelling possible. With these datasets, Sato et al. (2014) derived the Hapke photometricparameters for the whole Moon, Clegg-Watkins et al. (2016) analysed the scattering property changes of the Chang’E-3 landing site before and after the touchdown, and Clegg-Watkins et al. (2017) identified the nonmare volcanism on the Moon.
The LROC NAC data has a very high spatial resolution (0.2–2 m pixel−1) but only one spectral band. On the other hand, the M3 data has a high spectral resolution (20–40 nm) but only very limited regions have been measured repeatedly to get sufficient information for photometric modelling. The modern multi-spectral image data obtained by the MI have both acceptable band numbers and spatial resolution, and have made repeated measurements over the same region at varied phase angles. Although it may not be enough for photometric modelling, it still can provide some angular scattering information for most of the lunar surface.
The colour ratio may be phase-angle dependent. Previous laboratory studies by Adams & Filice (1967) show that the colour ratio R700/R400 (ratio of reflectance at 700 to 400 nm, similarly in definition of colour ratio hereinafter) of some silicate rocks and minerals have non-monotonic phase-angle dependence. Kaydash et al. (2010) analysed the colour ratio (R600/R470) of two representative areas of the lunar surface with ground-based observations and found that the colour ratio of the two areas have different behaviours with increasing phase angles. Therefore, when using the colour ratio mapping method, the phase-angle effect should be considered. Although in principle photometric correction can reduce the phase effect, photometric correction with insufficient photometric data for the same target surface may increase the uncertainties of colour ratio analysis.
From another perspective, a colour ratio analysis taking into account the phase-angle information may improve our ability in data interpretations. To better interpret the modern multi-spectral data of the Moon (i.e. Kaguya MI and LROC WAC), it is imperative to understand how different factors (e.g. mineralogy, particle size distribution, and albedo) will affect the phase-angle behaviour of the colour ratios (Shkuratov et al. 2011).
In this study, we characterised the phase-angle behaviour of colour ratios by performing controlled laboratory measurements. Specifically, we measured the colour ratios of four typical lunar-type minerals with different particle sizes and albedos at different viewing configurations. We aim to answer the following questions: what is the phase angle effect on colour ratios, and which factors (e.g. mineralogy and particle size distribution) contribute to the phase-angle dependence? For silicate minerals, how would maturity affect the colour ratios? We also applied our findings to the interpretations of lunar remote sensing data.
2 Materials and methods
2.1 Samples
As shown in Fig. 1a, four typical lunar-type minerals, olivine (OLV), orthopyroxene (OPX), plagioclase (PLG), and ilmenite (ILM), were ground and wet-sieved into five different size distributions (<45, 45–61, 61–75, 75–90, and 90–105 μm). It is worth noting that the median particle size of returned lunar soil samples is 40 to 130 μm, with an average of 70 μm (Heiken et al. 1991; Carrier III 2003), and the optical properties of the lunar surface are mainly determined by the finest fraction (Pieters et al. 1993). The width of each sample holder is 9 mm, with a depth of 10 mm. These 20 samples allow us to study the effects of both the mineral compositions and particle sizes on the phase dependence of colour ratios. The original bulk samples of OLV, OPX, and PLG are the same as those used in Yang et al. (2019), and the original ILM sample is the same as that used in Jiang et al. (2019). Figure 1b shows the reflectance spectra between 400 and 1100 nm of the four mineral samples with a medium particle size distribution of 61–74 μm. The spectra were measured at i = 30°, e = 0°, g = 30° using a custom bi-directional reflectance apparatus with a Spectral Evolution SR-2500. The reflectance was relative to a Spectralon with nominal 99% reflectance.
2.2 Instrument
As shown in Fig. 2, a custom photometric imaging system was set up to perform the measurement of colour ratios at various phase angles. The system consists of an azimuthal circular and a vertical semi-circular rail (both from HepcoMotion) with a sled that carries the viewing optics assembly (Coburn & Peddle 2006). By rotating the azimuthal rail, we can change the viewing azimuth from 0° to 360°. By manually sliding the viewing optics assembly along the vertical rail, the viewing zenith angles can be varied from − 55° to 65° (with negative signs indicating the opposite of the incidence). We used a highly stable light source (Thorlab; SLS201L) with a wavelength range from 360 to 2600 nm and a removable filter holder (Fig. 2b). The light beam from the light source is inserted into a fibreoptic cable and directed to a collimator installed in a cage system that is attached to a rotary stage. An aperture is installed at the end of the cage system to adjust the size of the light spot (Fig. 2c). The rotary stage is mounted on an adjustable post, which is in turn installed on a two-dimensional translation stage. The viewing optics consist of an Apogee F260 CCD camera with 512 × 512 pixels and a Nikonzoom lens with an adjustable aperture and focal length. The CCD has a 16-bit analogue-to-digital converter with a saturation digital number value of 65 535.
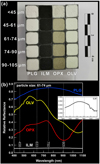 |
Fig. 1 Picture and reflectance spectra of samples used in this study. Panel a: sample images: from left to right, the four columns are PLG, ILM, OPX, and OLV samples with different particle sizes, respectively. Samples in the same row have the same size distribution; for instance, the four samples in the top row all have a size distribution of <45 μm. Panel b: reflectance spectra of the four mineral samples with a particle size distribution of 61–74 μm measured at i = 30°, e = 0°, g = 30°. The dashed lines indicate the central wavelengths of the four filters used in this study. The inset plot shows the enlarged view of the ILM spectrum, which has a reflectance peak around 850 nm. |
2.3 Measurement
Before measurements, the particles of each sample were poured into the sample holder, and then the surface was slightly flattened with a ruler. All 20 samples were placed in the same plate to be measured simultaneously. Four colour filters from Thorlabs with central wavelengths of 458, 633, 750, and 905 nm, and with a full width at half maximum of 10 nm were used in the measurements. The part numbers of the four filters are FL457.9-10, FL632.8-10, FB750-10, and FL905-10, and the corresponding transmission curves provided by the manufacturer are shown in Fig. 2d. These wavelengths are close to the band wavelengths of many space sensors for the Moon. Since the sensitivity of the CCD detector is wavelength dependent, to ensure data measured with different filters and at different viewing angles have acceptable signal-to-noise ratios, a proper exposure time for each band needs to be found. A 5 × 5 inch Labsphere Spectralon square plaque with a nominal reflectance of 99% in the visible was used as the reference standard. Figure 3 shows the measured digital numbers (DNs) of the Spectralon plaque at i = 45°, e = 0° as a function of exposure time for the four bands and the linear regression results. Obviously, the linearity of the system is excellent. The 633 and 458 nm bands have the strongest and weakest responses, respectively. Based on the response curves and the saturation threshold of the detector, the exposure time was set to 100 s for all bands and for both samples and the Spectralon plaque.
During the measurements, the incidence zenith angle was fixed at 45°, and the nine viewing zenith angles, varied from 35° to −55° in the principal plane, are listed in Table 1. The size of the illumination spot is fixed at about 7.5 cm wide and 9.5 cm long. A digital protractor was used to help position the CCD camera and the incident beam. At each measurement position, the Spectralon plaque was measured first with the four filters and then the samples with identical viewing configurations. The positions of the sample plate and the camera were fixed for different filters and hence the sample positions within the images remain the same for all bands. The relative reflectance used for colour-ratio analysis wasobtained by dividing the signal from the sample by that from the Spectralon plaque measured at the same viewing angle and with the same filter. A dark-frame was subtracted for all the signals before the ratioing process.
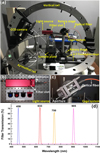 |
Fig. 2 Experimental setup of photometric imaging system used in this study. Panel a: layout of the whole imaging system. The upside-down beaker on the sample plate is to protect the samples and is removed during measurement. Panel b: enlarged view of the light source showing how the filters were installed during measurement. Panel c: details of the cage system that were used to fix the fiber and to adjust the size of the light spot. Panel d: transmission spectra of the four filters used in this study. |
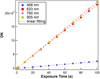 |
Fig. 3 CCD response tests of the four bands. Measured DN values of the Spectralon plaque at i = 45°, e = 0° versus exposure time. |
Measurement configurations.
3 Results
Figure 4 shows the sample reflectance images at wavelength 633 nm obtained under four typical viewing angles (e = 35°, 0°, − 30°, and − 55°). These four minerals clearly show albedo differences, with PLG being the brightest and ILM the darkest. There is a slight albedo increase with decreased particle size for the OLV, OPX, and PLG.
Figure 5 shows that the colour-ratio images of R905/R750 measured at nine different viewing angles (Table 1). This colour ratio and similar ones (e.g. R950/R750) are often used to characterise the lunar surface composition using remote sensing spectral data thanks to the absorption band near 1000 nm of mafic minerals. We can see that the ratio values are strongly dependent on mineral types and viewing angles. The dark ILM samples have the highest ratio values (reddest in the image) and the OPX samples show the lowest ratio values (bluest in the image). The ratio values of OLV and OPX are smaller than 1, and those of the PLG samples are close to 1. Overall, the ratio values of all four mineralsamples clearly show a phase-reddening effect (e.g. Johnson et al. 2013; Schröder et al. 2014), meaning that the ratio increases as the phase angle increases. The ratios of all four mineral samples increase slightly as particle size decreases. In general, the order of the ratio values from high to low is: ILM, PLG, OLV, and OPX.
Figures 6 and 7 show colour-ratio images of R905/R633 and R905/R458, respectively. Compared to R905/R750, both R905/R633 and R905/R458 show similar phase-angle and size-distribution dependences for all four minerals. R905/R633 also shows similar high-to-low orders of ratio values of the four minerals (i.e. ILM>PLG>OLV>OPX), whereas the R905/R458 values of the OLV become even smaller than that of the OPX at some viewing angles (Fig. 7). Overall,the differences between OLV and OPX’s ratio images decrease progressively from R905/R750 to R905/R458.
Figures 5–7 show that in the forward scattering direction (with more negative viewing zenith angle e), ILM can be easily distinguished from silicate minerals using any one of the three colour ratios, whereas the contrasts among the three silicates are smaller, especially for the finest samples (top rows in each image). Figures 8 and 9 show the colour-ratio images of R750/R633 and R750/R458 measured at nine different viewing angles, respectively. Colour ratios with similar band assignments of R750/R458 are often used to estimate the titanium content of the lunar surface using remote sensing datasets (e.g. Charette et al. 1974; Johnson et al. 1991a,b; Blewett et al. 1997; Lucey et al. 2000b; Gillis-Davis et al. 2006; Sato et al. 2017). For R750/R633, only the ILM samples show slight phase-reddening effects, whereas those of the OLV, OPX, and PLG show no clear differences at different viewing angles. The R750/R633 values of the OPX and PLG are quite close to 1, and those of the OLV vary between 0.8 and 1. For R750/R458, the PLG and OLV samples show similar values close to 1 at all nine viewing angles. The R750/R458 values of the OPX are much larger than those of the PLG and OLV, and even larger than those of the ILM, except for the finest sample.
Figure 10 shows the colour-ratio images of R633/R458 obtained at nine different viewing angles. The PLG and OLV have similar ratio values close to 1 for all particle sizes and viewing angles. Overall, the OPX samples have the highest ratio values except for the finest sample, while the finest ILM has the highest ratio value. The phase-angle effect on R633/R458 values seems to be non-monotonic. For example, with the phase angle increases, the ratio values of the OPX first increase and then decrease.
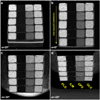 |
Fig. 4 Four typical sample images under different viewing angles at wavelength 633 nm. The incident zenith is fixed at 45°. The sample positions are the same as those shown in Fig. 1. The relative reflectance values of pixels in all images have the same scale. |
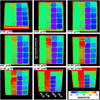 |
Fig. 5 Colour-ratio images of R905/R750 measured at nine different viewing zenith angles with a fixed incident angle of 45°. The viewing angles and phase angles are given in each image. All ratio images are stretched from 0.5 to 1.5 with pixel values smaller than 0.5 and larger than 1.5 set to 0.5 and 1.5, respectively. The pixels outside the sample area are masked. |
4 Discussion
4.1 Phase-angle dependence of the colour ratio
Our experimental results indicate that the colour ratios are dependent on phase angles, and this dependence is related to mineral types and the spectral bands chosen. As shown in Figs. 5–10, the colour-ratio images of all four minerals change with differing viewing angles. For R905/R750, R905/R633, and R905/R458, their values rise with phase-angle increases. The phase-reddening effect can be better perceived when the average colour ratios are plotted against the phase angle, as shown in Fig. 11. Among the four minerals, ILM has the largest increase in ratio values at a larger phase angle, whereas PLG has the smallest increase. Figure 12 shows the colour ratios normalised at a phase angle at 25° for the three silicates. For R905/R750, R905/R633, and R905/R458, the ratio values of PLG and OLV monotonically increase with increased phase angle, whereas that of the OPX first decreases and then increases with a minimum value around a phase angle at 35°.
The R633/R458 and R750/R458 ratios (Figs. 12e and f) for all three silicates (OLV, OPX, PLG) show arc shapes with the maximum values appear at phase angles from 45–65° and 60–80°, respectively.This non-monotonic arc shape is similar to the measurement results of Adams & Filice (1967) on silicate rocks, and of Johnson et al. (2013) on Apollo 11 and 16 soil samples, where the maximum ratio values occurred at varied phase angles. Besides the spectral bands chosen, the incidence angle may also affect the phase angle at the maximum of the arc (Schröder et al. 2014). The curves of the ILM are too oscillating to show a clear pattern, possibly caused by the low response of the 458 nm band of the CCD camera and the low albedo of the ILM samples.
Previous studies based on remote observations have shown that the colour ratio for visible bands of the lunar surface has a non-monotonic phase-angle behaviour, with the maximum value at a phase angle of 50° (e.g. Shkuratov et al. 2011; Kaydash et al. 2010). The in-situ measurements of the lunar regolith conducted by the Chang’E-3 mission also showed such a non-monotonic behaviour (Jin et al. 2015). However, it is worth noting that the spectral bands assigned for ratios in those studies are mainly in the visible: for example, R600/R400 or R700/R400. The colour ratios R633/R458 and R750/R458 for silicates measured in this work have a similar non-montonic behaviour, whereas the other ratios are different.
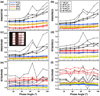 |
Fig. 11 Average colour ratios versus phase angles: (a) R905/R750; (b) R905/R633; (c) R905/R458; (d) R750/R633; (e) R750/R458; (f) R633/R458. The number markers 1 to 5 that represent particle size distributions are indicated in (b). The ratio curves are obtained by averaging the ratio values of pixels of a region of interest (ROI) within the sample area for each sample. The inset in (c) shows an example of how the ROIs were chosen for measurement at e = 0°. The ROI shape changes with the variation of viewing angles because the square sample boxes will look like trapezoids at a viewingangle far from nadir. We note that some of the curves are too close to show the number markers. |
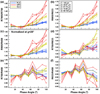 |
Fig. 12 Same as Fig. 11, but for the three silicates, and all colour ratios are normalised at g = 25° |
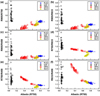 |
Fig. 13 Colour ratios versus albedo (R750) for all four minerals and all viewing zenith angles. Panel a: R905/R750; panel b: R905/R633; panel c: R905/R408; panel d: R750/R633; panel e: R750/R458; panel f: R633/R458. The ratio and albedo values of each data point are the average ratio and albedo values of the ROI within the sample area, which is the same as in Fig. 11. |
4.2 Effects of particle size on colour ratio
As shown inFigs. 11 and 12, particle sizes (size fractions in this work ranging from <45 μm to 90–105 μm) appear to have no significant effect on the phase-angle dependence of the colour ratios. Though it can affect the absolute ratio values, there is no clear trend to describe this effect as the ratio phase curves occasionally cross each other (Figs. 11 and 12). The effect of particle size distribution on the absolute values of the colour ratios is dependent on mineralogy and the spectral bands chosen for ratios. For instance, finer ILM and OPX samples tend to have higher ratio values for R905/R750, R905/R633, and R905/R458. However, for OPX’s ratios of R750/R633, R750/R458,and R633/R458, the coarser samples tend to have higher ratio values. Among the four minerals, all colour ratios of the PLG are least sensitive to the particle size (Figs. 11 and 12).
4.3 The relationship between colour ratio and albedo
Since the four minerals have distinct albedo values, it would be interesting to look at the dependence of the colour ratio on the surface albedo. We plot all six colour ratios versus the surface alebdos (represented by the relative reflectance at 750 nm) in Fig. 13. Obviously, the very dark ILM samples are very different from the silicate samples. With a nearly constant albedo value of ~0.05 for all viewing angles and particle sizes, the ILM’s six colour ratios vary from 1.0 to 6.2. For the three silicates, their ratio values either have a positive (R905/R750, R905/R633, and R905/R458) or negative (R750/R633, R750/R458, and R633/R750) correlation with the albedo.
The albedo differences of each silicate mineral are caused by variations in particle size and measurement angles. The albedo changes of the ILM are very small, which may be attributed to the fact that light scattered from dark ILM samples is mainly contributed by single scattering and surface reflection (Yang et al. 2019). In contrast, the transparent or semi-transparent silicate samples have much stronger multiple scatterings and internal reflections, which can be significantly affected by particle size and observation angles (Yang et al. 2019).
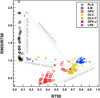 |
Fig. 14 R905/R750 versus albedo (R750) for samples with different weathering degrees. Besides the four minerals (PLG, ILM, OPX, and OLV) measured in this work, we also incorporated the data of olivine (OLV-Y) used by Yang et al. (2017), orthopyroxene (OPX-J), and the lunar regolith simulant (LRS) used by Jiang et al. (2019). The OLV-Y, OPX-J, and LRS all have a particle size distribution of <45 μm and have undergone different degrees of weathering simulated using a pulse laser irradiation system. The unirradiated samples of the OLV-Y and OPX-J have the same bulk compositions as the OLV and OPX used in this work. The LRS sample is a JSC-1A (McKay et al. 1994) lunar regolith simulant sieved to <45 μm. The spectra of the OLV-Y, OPX-J, and LRS were measured under a bi-conical configuration with (i, e, g) = (~45°, ~45°, ~90°). |
4.4 Implicatons for lunar remote sensing
The combination of the colour ratio and its phase-angle dependence can help distinguish the surface compositions. Among the six colour ratios studied in this work, R905/R750, R905/R633, and R905/R458 are more useful in differentiating the ILM from other minerals. Since the ILM has a reflectance peak around 1 μm (Jiang et al. 2019; Isaacson et al. 2011), the reflectance value at 905 nm is higher than that at other bands, resulting in a ratio value larger than 1. In contrast, both olivine and pyroxene have strong absorption bands around 1 μm caused by the transition element Fe in these minerals, and thus the R905 is smaller than that of the other bands. All the ratio values of PLG are close to 1, because its spectrum is relatively flat at these bands due to the lack of Fe (Yang et al. 2019).
It is well known that space weathering processes can darken and redden the spectra of materials on the lunar surface (Pieters et al. 1993). According to Robinson & Lucey (1997), for the ultraviolet/visible (R355/R554) colour ratio, adding opaque minerals (e.g. ilmenite) will result in a changing trend perpendicular to the trend caused by space weathering and increased ferrous iron. Therefore, it is important to understand how space weathering would affect the other colour-ratio-albedo (e.g. R950/R750) trends of silicate materials. If space-weathered silicates show similar ratio-albedo trends to those shown in Fig. 13, the colour ratio would be useful in distinguishing high-Ti and low-Ti units. On the other hand, if space weathering mimicked the effects of adding ilmenite to silicate materials, the colour-ratio method would be less effective in planetary remote-sensing applications.
To answer this question, we used OLV and OPX samples irradiated by a pulse laser to simulate the micrometeorite bombardment weathering process (Yang et al. 2017; Jiang et al. 2019). Figure 14 shows the ratio R905/R750 for the samples mentioned above as a function of the albedo (represented by R750). Except for the four minerals measured in this study, the data of samples with different levels of laser irradiations from Yang et al. (2017) (OLV-Y) and Jiang et al. (2019) (OPX-J, LRS) are also plotted. The unirradiated OLV-Y and OPX-J samples have the same bulk composition as the OLV and OPX used in this study. For OLV-Y and OPX-J, with the increase of simulated weathering degrees, the albedos decrease and the R905/R750 values increase. This is similar to the behaviour of R950/R750 versus R750 for returned lunar soils (e.g. Lucey et al. 2000a).
Figure 14 clearly shows that the ratio-albedo trend of the silicates that underwent irradiation does not follow that of the unirradiated silicate materials, but appears to approach the ratio-albedo trend of the ILM. This could be caused by the fact that the content of reduced nanophase iron (npFe0) increases upon irradiations (Yang et al. 2017). Therefore, space weathering could reduce the colour ratio contrast between ilmente and silicates. We note that the spectra of the irradiated samples were measured under a bi-conical configuration with the average phase angle close to 90°. Our laboratory measurements (Fig. 11) indicate that the ILM has much higher ratio values at large phase angles, and hence it would still be possible to distinguish the high-Ti unit from other units using a colour ratio measured at large phase angles.
To demonstrate the implications of colour-ratio analysis combined with its phase-angle dependence for lunar remote sensing, we selected a basalt unit located in the northern Mare Imbrium as an example (Fig. 15a). The selected area is close to the Chang’E-3 landing site and located at the boundary between a young high-Ti and an old low-Ti basalt units (Zhang et al. 2015; Sato et al. 2017). We selected images measured at three different phase angles by the Kaguya MI (Figs. 15c–e), and the R900/R750 ratio images are shown in Figs. 15f–h. One can see that the same high-Ti area has much higher ratio values at a phase angle ~60° (Fig. 15h) than at ~45° (Figs. 15f and g), which is consistent with our experimental results shown in Fig. 13. This has demonstrated the promising future applications of the combined analysis of the colour ratio and its phase dependence.
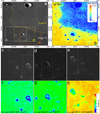 |
Fig. 15 Implication of phase-colour-ratio analysis on a typical lunar mare unit in northern Mare Imbrium. Panel a: image obtained by LROC WAC1 with the dashed line indicating the boundary between high-Ti and low-Ti regions. Panel b: TiO2 abundance map of panel a derived from the LROC WAC data by Sato et al. (2017). Panels c–e: images taken by the Kaguya MI2 (data IDs: MV A_2B2_01_02042N443E3396, MV A_ 2B2_01_03874N443E3400, and MV A_2B2_01_04540N441E3402) at different measurement angles with their locations marked out using boxes in panel a. Panel f-h: colour-ratio images of R900/R750 corresponding to panels c–e, respectively. The incidence (i), viewing (e), and phase (g) angles are given at the bottom of panels f–h, respectively. The dashed boxes in panel c–h indicate the overlapped regions of these images. |
5 Conclusions
We studied the effects of mineral type, phase angle, particle size, and degree of maturity on the performance of colour ratios, and we obtain the following results:
- (1)
The colour ratios are dependent on phase angles, and the phase behaviours are mainly determined by the mineral type and spectralbands assigned for the ratios. Particle size may affect the absolute ratio values but has a limited effect on the phase dependence of colour ratios studied here.
- (2)
Increased maturity has resulted in a similar colour-ratio (R905/R750) value for silicate materials and ilmenite, and conducting measurements at larger phase angles may help enhance the colour ratio contrast between high-Ti and low-Ti materials on the lunarsurface.
- (3)
With a priori knowledge of the phase behaviours of colour ratios of different lunar-type minerals, we can find the best combinationof the colour ratio and phase angle to distinguish the compositions of a target surface. For instance, it is easier to map the high-Ti unit using the colour ratio for data obtained at large phase angles.
Future lab work on mixtures (e.g. synthetic mineral mixtures and natural basalt samples) may further improve our understanding of the use of colour ratios. Applying this method to more typical lunar units may also help to refine the this colour ratio–phase angle analysis method.
Acknowledgements
This work was supported by the Strategic Priority Research Program of Chinese Academy of Sciences (XDB41000000), the National Natural Science Foundation of China (11773023, 11941001, 42002306, 42072337), the Civil Aerospace Pre-research Project (D020201, D020302, D020204), and the Beijing Municipal Science and Technology Commission (Z181100 002918003). Y.Z.Y. also acknowledges the support from the China Postdoctoral Science Foundation (2019TQ0323). We are grateful to an anonymous reviewer and the editor for their in-depth comments, edits, and suggestions that greatly improved the quality of the manuscript.
References
- Adams, J. B., & Filice, A. L. 1967, J. Geophys. Res., 72, 5705 [CrossRef] [Google Scholar]
- Besse, S., Sunshine, J., Staid, M., et al. 2013, Icarus, 222, 229 [CrossRef] [Google Scholar]
- Blewett, D., Hawke, B., Lucey, P., & Spudis, P. 1995, Lunar Planet. Sci. Conf., 26 [Google Scholar]
- Blewett, D. T., Lucey, P. G., Hawke, B. R., & Jolliff, B. L. 1997, J. Geophys. Res. Planets, 102, 16319 [NASA ADS] [CrossRef] [Google Scholar]
- Carrier III, W. D. 2003, J. Geotech. Geoenviron. Eng., 129, 956 [CrossRef] [Google Scholar]
- Charette, M. P., McCord, T. B., Pieters, C., & Adams, J. B. 1974, J. Geophys. Res., 79, 1605 [NASA ADS] [CrossRef] [Google Scholar]
- Clegg-Watkins, R., Jolliff, B., Boyd, A., et al. 2016, Icarus, 273, 84 [CrossRef] [Google Scholar]
- Clegg-Watkins, R., Jolliff, B., Watkins, M., et al. 2017, Icarus, 285, 169 [CrossRef] [Google Scholar]
- Coburn, C., & Peddle, D. 2006, Can. J. Remote Sens., 32, 244 [CrossRef] [Google Scholar]
- Gillis-Davis, J. J., Lucey, P. G., & Hawke, B. R. 2006, Geochim. Cosmochim. Acta, 70, 6079 [CrossRef] [Google Scholar]
- Gradie, J., Veverka, J., & Buratti, B. 1980, Lunar Planet. Sci. Conf., 11, 799 [Google Scholar]
- Hapke, B. 1981, J. Geophys. Res. Solid Earth, 86, 3039 [NASA ADS] [CrossRef] [Google Scholar]
- Hapke, B., Denevi, B., Sato, H., Braden, S., & Robinson, M. 2012, J. Geophys. Res. Planets, 117 [Google Scholar]
- Heiken, G. H., Vaniman, D. T., & French, B. M. 1991, Lunar Sourcebook, a user’s guide to the Moon (Cambridge: Cambridge University Press) [Google Scholar]
- Isaacson, P. J., Sarbadhikari, A. B., Pieters, C. M., et al. 2011, Meteorit. Planet. Sci., 46, 228 [CrossRef] [Google Scholar]
- Jeong, M., Kim, S. S., Garrick-Bethell, I., et al. 2015, ApJS, 221, 16 [CrossRef] [Google Scholar]
- Jiang, T., Zhang, H., Yang, Y., et al. 2019, Icarus, 331, 127 [CrossRef] [Google Scholar]
- Jin, W., Zhang, H., Yuan, Y., et al. 2015, Geophys. Res. Lett., 42, 8312 [NASA ADS] [CrossRef] [Google Scholar]
- Johnson, J. R., Larson, S. M., & Singer, R. B. 1991a, Geophys. Res. Lett., 18, 2153 [CrossRef] [Google Scholar]
- Johnson, J. R., Larson, S. M., & Singer, R. B. 1991b, J. Geophys. Res. Planets, 96, 18861 [CrossRef] [Google Scholar]
- Johnson, J. R., Shepard, M. K., Grundy, W. M., Paige, D. A., & Foote, E. J. 2013, Icarus, 223, 383 [NASA ADS] [CrossRef] [Google Scholar]
- Kaydash, V., Gerasimenko, S. Y., Shkuratov, Y. G., et al. 2010, Sol. Syst. Res., 44, 267 [NASA ADS] [CrossRef] [Google Scholar]
- Lin, H., Yang, Y., Lin, Y., et al. 2020, A&A, 638, A35 [CrossRef] [EDP Sciences] [Google Scholar]
- Lucey, P. G., Taylor, G. J., & Malaret, E. 1995, Science, 268, 1150 [NASA ADS] [CrossRef] [Google Scholar]
- Lucey, P. G., Blewett, D. T., & Hawke, B. R. 1998, J. Geophys. Res. Planets, 103, 3679 [NASA ADS] [CrossRef] [Google Scholar]
- Lucey, P. G., Blewett, D. T., Taylor, G. J., & Hawke, B. R. 2000a, J. Geophys. Res. Planets, 105, 20377 [NASA ADS] [CrossRef] [Google Scholar]
- Lucey, P. G., Blewett, D. T., & Jolliff, B. L. 2000b, J. Geophys. Res.: Planets, 105, 20297 [NASA ADS] [CrossRef] [Google Scholar]
- McCord, T. B. 1969, J. Geophys. Res., 74, 3131 [CrossRef] [Google Scholar]
- McEwen, A. 1996, Lunar Planet. Sci. Conf., 27 [Google Scholar]
- McKay, D. S., Carter, J. L., Boles, W. W., Allen, C. C., & Allton, J. H. 1994, Engineering, construction, and operations in space IV (American Society of Civil Engineers), 2, 857 [Google Scholar]
- Melendrez, D. E., Johnson, J. R., Larson, S. M., & Singer, R. B. 1994, J. Geophys. Res.: Planets, 99, 5601 [CrossRef] [Google Scholar]
- Pieters, C. M. 1983, J. Geophys. Res.: Solid Earth, 88, 9534 [NASA ADS] [CrossRef] [Google Scholar]
- Pieters, C. M., Fischer, E. M., Rode, O., & Basu, A. 1993, J. Geophys. Res. Planets, 98, 20817 [NASA ADS] [CrossRef] [Google Scholar]
- Rava, B., & Hapke, B. 1987, Icarus, 71, 397 [NASA ADS] [CrossRef] [Google Scholar]
- Robinson, M. S., & Lucey, P. G. 1997, Science, 275, 197 [NASA ADS] [CrossRef] [Google Scholar]
- Sanchez, J. A., Reddy, V., Nathues, A., et al. 2012, Icarus, 220, 36 [NASA ADS] [CrossRef] [Google Scholar]
- Sato, H., Robinson, M., Hapke, B., Denevi, B., & Boyd, A. 2014, J. Geophys. Res. Planets, 119, 1775 [NASA ADS] [CrossRef] [Google Scholar]
- Sato, H., Robinson, M. S., Lawrence, S. J., et al. 2017, Icarus, 296, 216 [CrossRef] [Google Scholar]
- Schröder, S. E., Grynko, Y., Pommerol, A., et al. 2014, Icarus, 239, 201 [NASA ADS] [CrossRef] [Google Scholar]
- Shkuratov, Y., Kaydash, V., Korokhin, V., et al. 2011, Planet. Space Sci., 59, 1326 [NASA ADS] [CrossRef] [Google Scholar]
- Wu, Y., Besse, S., Li, J.-Y., et al. 2013, Icarus, 222, 283 [CrossRef] [Google Scholar]
- Yang, Y., Zhang, H., Wang, Z., et al. 2017, A&A, 597, A50 [CrossRef] [EDP Sciences] [Google Scholar]
- Yang, Y., Li, S., Milliken, R. E., et al. 2019, J. Geophys. Res. Planets, 124, 31 [Google Scholar]
- Yang, Y., Lin, H., Liu, Y., et al. 2020, Geophys. Res. Lett., 47, e2020GL087080 [Google Scholar]
- Yokota, Y., Matsunaga, T., Ohtake, M., et al. 2011, Icarus, 215, 639 [NASA ADS] [CrossRef] [Google Scholar]
- Zhang, H., Yang, Y., Yuan, Y., et al. 2015, Geophys. Res. Lett., 42, 6945 [CrossRef] [Google Scholar]
Data downloaded from https://quickmap.lroc.asu.edu/
Data downloaded from https://darts.isas.jaxa.jp/planet/pdap/selene/dataset_search.html
All Tables
All Figures
|
Fig. 1 Picture and reflectance spectra of samples used in this study. Panel a: sample images: from left to right, the four columns are PLG, ILM, OPX, and OLV samples with different particle sizes, respectively. Samples in the same row have the same size distribution; for instance, the four samples in the top row all have a size distribution of <45 μm. Panel b: reflectance spectra of the four mineral samples with a particle size distribution of 61–74 μm measured at i = 30°, e = 0°, g = 30°. The dashed lines indicate the central wavelengths of the four filters used in this study. The inset plot shows the enlarged view of the ILM spectrum, which has a reflectance peak around 850 nm. |
| In the text | |
|
Fig. 2 Experimental setup of photometric imaging system used in this study. Panel a: layout of the whole imaging system. The upside-down beaker on the sample plate is to protect the samples and is removed during measurement. Panel b: enlarged view of the light source showing how the filters were installed during measurement. Panel c: details of the cage system that were used to fix the fiber and to adjust the size of the light spot. Panel d: transmission spectra of the four filters used in this study. |
| In the text | |
|
Fig. 3 CCD response tests of the four bands. Measured DN values of the Spectralon plaque at i = 45°, e = 0° versus exposure time. |
| In the text | |
|
Fig. 4 Four typical sample images under different viewing angles at wavelength 633 nm. The incident zenith is fixed at 45°. The sample positions are the same as those shown in Fig. 1. The relative reflectance values of pixels in all images have the same scale. |
| In the text | |
|
Fig. 5 Colour-ratio images of R905/R750 measured at nine different viewing zenith angles with a fixed incident angle of 45°. The viewing angles and phase angles are given in each image. All ratio images are stretched from 0.5 to 1.5 with pixel values smaller than 0.5 and larger than 1.5 set to 0.5 and 1.5, respectively. The pixels outside the sample area are masked. |
| In the text | |
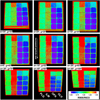 |
Fig. 6 Same as Fig. 5, but for colour ratio of R905/R633. |
| In the text | |
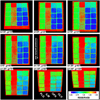 |
Fig. 7 Same as Fig. 5, but for colour ratio of R905/R458. |
| In the text | |
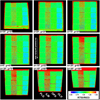 |
Fig. 8 Same as Fig. 5, but for colour ratio of R750/R633. |
| In the text | |
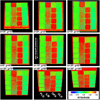 |
Fig. 9 Same as Fig. 5, but for colour ratio of R750/R458. |
| In the text | |
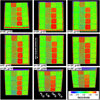 |
Fig. 10 Same as Fig. 5, but for colour ratio of R633/R458. |
| In the text | |
|
Fig. 11 Average colour ratios versus phase angles: (a) R905/R750; (b) R905/R633; (c) R905/R458; (d) R750/R633; (e) R750/R458; (f) R633/R458. The number markers 1 to 5 that represent particle size distributions are indicated in (b). The ratio curves are obtained by averaging the ratio values of pixels of a region of interest (ROI) within the sample area for each sample. The inset in (c) shows an example of how the ROIs were chosen for measurement at e = 0°. The ROI shape changes with the variation of viewing angles because the square sample boxes will look like trapezoids at a viewingangle far from nadir. We note that some of the curves are too close to show the number markers. |
| In the text | |
|
Fig. 12 Same as Fig. 11, but for the three silicates, and all colour ratios are normalised at g = 25° |
| In the text | |
|
Fig. 13 Colour ratios versus albedo (R750) for all four minerals and all viewing zenith angles. Panel a: R905/R750; panel b: R905/R633; panel c: R905/R408; panel d: R750/R633; panel e: R750/R458; panel f: R633/R458. The ratio and albedo values of each data point are the average ratio and albedo values of the ROI within the sample area, which is the same as in Fig. 11. |
| In the text | |
|
Fig. 14 R905/R750 versus albedo (R750) for samples with different weathering degrees. Besides the four minerals (PLG, ILM, OPX, and OLV) measured in this work, we also incorporated the data of olivine (OLV-Y) used by Yang et al. (2017), orthopyroxene (OPX-J), and the lunar regolith simulant (LRS) used by Jiang et al. (2019). The OLV-Y, OPX-J, and LRS all have a particle size distribution of <45 μm and have undergone different degrees of weathering simulated using a pulse laser irradiation system. The unirradiated samples of the OLV-Y and OPX-J have the same bulk compositions as the OLV and OPX used in this work. The LRS sample is a JSC-1A (McKay et al. 1994) lunar regolith simulant sieved to <45 μm. The spectra of the OLV-Y, OPX-J, and LRS were measured under a bi-conical configuration with (i, e, g) = (~45°, ~45°, ~90°). |
| In the text | |
|
Fig. 15 Implication of phase-colour-ratio analysis on a typical lunar mare unit in northern Mare Imbrium. Panel a: image obtained by LROC WAC1 with the dashed line indicating the boundary between high-Ti and low-Ti regions. Panel b: TiO2 abundance map of panel a derived from the LROC WAC data by Sato et al. (2017). Panels c–e: images taken by the Kaguya MI2 (data IDs: MV A_2B2_01_02042N443E3396, MV A_ 2B2_01_03874N443E3400, and MV A_2B2_01_04540N441E3402) at different measurement angles with their locations marked out using boxes in panel a. Panel f-h: colour-ratio images of R900/R750 corresponding to panels c–e, respectively. The incidence (i), viewing (e), and phase (g) angles are given at the bottom of panels f–h, respectively. The dashed boxes in panel c–h indicate the overlapped regions of these images. |
| In the text | |
Current usage metrics show cumulative count of Article Views (full-text article views including HTML views, PDF and ePub downloads, according to the available data) and Abstracts Views on Vision4Press platform.
Data correspond to usage on the plateform after 2015. The current usage metrics is available 48-96 hours after online publication and is updated daily on week days.
Initial download of the metrics may take a while.