Fig. 11
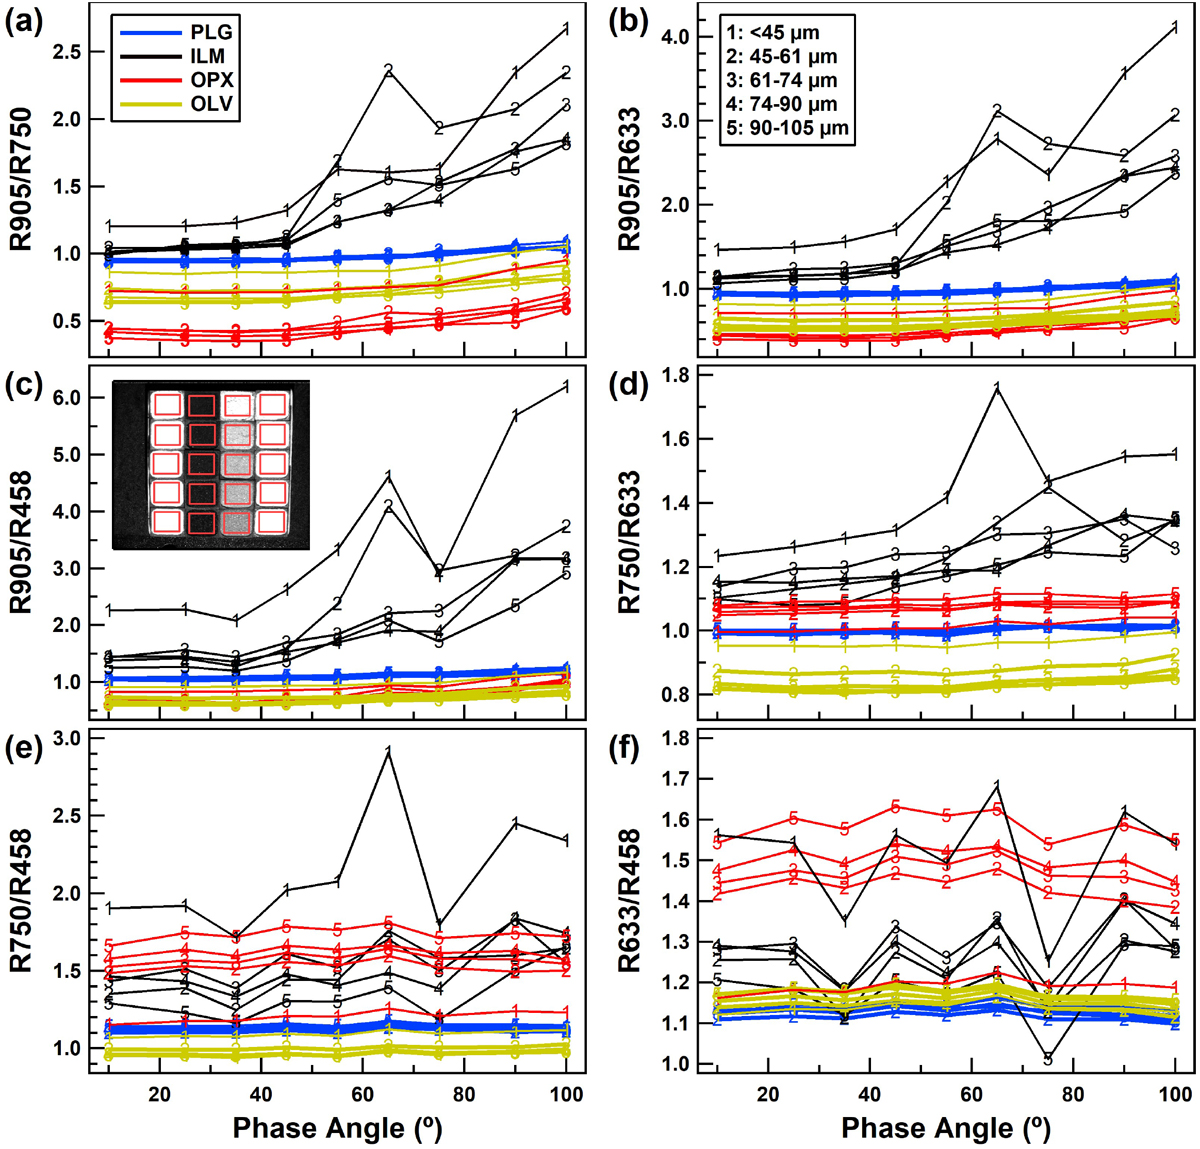
Average colour ratios versus phase angles: (a) R905/R750; (b) R905/R633; (c) R905/R458; (d) R750/R633; (e) R750/R458; (f) R633/R458. The number markers 1 to 5 that represent particle size distributions are indicated in (b). The ratio curves are obtained by averaging the ratio values of pixels of a region of interest (ROI) within the sample area for each sample. The inset in (c) shows an example of how the ROIs were chosen for measurement at e = 0°. The ROI shape changes with the variation of viewing angles because the square sample boxes will look like trapezoids at a viewingangle far from nadir. We note that some of the curves are too close to show the number markers.
Current usage metrics show cumulative count of Article Views (full-text article views including HTML views, PDF and ePub downloads, according to the available data) and Abstracts Views on Vision4Press platform.
Data correspond to usage on the plateform after 2015. The current usage metrics is available 48-96 hours after online publication and is updated daily on week days.
Initial download of the metrics may take a while.