Fig. 2
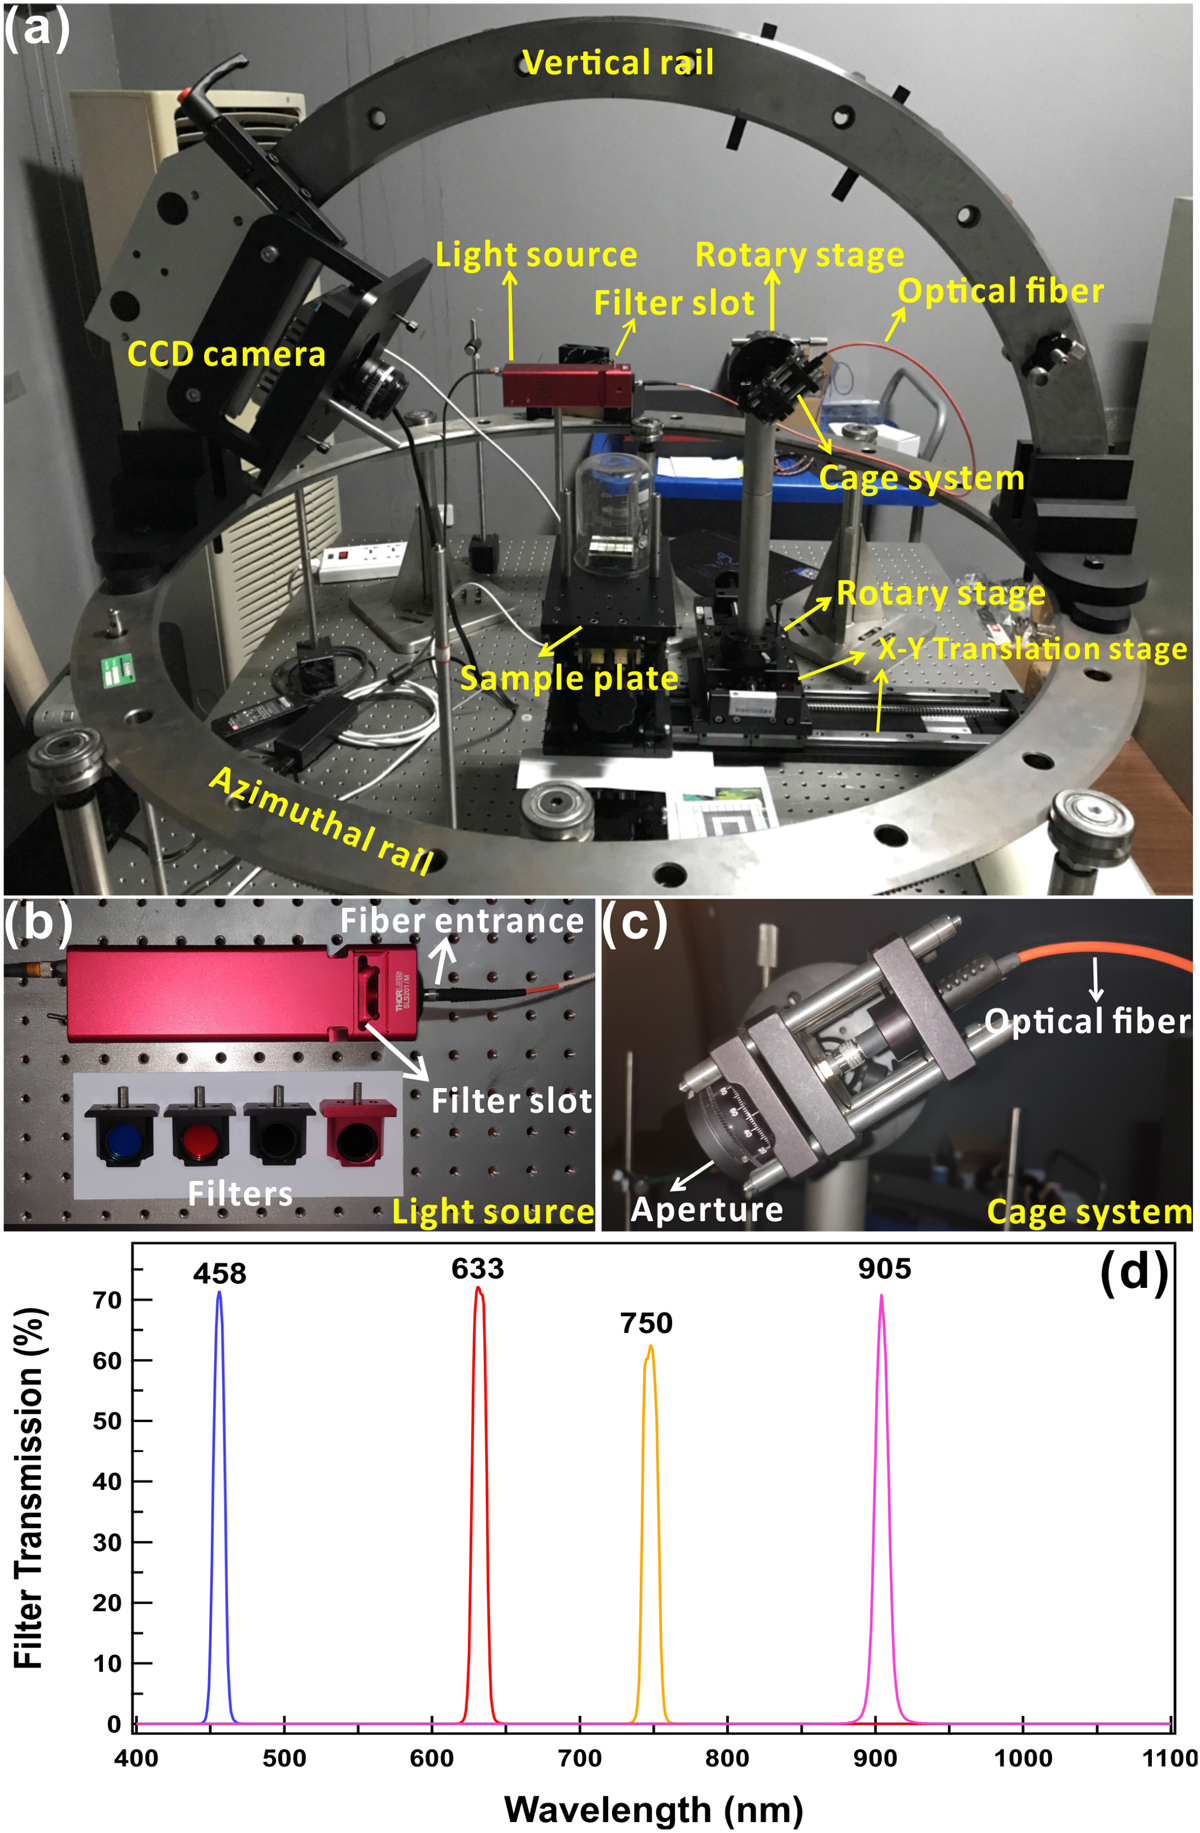
Experimental setup of photometric imaging system used in this study. Panel a: layout of the whole imaging system. The upside-down beaker on the sample plate is to protect the samples and is removed during measurement. Panel b: enlarged view of the light source showing how the filters were installed during measurement. Panel c: details of the cage system that were used to fix the fiber and to adjust the size of the light spot. Panel d: transmission spectra of the four filters used in this study.
Current usage metrics show cumulative count of Article Views (full-text article views including HTML views, PDF and ePub downloads, according to the available data) and Abstracts Views on Vision4Press platform.
Data correspond to usage on the plateform after 2015. The current usage metrics is available 48-96 hours after online publication and is updated daily on week days.
Initial download of the metrics may take a while.