Fig. 1
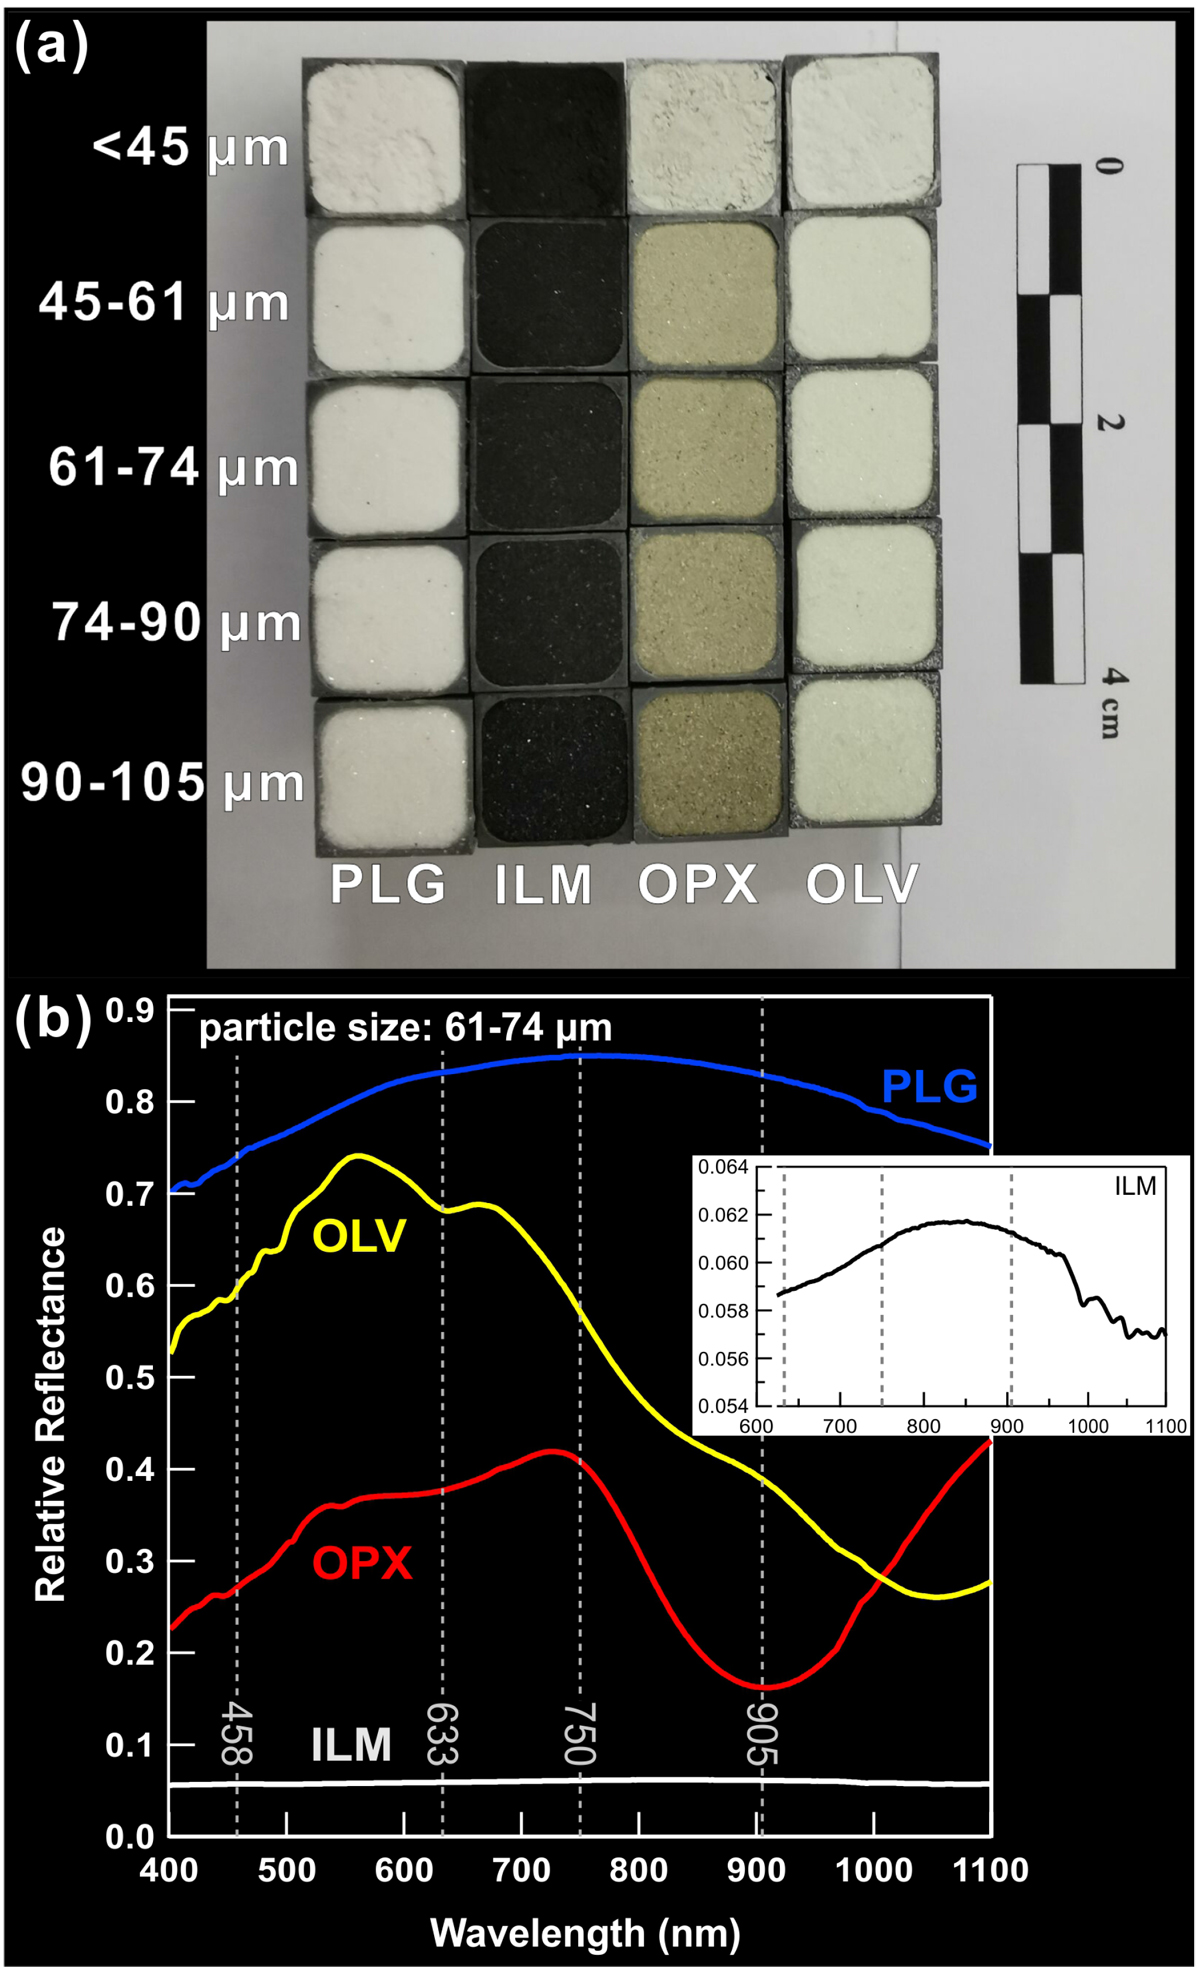
Picture and reflectance spectra of samples used in this study. Panel a: sample images: from left to right, the four columns are PLG, ILM, OPX, and OLV samples with different particle sizes, respectively. Samples in the same row have the same size distribution; for instance, the four samples in the top row all have a size distribution of <45 μm. Panel b: reflectance spectra of the four mineral samples with a particle size distribution of 61–74 μm measured at i = 30°, e = 0°, g = 30°. The dashed lines indicate the central wavelengths of the four filters used in this study. The inset plot shows the enlarged view of the ILM spectrum, which has a reflectance peak around 850 nm.
Current usage metrics show cumulative count of Article Views (full-text article views including HTML views, PDF and ePub downloads, according to the available data) and Abstracts Views on Vision4Press platform.
Data correspond to usage on the plateform after 2015. The current usage metrics is available 48-96 hours after online publication and is updated daily on week days.
Initial download of the metrics may take a while.