Fig. 15
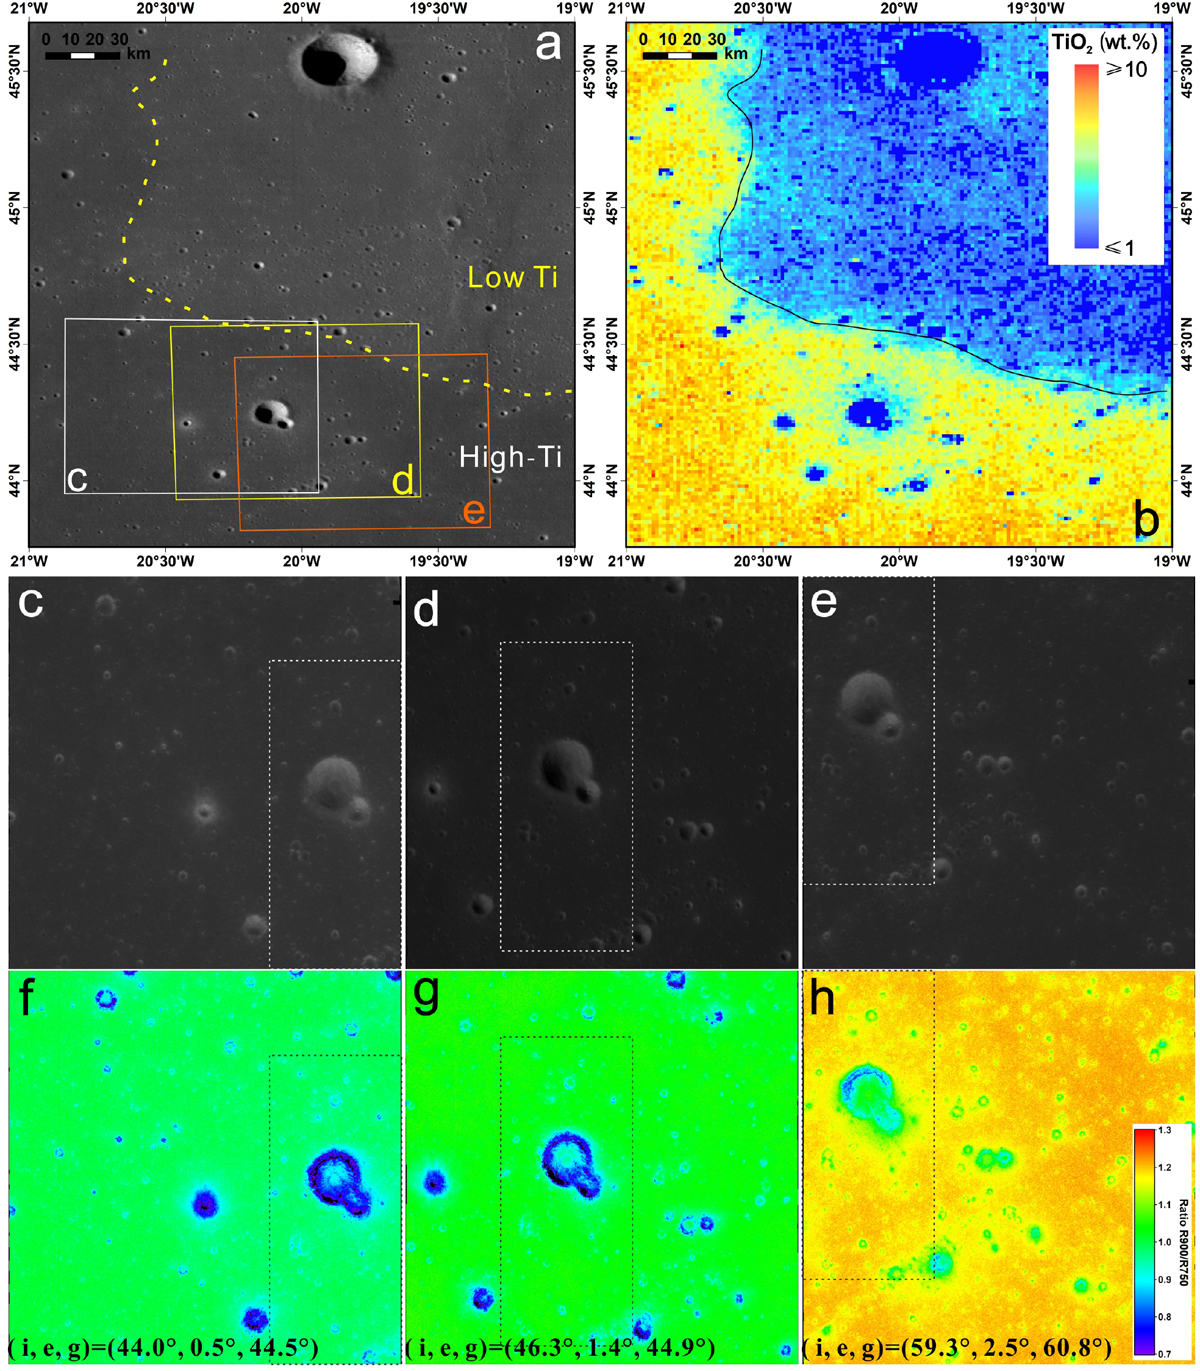
Implication of phase-colour-ratio analysis on a typical lunar mare unit in northern Mare Imbrium. Panel a: image obtained by LROC WAC1 with the dashed line indicating the boundary between high-Ti and low-Ti regions. Panel b: TiO2 abundance map of panel a derived from the LROC WAC data by Sato et al. (2017). Panels c–e: images taken by the Kaguya MI2 (data IDs: MV A_2B2_01_02042N443E3396, MV A_ 2B2_01_03874N443E3400, and MV A_2B2_01_04540N441E3402) at different measurement angles with their locations marked out using boxes in panel a. Panel f-h: colour-ratio images of R900/R750 corresponding to panels c–e, respectively. The incidence (i), viewing (e), and phase (g) angles are given at the bottom of panels f–h, respectively. The dashed boxes in panel c–h indicate the overlapped regions of these images.
Current usage metrics show cumulative count of Article Views (full-text article views including HTML views, PDF and ePub downloads, according to the available data) and Abstracts Views on Vision4Press platform.
Data correspond to usage on the plateform after 2015. The current usage metrics is available 48-96 hours after online publication and is updated daily on week days.
Initial download of the metrics may take a while.