| Issue |
A&A
Volume 644, December 2020
|
|
|---|---|---|
| Article Number | A133 | |
| Number of page(s) | 8 | |
| Section | Interstellar and circumstellar matter | |
| DOI | https://doi.org/10.1051/0004-6361/202038138 | |
| Published online | 11 December 2020 | |
APEX-SEPIA660 Early Science: gas at densities above 107 cm−3 towards OMC-1★,★★
1
Leiden Observatory, Leiden University,
PO Box 9513,
2300
RA Leiden, The Netherlands
e-mail: alvaro.hacar@univie.ac.at
2
Department of Astrophysics, University of Vienna,
Türkenschanzstrasse 17,
1180
Vienna, Austria
3
Anton Pannekoek Institute for Astonomy, University of Amsterdam, The Netherlands
4
Institute of Astronomy and Astrophysics,
Academia Sinica, No.1, Sec. 4, Roosevelt Rd,
Taipei
10617,
Taiwan, Republic of China
5
European Southern Observatory,
Karl Schwarzschild Strasse 2,
85748
Garching, Germany
6
Netherlands Research School for Astronomy (NOVA), Kapteyn Astronomical Institute,
Landleven 12,
9747 AD
Groningen, The Netherlands
7
Astro Space Center of Lebedev Physical Institute,
Profsoyuznaya 84/32,
117997
Moscow,
Russia
8
Netherlands Research School for Astronomy (NOVA), Leiden Observatory, Leiden University,
PO Box 9513,
2300
RA Leiden, The Netherlands
Received:
9
April
2020
Accepted:
26
October
2020
Context. The star-formation rates and stellar densities found in young massive clusters suggest that these stellar systems originate from gas at densities of n(H2) > 106 cm−3. Until today, however, the physical characterization of this ultra high density material remains largely unconstrained in observations.
Aims. We investigate the density properties of the star-forming gas in the OMC-1 region located in the vicinity of the Orion Nebula Cluster (ONC).
Methods. We mapped the molecular emission at 652 GHz in OMC-1 as part of the APEX-SEPIA660 Early Science.
Results. We detect bright and extended N2H+ (J = 7–6) line emission along the entire OMC-1 region. Comparisons with previous ALMA data of the (J = 1–0) transition and radiative transfer models indicate that the line intensities observed in this N2H+ (7–6) line are produced by large mass reservoirs of gas at densities n(H2) > 107 cm−3.
Conclusions. The first detection of this N2H+ (7–6) line at parsec-scales demonstrates the extreme density conditions of the star-forming gas in young massive clusters such as the ONC. Our results highlight the unique combination of sensitivity and mapping capabilities of the new SEPIA660 receiver for the study of the ISM properties at high frequencies.
Key words: ISM: clouds / ISM: molecules / ISM: structure / submillimeter: ISM
The reduced datacubes are only available at the CDS via anonymous ftp to cdsarc.u-strasbg.fr (130.79.128.5) or via http://cdsarc.u-strasbg.fr/viz-bin/cat/J/A+A/644/A133
© ESO 2020
1 Initial gas conditions in massive clusters
Investigating the origin of massive stellar clusters (>104 M⊙, Portegies Zwart et al. 2010) in the Milky Way is of paramount importance in understanding the star-formation process across Cosmic Times (Krumholz et al. 2019). Massive clusters represent the most extreme examples of star formation and the local analogues for the gas conditions at high redshifts (see Longmore et al. 2014). The study of these massive clusters, which are typically located at kpc distances (e.g., towards the Galactic Centre), is limited by sensitivity and resolution effects. Massive clusters form inside highly extinct gas clumps that can only be scrutinized using radio interferometric observations (e.g., Ginsburg et al. 2018). The molecular material in these massive clusters is also quickly disrupted by the strong stellar feedback generated by their active stellar populations. As a result, the initial gas conditions inside massive clusters remain largely unconstrained in observations.
Stellar densities of n(H2) > 106 cm−3 (or >107 M⊙ pc−3) have been identified in massive clusters (Portegies Zwart et al. 2004), which suggests that these clusters originated from gas cloud at even higher densities. Various studies indicate that the molecular precursors of these massive clusters in the Milky Way may present average gas densities of n(H2) ~ 104 cm−3 (e.g., Kauffmann et al. 2017). Super star clusters, such as Arches, are expected to have originated from gas clumps at densities above n(H2) > 106 cm−3 (Walker et al. 2015). These gas densities largely exceed the mean values observed in nearby clouds predicting dramatically different free-fall times ( ) and star-formation rates (SFR
  ) between these regions (see Krumholz et al. 2012; Parmentier 2019). However, while extreme density values are reported for compact hot cores (<0.1 pc) in massive environments (e.g., Genzel et al. 1982), the detection of gas at densities above n(H2) ≳ 107 cm−3 at parsec-scales remains elusive.
The increasing sensitivity of both single-dish and interferometers has popularized the use of N2 H+ as density selective tracer in star formation studies (e.g., Caselli et al. 2002). A combination of excitation and chemical effects (critical density, abundance, and depletion) enhances the emission of this N-bearing molecule in dense environments (> 104 cm−3) with respect to other standard cloud tracers (e.g., CO, HCN, or HCO+) commonly biased towards lower density (~ 103 cm−3) or warm material (TK > 20 K, e.g., Pety et al. 2017). The relatively higher abundances of N2 H+ also makes this molecule a favourable target for observations in comparison with other deuterated isotopologues (e.g., N2 D+) and species (e.g., DCO+). Most studies typically investigate low-frequency transitions of this molecule, such as N2 H+ (1–0) (93 GHz; e.g., Hacar et al. 2018) or N2 H+ (3–2) (279 GHz; e.g., Teng & Hirano 2020), limiting the dynamic range of these observations to densities of n(H2) ≲ 106 cm−3. However, the observation of high-J transitions (J > 4–3) necessary to confirm the existence of gas at higher densities has been largely hampered by the more challenging access to frequencies above >300 GHz.
In this paper we report the first detection of extended N2 H+ (J = 7–6) emission at ~652 GHz in the vicinity of the Orion Nebula Cluster (ONC) mapped with the new SEPIA660 heterodyne receiver (i.e. ALMA Band 9) recently installed at the APEX-12m radiotelescope (Sect. 2). The widespread detection of bright N2 H+ (7–6) emission at scales of >0.5 pc demonstrates the presence of gas at densities n(H2) > 107 cm−3 (Sects. 3 and 4). Our new SEPIA660 observations provide us with the first direct evidence of the presence of large gas reservoirs at extremely high densities during the early evolution of young massive clusters (Sect. 5).
2 New SEPIA660 observations
The ONC is the nearest high-mass star-forming region (D = 414 pc, Menten et al. 2007) and it regularly serves as local template for cluster studies. The ONC is partially embedded in the OMC-1 region, an active star-forming cloud that includes the Orion BN/KL region and that has been widely investigated in the past at large scales using both millimeter single-dish (e.g., Ungerechts et al. 1997) and interferometric observations (e.g., Wiseman & Ho 1998). Highlighting the filamentary nature of this OMC-1 cloud (Martin-Pintado et al. 1990), recent ALMA (Band 3) observations of N2 H+ (J = 1–0) revealed the intrinsic structure of the star-forming gas in this region forming a complex networks of narrow fibers (Hacar et al. 2018). Continuum (e.g., Teixeira et al. 2016) and line measurements (Hacar et al. 2018) in this massive cloud suggest that these fiber structures may present densities significantly larger than those found in low-mass environments (see Hacar et al. 2018, for a discussion). A detailed analysis of the N2 H+ (1–0) hyperfine line opacities and excitation suggest that the density of these fibers reaches values of n(H2) > 107 cm−3 (see Hacar et al. 2018, for a discussion). This hypothesis is supported by the recent detection of extended N2 H+ (3–2) emission towards the entire OMC-1 region (Teng & Hirano 2020).
We have mapped the central part of the OMC-1 region with the new Swedish-ESO PI instrument for APEX (SEPIA; Belitsky et al. 2018) installed at the APEX-12m telescope in Chajnantor (Chile). Our observations used the new SEPIA660 detector, a dual polarization 2SB receiver operating between 578 and 738 GHz (similarly to the ALMA Band 9 receiver) developed by the Netherlands Research School for Astronomy (NOVA) instrumentation group at the Kapteyn Astronomical Institute in Groningen (The Netherlands; Baryshev et al. 2015). Our maps cover the entire OMC-1 region (see Fig. 1), from its northern OMC-1 Ridge to the Orion South proto-clusters, including the Orion BN/KL region (see labels in Fig. 1a). We combine four on-the-fly (OTF) maps covering a total area of ~ 450 × 200 arcsec2, or approximately ~0.9 × 0.4 pc2 in size at the distance of Orion. Each OTF submap, with a typical area of 150 × 150 arcsec2, was obtained in position-switching mode and was executed multiple times combining orthogonal coverages. Our observations were carriedout in August 2019 under excellent weather conditions with a precipitable water vapor (PWV) of ≤ 0.5 mm as part of the NOVA Guaranteed Time (ESO Proj. ID: E-0104.C-0578A-2019)1.
Our study targets two specific lines, namely, N2 H+ (J = 7–6) (652095.865 MHz) and C18 O (J = 6–5) (658 553.278 MHz) (CDMS and VAMDC databases, Müller et al. 2005; Endres et al. 2016), observed simultaneously with a native spectral resolution of 240 kHz (or 0.11 km s−1) thanks to the large instantaneous bandwidth (8 GHz) of the new SEPIA660 receiver connected to an XFFTS backend2. Each molecular species was extracted, reduced, and combined independently using the software GILDAS/CLASS. We convolved our N2 H+ (7–6) and C18 O (6–5) datasets into a uniform Nyquist sampled grid with a final resolution of 10 arcsec. Afterwards, each individual spectrum was baseline-subtracted and calibrated into main beam temperature units (Tmb) assuming a typical main-beam efficiency of ηmb = 0.4 measured in Uranus3.
We display the total integrated intensity of our new SEPIA660 observations along the OMC-1 region in Fig. 1. Remarkably, we clearly detect extended N2 H+ (7–6) emission with a total integrated intensity W(N2H+) > 2.5 K km s−1 showing different cores and fibers along the whole extension of our maps (Fig. 1b). Extremely bright emission peaks, exceeding values of W(N2H+) > 8 K km s−1, are identified at the north of the Orion BN/KL region as well as the Orion South proto-cluster. Additional emission peaks in this N2 H+ (7–6) transition, typically with W(N2H+) ~ 5 K km s−1, are found to be coincident with similar concentrations detected in N2 H+ (1–0) by ALMA (white contours in Fig. 1; see also Fig. 2a). Several of these peaks appear to be connected by a more diffuse N2 H+ (7–6) emission extending north to south along the main spine of the OMC-1 region. Overall, the N2 H+ (7–6) emission is restricted to regions containing high column density material traced in the continuum above N(H2) > 1022 cm−2 (e.g., Lombardi et al. 2014).
In contrast, our C18O (6–5) map shows a clear radial distribution in emission centred at the position of the Orion BN/KL region (Fig. 1c). At its central peak, the C18 O (6–5) emission reaches values of W(C18O) > 100 K km s−1, including prominent line wings associated to the Orion BN/KL outflow (Bally et al. 2011). Bright C18 O (6–5) emission, with W(C18O) > 50 K km s−1, is also observed towards the southern end of the OMC-1 Ridge as well as the northern half of the OMC-1 South proto-cluster. More diffuse but still clearly detected, this emission continues at large scales below N(H2) ~ 1021 cm−2, tracing the warm molecular material around the Orion Nebula in agreement with similar 12CO (J = 4–3) (Ishii et al. 2016) and [CII] (Pabst et al. 2019) observations in this region. Moreover, the C18 O (6–5) emission shows an arc-like structure tracing the edge of the HII region previously detected in H recombination lines (e.g., Hacar et al. 2020). These properties denote the preference of this C18 O (6–5) transition to trace low column density material directly illuminated by the Orion cluster.
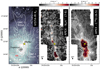 |
Fig. 1 New SEPIA660 observations along the OMC-1 region. From left to right: (a) VISTA-IR Ks band (Meingast et al. 2016); (b) APEX-SEPIA660 N2H+ (7–6); and (c) APEX-SEPIA660 C18O (6–5) maps(this work). All molecular maps are convolved into a common Nyquist grid with a final resolution of 10″. The intensity the H41α emission tracing the extension of the ONC HII nebula (red contours, Hacar et al. 2020) is indicated in the VISTA image. Panels b and c: equally spaced contours (black) every W(N2 H+(7−6)) = 2.5 K km s−1 and W(C18O (6−5)) = 10 K km s−1, respectively. For reference, the position of the Trapezium (white stars) and the Orion BN source (yellow star), as well as the first contour of the N2H+ (1–0) emission (W(N2H+(1−0)) = 1.0 K km s−1, white contour), are displayed in all panels (Hacar et al. 2018, see also Fig. 2a). |
3 Dense gas exposed to the ONC
The observed anticorrelation between N2 H+ and C18O is generatedas part of the chemical evolution of the gas during the collapse and formation of stars in molecular clouds (see Bergin & Tafalla 2007, and reference therein). Through nitrogen chemistry, N2 H+ is directly formed from N2 via:
 (1)
(1)
in direct competition with CO:
 (2)
(2)
On the other hand, N2 H+ is destroyed via proton transfer with CO:
 (3)
(3)
as well as via dissociative recombination:
 (4)
(4)
(see Aikawa et al. 2015; van ’t Hoff et al. 2017, for a full discussion). At the standard low densities (n(H2) ≳ 102 cm−3) and cold temperatures (TK ~ 10 K) of the interstellar medium (ISM) the efficient formation of N2 H+ (reaction (1)) is inhibited by the presence of large amounts of CO in the gas phase (reactions (2) and (3)). The abundance of N2 H+ is rapidly enhanced during the gas collapse after the depletion of CO once this latter species is frozen onto the dust grains at densities above n(H2) ≳ 104 cm−3. N2 H+ is later destroyed once the CO has evaporated from the dust heated at temperatures above TK = 20 K (reaction (3)) or under the presence of free electrons (reaction (4)) produced in HII regions such as the Orion Nebula. These selective properties make N2 H+ an ideal tracer of the dense and cold material in molecular clouds (n(H2) ≳ 105 cm−3, TK ≲ 30 K). Interestingly, while the N2 H+ formation rate is almost independent of temperature (reaction (1)), the rate of dissociative recombinations (reaction (4)) decreases at increasing temperatures (e.g., Vigren et al. 2012) reducing the destruction rate of this molecule at high temperatures.
The excitation conditions of the high-J N2 H+ and C18O transitions obtained in our SEPIA660 observations enhance the chemical differences of these tracers4. Due to its high dipole moment (μ = 3.4 D), the N2 H+ (J = 7–6) (Eu = 125 K) line can only be collisionally excited at densities comparable to its critical density  cm−3. In contrast, the lower dipole moment of C18O (μ = 0.11 D) reduces the critical density of similarly high-J transitions, such as the C18 O (J = 6–5) line, down to ncrit(C18O (6−5)) ~ 5 × 105 cm−3. The reduction of the effective critical density at high column densities and temperatures (see Shirley 2015, for a full discussion), similar to those found in the OMC-1 region, make the C18 O (J = 6–5) transition (Eu = 110 K) sensitive to more diffuse (≲ 104 cm−3) and typically hotter material (TK > 60 K). The different gas regimes traced by these two molecules can be seen in previous observations of lower-J transitions in Orion such as N2 H+ (J = 1–0) (e.g., Hacar et al. 2018)and C18O (J = 1–0) (e.g., Kong et al. 2018).
The different gas regimes traced by the N2 H+ (7–6) and C18 O (6–5) lines become apparent by the complementary distribution of their emission maps shown in Fig. 2. Similarly to the (1–0) transition (Fig. 2a), we find no significant N2 H+ (7–6) emissionat the position of the hot Orion BN/KL region (see also Schilke et al. 2001), coincident with the emission peak of the C18 O (6–5) line (Fig. 2b). We observe this same behaviour at the bright edge of the HII nebula devoid of N2 H+ (7–6) emission butwell-delineated by brighter C18O (6–5) emission. On the other hand, most of the N2 H+ (7–6) peaks, as well as of the (1–0) emission, are located in well-shielded and typically colder regions with low or no significant C18 O (6–5) detections (see OMC-1 Ridge region in Fig. 2b). The OMC-1 South protocluster appears as the only exception to this general behavior. The extraordinary conditions of this cluster, engulfed by the Orion Nebula and seen face-on along the line-of-sight (O’dell 2001), can explain the bright emission of both molecules in this region.
Although it is not coincident, many of the N2 H+ (7–6) emission peaks are indeed located next to regions with enhanced C18 O (6–5) emission (see different contours in Fig. 2b). This systematic shift is particularly visible along the OMC-1 Ridge, where multiple clumps detected in N2 H+ seem to be illuminated in C18O in the direction of the ONC. These results suggest that the detected N2 H+ (7–6) emission may be showing the densest molecular gas in the OMC-1 region in the close proximity to the edge of the Orion Nebula.
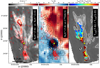 |
Fig. 2 From left to right: (a) Distribution of the total integrated N2H+ (7–6) emission detected by APEX-SEPIA660 (red contours; this work) superposed to the N2 H+ (1–0) emission observed by ALMA (colour scale; Hacar et al. 2018) both convolved into a resolution of 10″. (b) Comparison between N2H+ (7–6) (red contours) and C18O (6–5) (black contours) emission as function of the gas kinetic temperature (colour scale, Hacar et al. 2020). Both N2 H+ and C18 O contour levels are similar to those displayed in Fig. 1. (c)
|

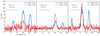 |
Fig. 3 Representative N2H+ (1–0) (blue) and N2H+ (7–6) (red) spectra (in Tmb units) found in the OMC-1 Ridge (a), the surroundings of the Orion BN/KL region (b), and the OMC-1 South proto-cluster (c). The coordinates of our spectra are indicated in the upper left corner of each subplot (see also Fig. 2a). |
4 Gas at densities >107 cm−3 in OMC-1
In addition to their bright emission, the observed N2 H+ (7–6) lines in OMC-1 show unprecedentedly high main-beam peak temperatures (Tmb). As illustrated by several representative spectra shown in Fig. 3, we observe N2 H+ (7–6) lines clearly detected well above the noise level of our data with ⟨rms⟩ ~ 0.65 K. We fitted all our N2 H+ (7–6) spectra using a single Gaussian velocity component. 384 independent beams in our maps show N2 H+ (7–6) spectra with a signal-to-noise (S/N) larger than 3. Among them, the detected N2 H+ (7–6) emission presents mean values of Tmb(N2H+ (7–6)) ~ 4 K and linewidths ΔV (N2H+ (7–6)) ~ 1.3 km s−1 (Figs. 3a and b). Extremely bright spectra, with Tmb(N2H+ (7–6)) ~ 10 K, are observedin the OMC-1 South region (Fig. 3c). In many of these positions we find that the peak temperature of the N2 H+ (7–6) transition (red spectra) matches and sometimes exceeds the corresponding peaks of their N2 H+ (1–0) counterparts (blue spectra). At the OMC-1 ridge, comparisons between our SEPIA660 and ALMA data show values with 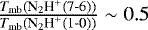 while in the OMC-1 South and the surroundings of Orion BN/KL reach values above
 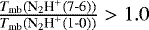 (see representative spectra).
We used the radiative transfer calculations provided by RADEX (van der Tak et al. 2007) to obtain the direct comparisons between the predicted N2 H+ line intensities at different densities. Our calculations assume the latest collisional coefficients and energy levels provided by the Leiden Molecular Database (Schöier et al. 2005) without any hyperfine structure. We modeled the main properties of our lines adopting average line intensities and linewidth similar to those reported in our SEPIA660 observations (see above) for a characteristic column density of N(N2H+) = 5 × 1013 cm−3 derived from detailed analysis of the hyperfine opacities obtained in our previous N2 H+ (1–0) observations (see Appendix B in Hacar et al. 2018, for a discussion). Our models include three representative gas kinetic temperatures, namely, TK = 15, 25, and 35 K, describing the typical gas temperatures for the dense gas in OMC-1 consistent with previous temperature estimates (see Fig. 2b; Hacar et al. 2020). Larger temperature values were not considered because the effective chemical destruction of N2 H+ at TK > 35 K (see Sect. 3).
Some caveats should be considered when interpreting our model results and their comparison with our observations. Most of these uncertainties are typically associated with the poorly characterized N2 H+ (J ≥ 7−6) transitions in comparison with its better known properties of lower J lines (J ≤ 6−5, e.g., Daniel et al. 2005; Pagani et al. 2009). First, the absence of accurate estimates for the collisional coefficients for the N2 H+ (7–6) hyperfine transitions limits the depth of our analysis. Thus, our models deliberately calculate the excitation conditions of N2 H+ assuming a single line transition. With this approach we effectively add the contribution of all hyperfine components into a single line increasing the predicted N2 H+ (1–0) and (7–6) line opacities and intensities up to a factor of ~5–7 respect to their main hyperfine components. This choice is particularly justified in the case of our N2 H+ (7–6) showing a compact hyperfine structure with almost all hypefine components blended within ≲ 1.5 km s−1 (see Fig. 3). Second, our RADEX models adopt the LAMDA collisional rate coefficients that are extrapolated from those of HCO+ (see Flower 1999). Recent collisional rate coefficients calculations include the hyperfine structure of N2 H+-H2 up to J = 7–6 (Lique et al. 2015). The difference between the two approximately introduces an uncertainty of a factor of 3–5 in our density estimates (Lique et al. 2015). For consistency with our RADEX models, we fit our N2 H+ spectra using a unique Gaussian component. Comparisons with the peak line intensities predicted using the full hyperfine information (CDMS) indicate that our Gaussian fits accurately reproduce the line peak temperatures of the observed N2 H+ (1–0) and (7–6) spectra within ≤15%. Linewidths, on the other hand, are affected by the superposition of multiple hyperfine components in both N2 H+ (1–0) (central group) and (7–6) (full hyperfine structure) lines. Our analysis focuses on a simplified description of the N2 H+ (1–0) and (7–6) peak temperatures (Tmb) that are meant to obtain a first order approximation to the gas densities along the ONC region. A more precise determination of the local gas densities in different positions of this cloud would require a more detailed treatment of the hyperfine structure and collisional coefficients of N2 H+ (e.g., see Keto & Rybicki 2010) as well the simultaneous analysis of additional intermediate transitions such as (J = 3–2) (Teng & Hirano 2020).
The observed variations on the N2 H+ line intensities can be understood from our RADEX models. In Fig. 4, we present the individual line peak temperatures, Tmb, (upper panel) and opacities τ (lower panel) for all J-transitions (J ≤10–9) considered in our RADEX models. For simplicity, we display only two characteristic density values, namely, n(H2) = 5 × 105 cm−3 and n(H2) = 5 × 107 cm−3, representing both low- and high-density regimes in our data, respectively. Overall, higher temperatures and densities typically increase the excitation and emission of higher J-transitions. However, each of these variations show different behaviours along the N2 H+ J-ladder. As seen in Fig. 4 (upper panel), while temperature variations can potentially increase the peak temperatures in all J-transitions, it is only the density that is able to effectively excite high-J levels above J ≥ 6–5. On the other hand, the opacity changes observed in Fig. 4 (lower panel) demonstrated how the combination of high temperatures and densities increases the population of high-J levels at expenses of those in lower J. In high-density and warm environments, the effective excitation of high-J levels, J > 6–5, is accompanied by a rapid reduction of the line opacities in all N2 H+ transitions, J ≤ 4–3. While these values are only calculated for a single-component in our RADEX models, a similar variations of both line intensities and opacities with increasing densities are observed in radiative transfer calculations for the N2 H+ (1–0) line, including its entire hyperfine structure (see Fig. B.4 in Hacar et al. 2018).
Our previous plots demonstrate how the large energy difference between the N2 H+ (1–0) (Eu = 4.7 K) and (7–6) (Eu = 125 K) lines provides crucial information about the densities of the star-forming gas in OMC-1. In more detail, Fig. 5 illustrates the line peak temperature Tmb(N2H+ (7–6)) (top panel) and line ratios  (bottom panel) for densities between 105 and 108 cm−3 predicted by our RADEX models. For all temperatures our radiative transfer calculations show higher Tmb (N2 H+ (7–6)) values and
  ratios with increasing densities. The variations in both line peaks and ratios are primarily driven by the combination of both high densities and lukewarm temperatures required to effectively excite the N2 H+ (7–6) transition (see Fig. 4). Even at relatively high temperatures, the detection of spectra showing Tmb(N2H+ (7–6)) > 3 K guarantees the detection of gas of at densities n(H2) > 106 cm−3. For the same detection threshold our models predict larger densities for decreasing temperatures (see coloured lines in the plots) or column densities (not shown).
The use of RADEX radiative transfer models allows us to constrain the gas densities traced by our new SEPIA660 observations. The Tmb(N2H+ (7–6)) and  values detected along the OMC-1 region (see also horizontal lines in Fig. 5) rule out densities below n(H2) < 106 cm−3 and temperatures TK < 20 K. Instead, the observed high values for both peak temperatures and line ratios detected can only be reproduced if the gas detected in N2 H+ (7–6) is at densities n(H2) > 5 × 107 cm−3. Even higher densities, with n(H2)~108 cm−3, would be also consistent with the detected line ratios in the OMC-1 South proto-cluster. Secondary differences between these two regions can be attributed to the slightly warmer conditions found towards OMC-1 South (TK ~ 35 K) compared to the OMC-1 Ridge (TK ~ 25 K) (Hacar et al. 2020).
The unique detection of N2 H+ (7–6) transition unambiguously demonstrates the presence of gas at ultra-high densities in OMC-1. Previous calculations based on the N2 H+ (1–0) line opacities (Hacar et al. 2018) and the N2 H+ (3–2) intensities (Teng & Hirano 2020) derived density values between n(H2) = 106−107 cm−3. The inclusion of this new N2 H+ (7–6) transition potentially increases the density estimates by at least a factor of 5 in regions such as the OMC-1 South. On the other hand, our new SEPIA observations demonstrate that part of the dense material traced in N2 H+ is effectively heated by the ONC Nebula at temperatures above TK ≳ 30 K. Previous estimates have derived temperatures for the dense gas traced in N2 H+ of TK = 20 K (see Teng & Hirano 2020). Our radiative transfer calculations indicate that significant fractions of this dense material are consistent with temperatures of TK ≳ 30 K.
The presence of large amounts of N2 H+ at high temperatures appears counter-intuitive at first glance. CO is expected to fully evaporate from the dust grains at Tdust > 15 K (Bergin & Tafalla 2007). Previous observations report dust effective temperatures (Tdust) similar to the gas kinetic temperatures along OMC-1 showing differences of |Tdust − TK|≲ 5 K (see Hacar et al. 2020)5. At the Tdust ~ TK = 20–30 K observed along the ONC region (see Fig. 2b), CO is then expected to quickly destroy N2 H+ via reaction(3) once CO is back into the gas phase. This evaporation process could be counterbalanced by the short freeze-out timescales of this molecule (~100 yr) expected at the ultra high gas densitiesdetected in this region (τf−o ~ 5 × 10⁹∕n(H2) yr, see Bergin & Tafalla 2007) continuing operating at high temperatures (see Appendix B in Harsono et al. 2015). If mixed with other ices, CO could also disorb at higher temperatures delaying its evaporation from the dust grains (Viti et al. 2004). Moreover, the presence of N2 H+ could be enhanced by the reduction of the dissociative recombination rate of reaction (4) at high temperatures (Vigren et al. 2012). The combination of these effects appear to favour the survival of N2 H+ at lukewarm temperatures 20 K ≲ TK ≲ 35 K in extremely dense environments such as the surroundings of the ONC.
Based on our ALMA measurements, we estimate a minimum of 30 M⊙ at densities n(H2) > 107 cm−3 within our maps. Our calculations include those positions with significant emission in N2 H+ (7–6) at S∕N ≥ 3. Due to the excitation conditions of this line, our selection criteria restrict these mass estimates to dense gas pockets at temperatures above TK > 25 K (see Fig. 3). According to our (1–0) detections, larger mass reservoirs are likely to be present at lower temperatures towards the north and west of the OMC-1 region (e.g., see N2 H+ (1–0) maps in Fig. 1). This conclusion is reinforced by the bright and extended N2 H+ (3–2) emission detected towards the entire OMC-1 region (Teng & Hirano 2020). Our mass estimates should therefore be considered as the lower limits of total amount of gas at ultra-high densities in this region.
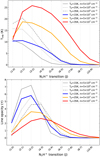 |
Fig. 4 Expected line peak temperatures Tmb (upper panel) and line opacity τ (lower panel) values for all N2H+ transitions (J ≤ 10–9) predicted by our RADEX models assumed as single-line components (aka without hyperfine structure). For simplicity, we represent only the models with densities n(H2) = 5 × 105 cm−3 (grey) and 5 × 107 cm−3 (colours), and temperatures of TK = 15, 25, and35 K (see legend). We notice how density significantly changes (aka skew) both Tmb and τ distributionstowards high J-transitions. In this context, the detection of bright N2H+ (7–6) emission above Tmb > 2 K can be used as direct probe of gas at densities above n(H2) > 107 cm−3. |
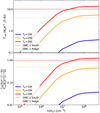 |
Fig. 5 Expected N2H+ (7–6) line peak temperatures Tmb(N2H+ (7–6)) (top panel) and ratios respect the (1–0) transition |
5 Star-formation at extremely high densities
The widespread detection of N2 H+ (7–6) emission shown in our observations (Sect. 2) illustrates the extreme physical conditions of the gas in young massive clusters such as the ONC. Our Early Science SEPIA660 observations demonstrate the existence of large volumes of gas at densities of n(H2) > 107 cm−3 in close proximity to the ONC (Sect. 3). These densities are at least two orders of magnitude larger than those gas densities found in the densest cores in low-mass star-forming regions, typically with n(H2) ~ 105 cm−3 (e.g., Caselli et al. 2002) (Sect. 4). While it was previously suggested that it is restricted to the Orion BN/KL hot core (Goddi et al. 2011), our new observations extend the presence of lukewarm gas at densities above n(H2) > 107 cm−3 at scales of approximately 1 pc.
These results explain the extraordinary star-formation properties found along the OMC-1 Ridge and the OMC-1 South proto-cluster. Recent millimeter continuum and X-ray surveys have found a typical separation between young embedded sources of 2000 AU (OMC-1 Ridge, Teixeira et al. 2016) and 600 AU (OMC-1 South, Rivilla et al. 2013). These values are in excellent agreement with the corresponding Jeans fragmentation lengths ( ) for a gas at temperatures of TK = 30 K (i.e. cs = 0.35 km s−1) at densities between n(H2) = 107 cm−3 (λJ ~ 1450 AU) and n(H2) = 108 cm−3 (λJ ~ 450 AU). With expected free-fall times of τff ≲ 104 yr, these densities are also consistent with the young ages and high SFRs found in the embedded populations in regions such as OMC-1 South (see Rivilla et al. 2013). Moreover, our SEPIA660 results also confirm the density values predicted for the star-forming fibers found in the OMC-1 region by Hacar et al. (2018). Compared to those low-mass Herschel filaments showing widths of ~0.1 pc (Arzoumanian et al. 2011), the reported densities of n(H2) > 107 cm−3 explain the much narrower fibers widths of ~0.03 pc found in this massive ONC region (see Hacar et al. 2018, for a discussion).
The unusually large volume densities of the gas found in OMC-1 illustrate the extraordinary properties of this cloud. The high densities detected in fibers and cores (traced in N2 H+) allow these structures to survive the strong radiative and mechanical feedback produced by the O-type stars in the Trapezium that are shielded behind large column densities of warm molecular material (observed in C18 O). Nonetheless, two competing mechanism operate in this cloud. First, the reported TK > 20 K values in the surroundings of the ONC indicate that some of these structures could be photoevaporated by the HII nebula on relatively short timescales, τphoto. On the other hand, this destruction process is counteracted by the rapid τff collapse of the ultra dense star-forming gas revealed by our N2 H+ (7–6) observations (see above). The detection of large number of young embedded sources in regions such as OMC-1 South (e.g., Rivilla et al. 2013) indicates that τphoto ≫ τff even under these extreme gas conditions. Our observations suggest that feedback may have little effect on the evolution of the gas at extremely high densities found in this massive cluster, which is in agreement with recent simulations (Dale et al. 2014).
The unique combination of sensitivity and mapping capability that characterizes the new APEX-SEPIA660 receiver opens a new window for ISM studies at high frequencies. These ultra-high gas densities reported in OMC-1 mimic the physical conditions of more distant and massive environments such as the Central Molecular Zone or Starburst Galaxies. Our new SEPIA660 observations reveal this OMC-1 cloud as unique laboratory for investigating the fragmentation, collapse, and chemical evolution of the gas at extreme density conditions in unprecedented detail. Moreover, the confirmed detection of bright and extended emission of N2 H+ (7–6) (652 GHz) offers the possibility of observing these regions at ultra-high resolutions with the ALMA Band 9.
Acknowledgements
The APEX SEPIA receiver is a joint development by the Group of Advanced Receiver Development (GARD, Gothenburg, Sweden) from the Onsala Space Observatory (OSO, Sweden), the Netherlands Research School for Astronomy (NOVA, The Netherlands), and the European Southern Observatory (ESO). D.H. acknowledges support from the EACOA fellowship from the East Asian Core Observatories Association. This paper makes use of the following ALMA data: ADS/JAO.ALMA#2015.1.00669.S. ALMA is a partnership of ESO (representing its member states), NSF (USA) and NINS (Japan), together with NRC (Canada) and NSC and ASIAA (Taiwan) and KASI (Republic of Korea), in cooperation with the Republic of Chile. The Joint ALMA Observatory is operated by ESO, AUI/NRAO and NAOJ. Based on observations carried out with the IRAM 30 m Telescope. IRAM is supported by INSU/CNRS (France), MPG (Germany) and IGN (Spain). This research made use of APLpy, an open-source plotting package for Python (Astropy Collaboration 2013). This paper made use of the TOPCAT software (Taylor 2005).
References
- Aikawa, Y., Furuya, K., Nomura, H., et al. 2015, ApJ, 807, 120 [NASA ADS] [CrossRef] [Google Scholar]
- Arzoumanian, D., André, P., Didelon, P., et al. 2011, A&A, 529, L6 [CrossRef] [EDP Sciences] [Google Scholar]
- Astropy Collaboration (Robitaille, T. P., et al.) 2013, A&A, 558, A33 [NASA ADS] [CrossRef] [EDP Sciences] [Google Scholar]
- Bally, J., Cunningham, N. J., Moeckel, N., et al. 2011, ApJ, 727, 113 [NASA ADS] [CrossRef] [Google Scholar]
- Baryshev, A. M., Hesper, R., Mena, F. P., et al. 2015, A&A, 577, A129 [NASA ADS] [CrossRef] [EDP Sciences] [Google Scholar]
- Belitsky, V., Lapkin, I., Fredrixon, M., et al. 2018, A&A, 612, A23 [NASA ADS] [CrossRef] [EDP Sciences] [Google Scholar]
- Bergin, E. A.,& Tafalla, M. 2007, ARA&A, 45, 339 [NASA ADS] [CrossRef] [Google Scholar]
- Caselli, P., Benson, P. J., Myers, P. C., & Tafalla, M. 2002, ApJ, 572, 238 [NASA ADS] [CrossRef] [Google Scholar]
- Dale, J. E., Ngoumou, J., Ercolano, B., et al. 2014, MNRAS, 442, 694 [NASA ADS] [CrossRef] [MathSciNet] [Google Scholar]
- Daniel, F., Dubernet, M.-L., Meuwly, M., et al. 2005, MNRAS, 363, 1083 [NASA ADS] [CrossRef] [Google Scholar]
- Endres, C. P., Schlemmer, S., Schilke, P., et al. 2016, J. Mol. Spectr., 327, 95 [NASA ADS] [CrossRef] [Google Scholar]
- Flower, D. R. 1999, MNRAS, 305, 651 [NASA ADS] [CrossRef] [Google Scholar]
- Friesen, R. K., Pineda, J. E., Rosolowsky, E., et al. 2017, ApJ, 843, 63 [NASA ADS] [CrossRef] [Google Scholar]
- Genzel, R., Ho, P. T. P., Bieging, J., et al. 1982, ApJ, 259, L103 [NASA ADS] [CrossRef] [Google Scholar]
- Ginsburg, A., Bally, J., Barnes, A., et al. 2018, ApJ, 853, 171 [NASA ADS] [CrossRef] [Google Scholar]
- Goddi, C., Greenhill, L. J., Humphreys, E. M. L., et al. 2011, ApJ, 739, L13 [NASA ADS] [CrossRef] [Google Scholar]
- Goicoechea, J. R., Teyssier, D., Etxaluze, M., et al. 2015, ApJ, 812, 75 [NASA ADS] [CrossRef] [Google Scholar]
- Hacar, A., Tafalla, M., Forbrich, J., et al. 2018, A&A, 610, A77 [NASA ADS] [CrossRef] [EDP Sciences] [Google Scholar]
- Hacar, A., Bosman, A. D., & van Dishoeck, E. F. 2020, A&A, 635, A4 [CrossRef] [EDP Sciences] [Google Scholar]
- Harsono, D., Bruderer, S., & van Dishoeck, E. F. 2015, A&A, 582, A41 [NASA ADS] [CrossRef] [EDP Sciences] [Google Scholar]
- Ishii, S., Seta, M., Nagai, M., et al. 2016, PASJ, 68, 10 [NASA ADS] [CrossRef] [Google Scholar]
- Kauffmann, J., Pillai, T., Zhang, Q., et al. 2017, A&A, 603, A90 [NASA ADS] [CrossRef] [EDP Sciences] [Google Scholar]
- Keto, E., & Rybicki, G. 2010, ApJ, 716, 1315 [NASA ADS] [CrossRef] [Google Scholar]
- Kong, S., Arce, H. G., Feddersen, J. R., et al. 2018, ApJS, 236, 25 [NASA ADS] [CrossRef] [Google Scholar]
- Krumholz, M. R., Dekel, A., & McKee, C. F. 2012, ApJ, 745, 69 [NASA ADS] [CrossRef] [Google Scholar]
- Krumholz, M. R., McKee, C. F., & Bland-Hawthorn, J. 2019, ARA&A, 57, 227 [NASA ADS] [CrossRef] [Google Scholar]
- Lique, F., Daniel, F., Pagani, L., et al. 2015, MNRAS, 446, 1245 [NASA ADS] [CrossRef] [Google Scholar]
- Lombardi, M., Bouy, H., Alves, J., et al. 2014, A&A, 566, A45 [NASA ADS] [CrossRef] [EDP Sciences] [Google Scholar]
- Longmore, S. N., Kruijssen, J. M. D., Bastian, N., et al. 2014, Protostars and Planets VI (TUcson, AZ: University of Arizona Press), 291 [Google Scholar]
- Martin-Pintado, J., Rodriguez-Franco, A., & Bachiller, R. 1990, ApJ, 357, L49 [NASA ADS] [CrossRef] [Google Scholar]
- Meingast, S., Alves, J., Mardones, D., et al. 2016, A&A, 587, A153 [NASA ADS] [CrossRef] [EDP Sciences] [Google Scholar]
- Menten, K. M., Reid, M. J., Forbrich, J., & Brunthaler, A. 2007, A&A, 474, 515 [NASA ADS] [CrossRef] [EDP Sciences] [Google Scholar]
- Müller, H. S. P., Schlöder, F., Stutzki, J., et al. 2005, J. Mol. Struct., 742, 215 [NASA ADS] [CrossRef] [Google Scholar]
- O’dell, C. R. 2001, ARA&A, 39, 99 [NASA ADS] [CrossRef] [Google Scholar]
- Pabst, C., Higgins, R., Goicoechea, J. R., et al. 2019, Nature, 565, 618 [NASA ADS] [CrossRef] [Google Scholar]
- Pagani, L., Daniel, F., & Dubernet, M.-L. 2009, A&A, 494, 719 [NASA ADS] [CrossRef] [EDP Sciences] [Google Scholar]
- Parmentier, G. 2019, ApJ, 887, 179 [CrossRef] [Google Scholar]
- Pety, J., Guzmán, V. V., Orkisz, J. H., et al. 2017, A&A, 599, A98 [NASA ADS] [CrossRef] [EDP Sciences] [Google Scholar]
- Portegies Zwart, S. F., Baumgardt, H., Hut, P., et al. 2004, Nature, 428, 724 [NASA ADS] [CrossRef] [PubMed] [Google Scholar]
- Portegies Zwart, S. F., McMillan, S. L. W., & Gieles, M. 2010, ARA&A, 48, 431 [NASA ADS] [CrossRef] [Google Scholar]
- Rivilla, V. M., Martín-Pintado, J., Sanz-Forcada, J., et al. 2013, MNRAS, 434, 2313 [NASA ADS] [CrossRef] [Google Scholar]
- Schilke, P., Benford, D. J., Hunter, T. R., et al. 2001, ApJS, 132, 281 [NASA ADS] [CrossRef] [Google Scholar]
- Schöier, F. L., van der Tak, F. F. S., van Dishoeck, E. F., et al. 2005, A&A, 432, 369 [NASA ADS] [CrossRef] [EDP Sciences] [Google Scholar]
- Shirley, Y. L. 2015, PASP, 127, 299 [NASA ADS] [CrossRef] [Google Scholar]
- Taylor, M. B. 2005, Astronomical Data Analysis Software and Systems XIV (San Francisco: ASP), 29 [Google Scholar]
- Teng, Y.-H., & Hirano, N. 2020, ApJ, 893, 63 [CrossRef] [Google Scholar]
- Teixeira, P. S., Takahashi, S., Zapata, L. A., et al. 2016, A&A, 587, A47 [NASA ADS] [CrossRef] [EDP Sciences] [Google Scholar]
- Ungerechts, H., Bergin, E. A., Goldsmith, P. F., et al. 1997, ApJ, 482, 245 [NASA ADS] [CrossRef] [PubMed] [Google Scholar]
- van der Tak, F. F. S., Black, J. H., Schöier, F. L., et al. 2007, A&A, 468, 627 [NASA ADS] [CrossRef] [EDP Sciences] [Google Scholar]
- Vigren, E., Zhaunerchyk, V., Hamberg, M., et al. 2012, ApJ, 757, 34 [NASA ADS] [CrossRef] [Google Scholar]
- Viti, S., Collings, M. P., Dever, J. W., et al. 2004, MNRAS, 354, 1141 [NASA ADS] [CrossRef] [Google Scholar]
- van ’t Hoff, M. L. R., Walsh, C., Kama, M., et al. 2017, A&A, 599, A101 [NASA ADS] [CrossRef] [EDP Sciences] [Google Scholar]
- Walker, D. L., Longmore, S. N., Bastian, N., et al. 2015, MNRAS, 449, 715 [NASA ADS] [CrossRef] [Google Scholar]
- Wiseman, J. J., & Ho, P. T. P. 1998, ApJ, 502, 676 [NASA ADS] [CrossRef] [Google Scholar]
This work is a continuation of the ORION-4D project (PI: A. Hacar). See more information in https://sites.google.com/site/orion4dproject
For each 4 GHz subband, the XFFTS backend installed at APEX has a maximum resolution of 65 536 channels (or 61 kHz per channel). In order to reduce the data rate in our high cadence OTF-maps, our observations reduced the effective spectral resolution down of this XFFTS backend to 16 384 channels (or 240 kHz) per sideband and polarisation.
The effective dust temperature (Tdust) is usually obtained from a single-component black-body fit of the observed FIR luminosities (e.g., Lombardi et al. 2014). This effective temperature describes the average dust grain temperature (Tgrain) weighted along the line of sight. Biased towards warmer temperatures producing a bright FIR emission, the effective dust temperature typically overestimates the local dust grain temperatures in cold and dense (aka well-shielded) regions showing fainter FIR emission, that is, Tdust ≥ Tgrain.
All Figures
|
Fig. 1 New SEPIA660 observations along the OMC-1 region. From left to right: (a) VISTA-IR Ks band (Meingast et al. 2016); (b) APEX-SEPIA660 N2H+ (7–6); and (c) APEX-SEPIA660 C18O (6–5) maps(this work). All molecular maps are convolved into a common Nyquist grid with a final resolution of 10″. The intensity the H41α emission tracing the extension of the ONC HII nebula (red contours, Hacar et al. 2020) is indicated in the VISTA image. Panels b and c: equally spaced contours (black) every W(N2 H+(7−6)) = 2.5 K km s−1 and W(C18O (6−5)) = 10 K km s−1, respectively. For reference, the position of the Trapezium (white stars) and the Orion BN source (yellow star), as well as the first contour of the N2H+ (1–0) emission (W(N2H+(1−0)) = 1.0 K km s−1, white contour), are displayed in all panels (Hacar et al. 2018, see also Fig. 2a). |
| In the text | |
|
Fig. 2 From left to right: (a) Distribution of the total integrated N2H+ (7–6) emission detected by APEX-SEPIA660 (red contours; this work) superposed to the N2 H+ (1–0) emission observed by ALMA (colour scale; Hacar et al. 2018) both convolved into a resolution of 10″. (b) Comparison between N2H+ (7–6) (red contours) and C18O (6–5) (black contours) emission as function of the gas kinetic temperature (colour scale, Hacar et al. 2020). Both N2 H+ and C18 O contour levels are similar to those displayed in Fig. 1. (c)
|
| In the text | |
|
Fig. 3 Representative N2H+ (1–0) (blue) and N2H+ (7–6) (red) spectra (in Tmb units) found in the OMC-1 Ridge (a), the surroundings of the Orion BN/KL region (b), and the OMC-1 South proto-cluster (c). The coordinates of our spectra are indicated in the upper left corner of each subplot (see also Fig. 2a). |
| In the text | |
|
Fig. 4 Expected line peak temperatures Tmb (upper panel) and line opacity τ (lower panel) values for all N2H+ transitions (J ≤ 10–9) predicted by our RADEX models assumed as single-line components (aka without hyperfine structure). For simplicity, we represent only the models with densities n(H2) = 5 × 105 cm−3 (grey) and 5 × 107 cm−3 (colours), and temperatures of TK = 15, 25, and35 K (see legend). We notice how density significantly changes (aka skew) both Tmb and τ distributionstowards high J-transitions. In this context, the detection of bright N2H+ (7–6) emission above Tmb > 2 K can be used as direct probe of gas at densities above n(H2) > 107 cm−3. |
| In the text | |
|
Fig. 5 Expected N2H+ (7–6) line peak temperatures Tmb(N2H+ (7–6)) (top panel) and ratios respect the (1–0) transition |
| In the text | |
Current usage metrics show cumulative count of Article Views (full-text article views including HTML views, PDF and ePub downloads, according to the available data) and Abstracts Views on Vision4Press platform.
Data correspond to usage on the plateform after 2015. The current usage metrics is available 48-96 hours after online publication and is updated daily on week days.
Initial download of the metrics may take a while.