Fig. 2
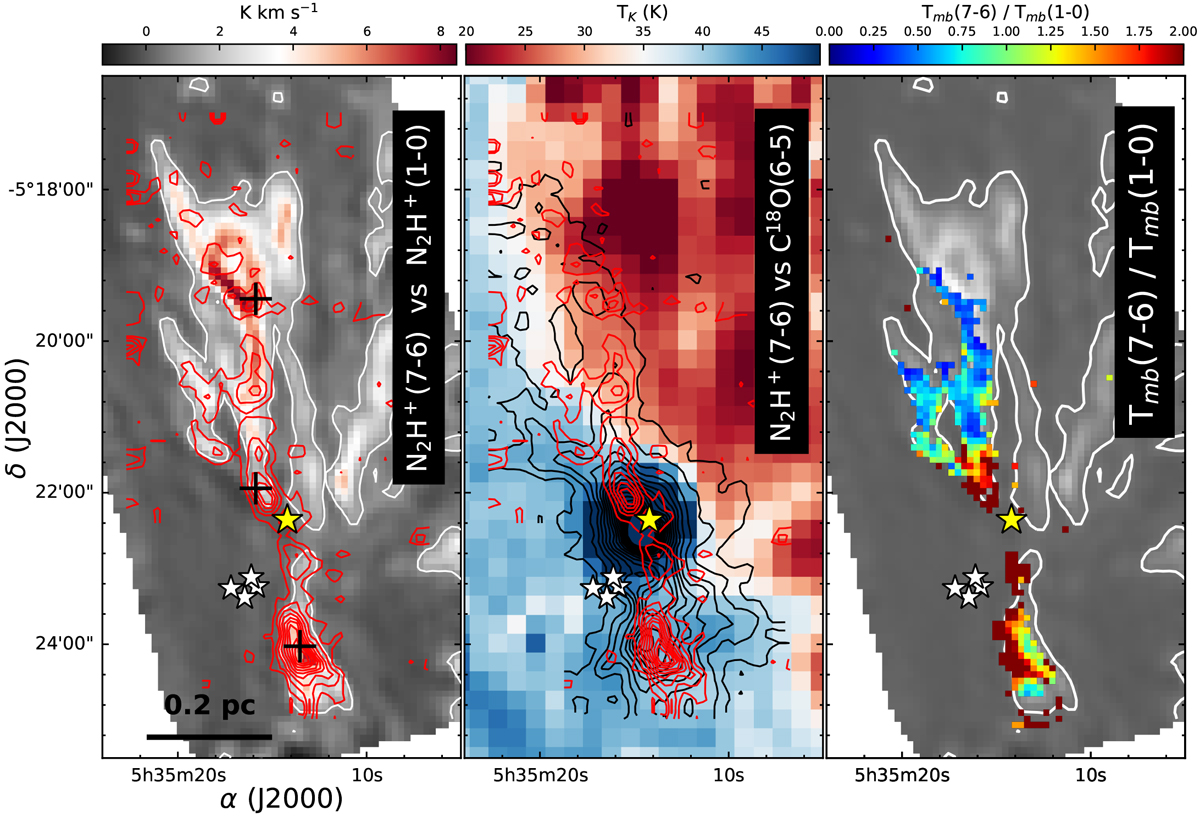
From left to right: (a) Distribution of the total integrated N2H+ (7–6) emission detected by APEX-SEPIA660 (red contours; this work) superposed to the N2 H+ (1–0) emission observed by ALMA (colour scale; Hacar et al. 2018) both convolved into a resolution of 10″. (b) Comparison between N2H+ (7–6) (red contours) and C18O (6–5) (black contours) emission as function of the gas kinetic temperature (colour scale, Hacar et al. 2020). Both N2 H+ and C18 O contour levels are similar to those displayed in Fig. 1. (c)
![]() line peak ratio (colour scale) plotted over the total integrated intensity N2H+
(1–0) (grey scale). For reference, the position of the Trapezium (white stars) and the Orion BN source (yellow star) are displayed in all maps. The first contour of the N2 H+ (1–0) emission (W(N2H+(1−0)) = 1.0 K km s−1,white contour) is also indicated in panels a and c. The black crosses in panel a indicate the position of the representative spectra shown in Fig. 3.
line peak ratio (colour scale) plotted over the total integrated intensity N2H+
(1–0) (grey scale). For reference, the position of the Trapezium (white stars) and the Orion BN source (yellow star) are displayed in all maps. The first contour of the N2 H+ (1–0) emission (W(N2H+(1−0)) = 1.0 K km s−1,white contour) is also indicated in panels a and c. The black crosses in panel a indicate the position of the representative spectra shown in Fig. 3.
Current usage metrics show cumulative count of Article Views (full-text article views including HTML views, PDF and ePub downloads, according to the available data) and Abstracts Views on Vision4Press platform.
Data correspond to usage on the plateform after 2015. The current usage metrics is available 48-96 hours after online publication and is updated daily on week days.
Initial download of the metrics may take a while.