Free Access
Fig. 3
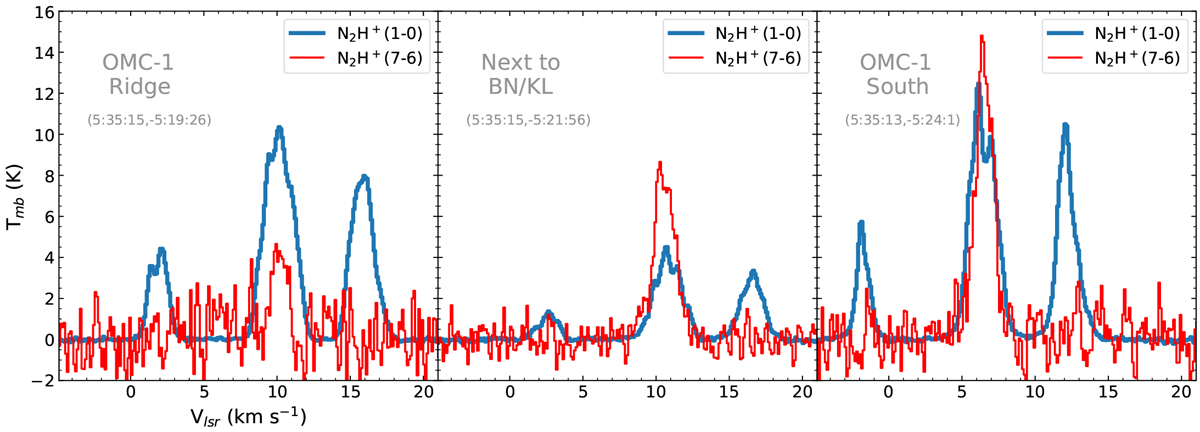
Representative N2H+ (1–0) (blue) and N2H+ (7–6) (red) spectra (in Tmb units) found in the OMC-1 Ridge (a), the surroundings of the Orion BN/KL region (b), and the OMC-1 South proto-cluster (c). The coordinates of our spectra are indicated in the upper left corner of each subplot (see also Fig. 2a).
Current usage metrics show cumulative count of Article Views (full-text article views including HTML views, PDF and ePub downloads, according to the available data) and Abstracts Views on Vision4Press platform.
Data correspond to usage on the plateform after 2015. The current usage metrics is available 48-96 hours after online publication and is updated daily on week days.
Initial download of the metrics may take a while.