Fig. 4
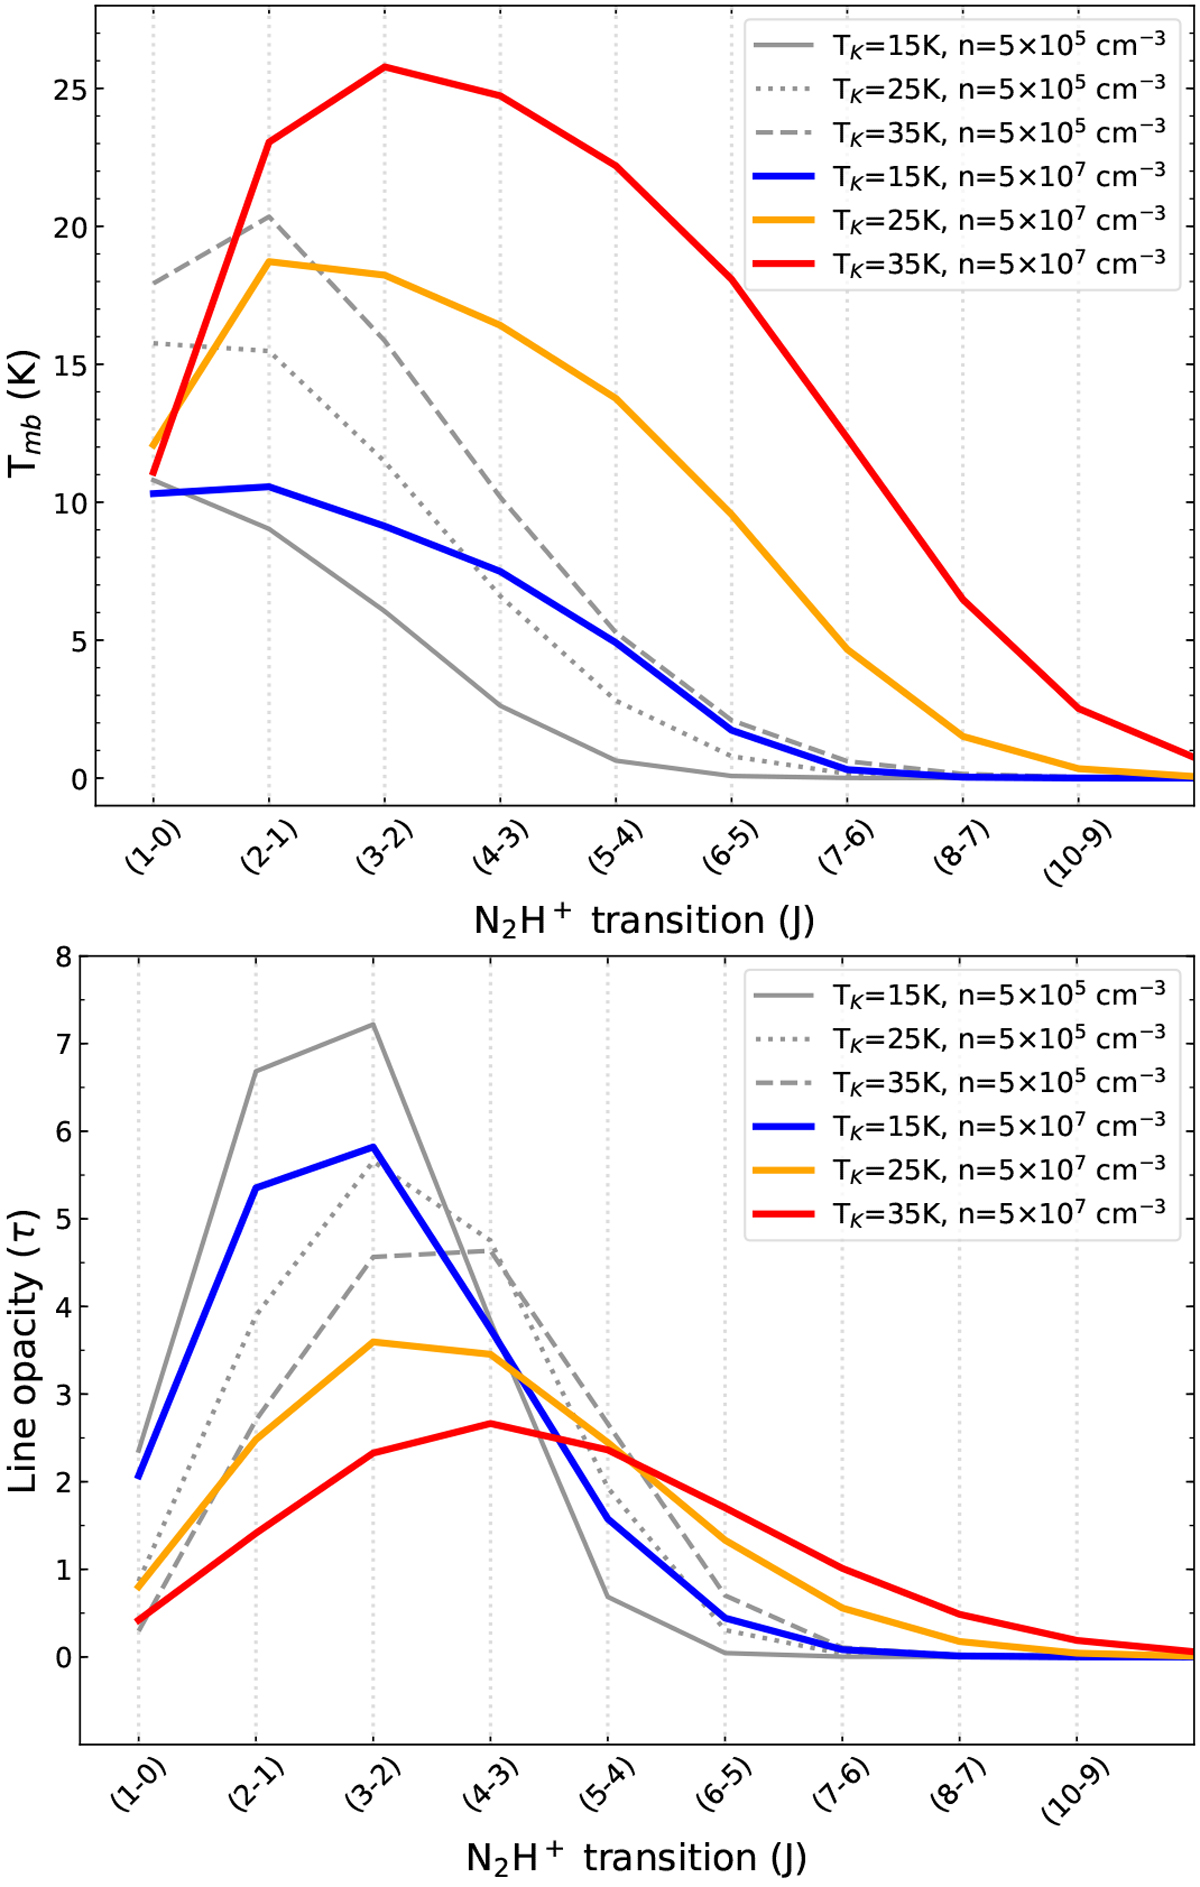
Expected line peak temperatures Tmb (upper panel) and line opacity τ (lower panel) values for all N2H+ transitions (J ≤ 10–9) predicted by our RADEX models assumed as single-line components (aka without hyperfine structure). For simplicity, we represent only the models with densities n(H2) = 5 × 105 cm−3 (grey) and 5 × 107 cm−3 (colours), and temperatures of TK = 15, 25, and35 K (see legend). We notice how density significantly changes (aka skew) both Tmb and τ distributionstowards high J-transitions. In this context, the detection of bright N2H+ (7–6) emission above Tmb > 2 K can be used as direct probe of gas at densities above n(H2) > 107 cm−3.
Current usage metrics show cumulative count of Article Views (full-text article views including HTML views, PDF and ePub downloads, according to the available data) and Abstracts Views on Vision4Press platform.
Data correspond to usage on the plateform after 2015. The current usage metrics is available 48-96 hours after online publication and is updated daily on week days.
Initial download of the metrics may take a while.