Fig. 1
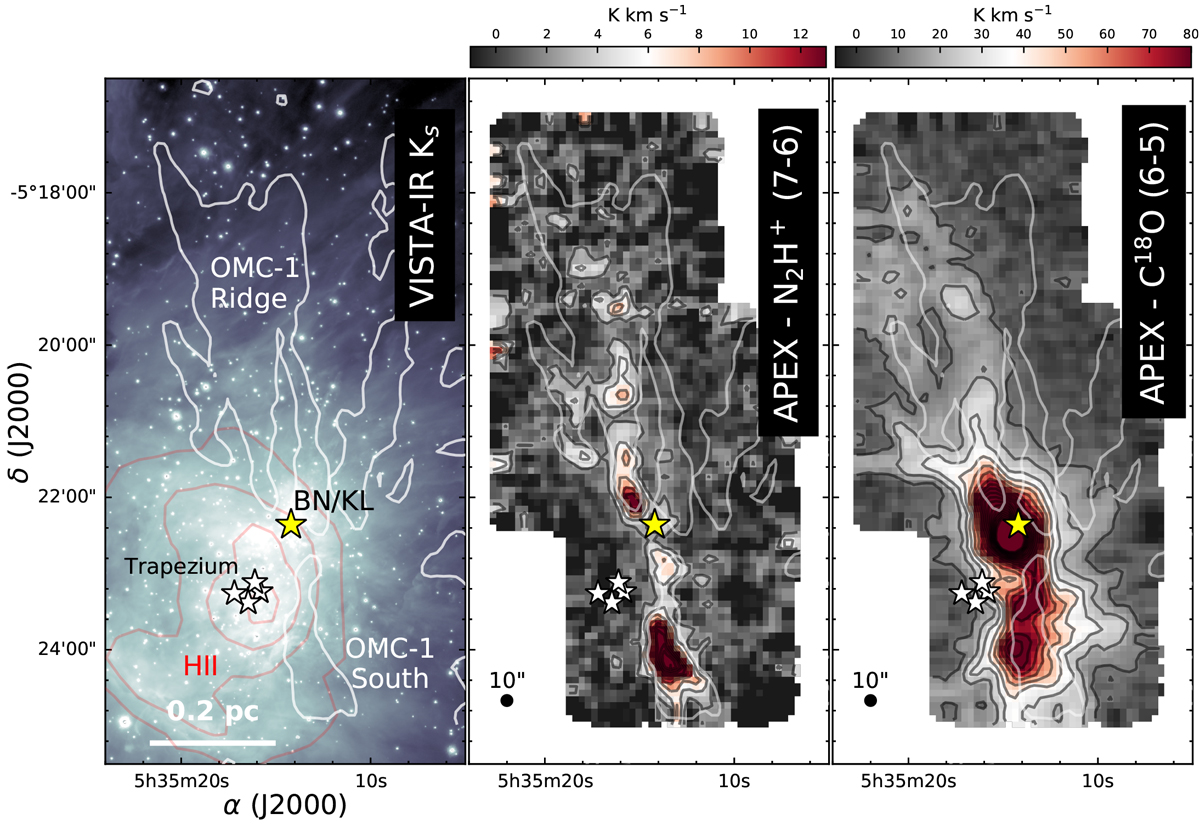
New SEPIA660 observations along the OMC-1 region. From left to right: (a) VISTA-IR Ks band (Meingast et al. 2016); (b) APEX-SEPIA660 N2H+ (7–6); and (c) APEX-SEPIA660 C18O (6–5) maps(this work). All molecular maps are convolved into a common Nyquist grid with a final resolution of 10″. The intensity the H41α emission tracing the extension of the ONC HII nebula (red contours, Hacar et al. 2020) is indicated in the VISTA image. Panels b and c: equally spaced contours (black) every W(N2 H+(7−6)) = 2.5 K km s−1 and W(C18O (6−5)) = 10 K km s−1, respectively. For reference, the position of the Trapezium (white stars) and the Orion BN source (yellow star), as well as the first contour of the N2H+ (1–0) emission (W(N2H+(1−0)) = 1.0 K km s−1, white contour), are displayed in all panels (Hacar et al. 2018, see also Fig. 2a).
Current usage metrics show cumulative count of Article Views (full-text article views including HTML views, PDF and ePub downloads, according to the available data) and Abstracts Views on Vision4Press platform.
Data correspond to usage on the plateform after 2015. The current usage metrics is available 48-96 hours after online publication and is updated daily on week days.
Initial download of the metrics may take a while.