Fig. 5
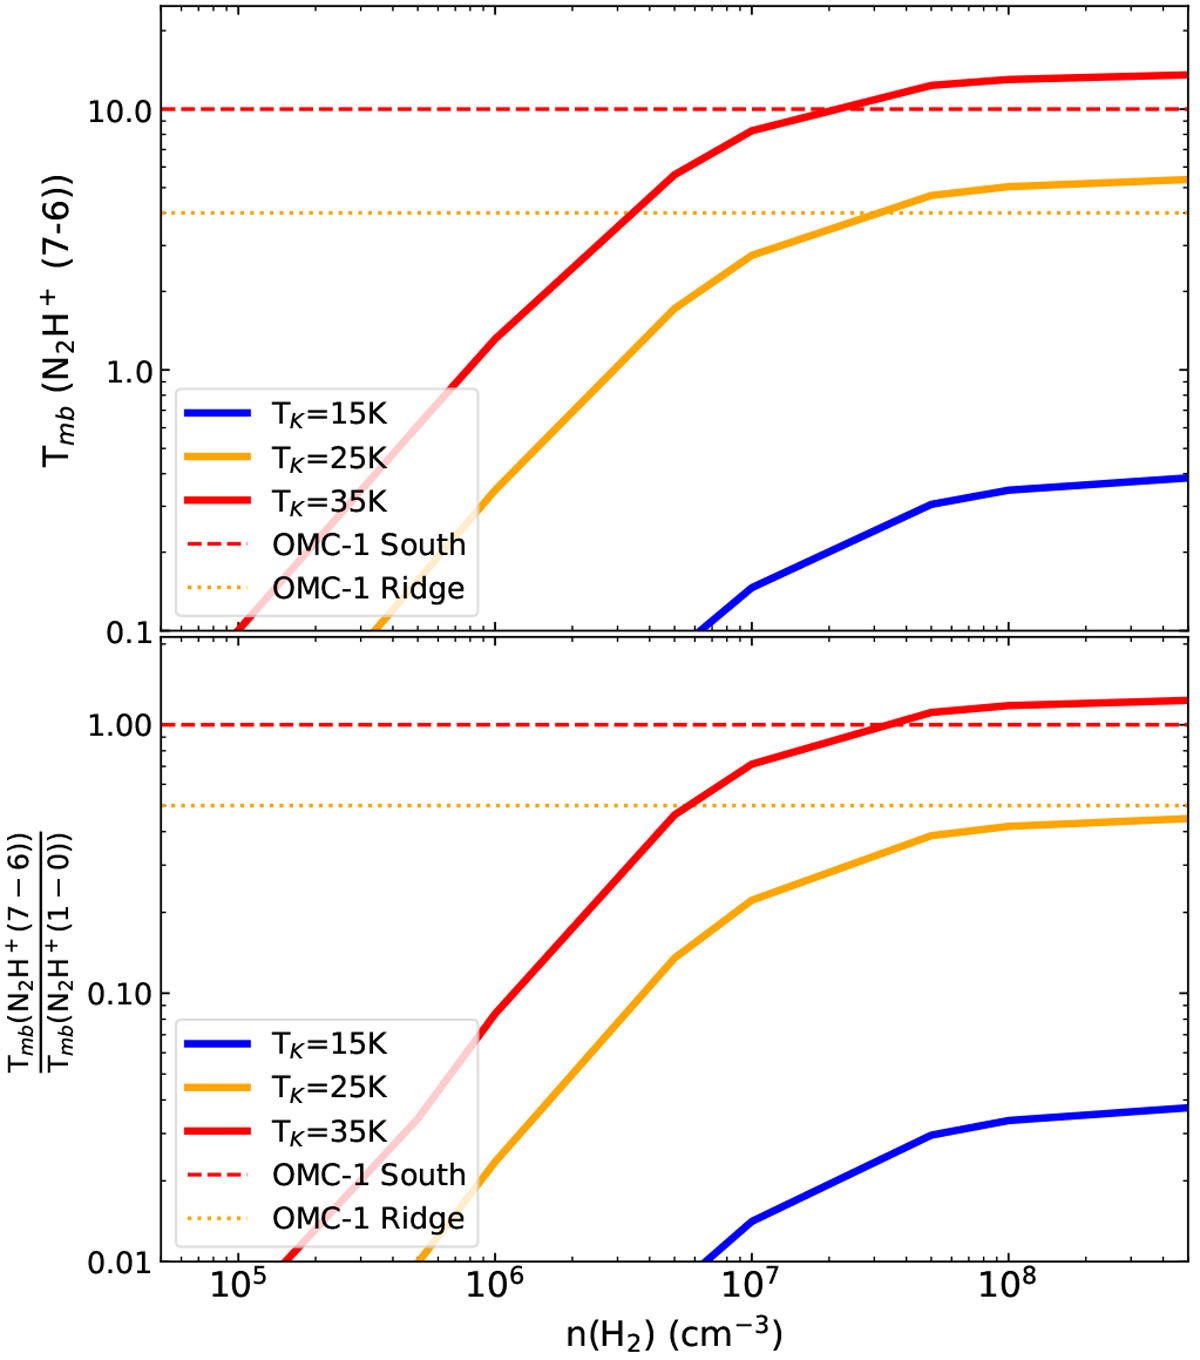
Expected N2H+ (7–6) line peak temperatures Tmb(N2H+ (7–6)) (top panel) and ratios respect the (1–0) transition ![]() (bottom panel) at densities n(H2) between 105
and 108 cm−3
and gas kinetic temperatures of TK = 15 K (blue), 25 K (orange), and 35 K (red) predicted by our RADEX simulations (van der Tak et al. 2007). The typical values found in OMC-1 South (red dashed line) and OMC-1 Ridge (orange dotted line) are indicated in both plots.
(bottom panel) at densities n(H2) between 105
and 108 cm−3
and gas kinetic temperatures of TK = 15 K (blue), 25 K (orange), and 35 K (red) predicted by our RADEX simulations (van der Tak et al. 2007). The typical values found in OMC-1 South (red dashed line) and OMC-1 Ridge (orange dotted line) are indicated in both plots.
Current usage metrics show cumulative count of Article Views (full-text article views including HTML views, PDF and ePub downloads, according to the available data) and Abstracts Views on Vision4Press platform.
Data correspond to usage on the plateform after 2015. The current usage metrics is available 48-96 hours after online publication and is updated daily on week days.
Initial download of the metrics may take a while.