| Issue |
A&A
Volume 647, March 2021
|
|
|---|---|---|
| Article Number | A170 | |
| Number of page(s) | 16 | |
| Section | Extragalactic astronomy | |
| DOI | https://doi.org/10.1051/0004-6361/202037967 | |
| Published online | 30 March 2021 | |
AGB and RGB stars in the dwarf irregular galaxy Leo A
1
Center for Physical Sciences and Technology, Saulėtekio Av. 3, 10257 Vilnius, Lithuania
2
Astronomical Observatory of Vilnius University, Saulėtekio Av. 3, 10257 Vilnius, Lithuania
e-mail: rima.stonkute@ftmc.lt
Received:
16
March
2020
Accepted:
23
January
2021
Context. Leo A is a gas-rich dwarf irregular galaxy of low stellar mass located in the outskirts of the Local Group. It has an extended star formation history with stellar populations spanning a wide age range (∼0.01−10 Gyr). As Leo A is a well-isolated dwarf galaxy, it is a perfect target to study a galactic structure formed entirely by processes of self-induced star formation.
Aims. Our aim is to study populations of the brightest asymptotic giant branch (AGB) stars and red giant branch (RGB) stars over the entire extent of the Leo A galaxy.
Methods. We analysed populations of AGB and RGB stars in the Leo A galaxy using multicolour photometry data obtained with the Subaru Suprime-Cam (B, V, R, I, Hα) and HST ACS (F475W, F814W) cameras. In order to separate the Milky Way and Leo A populations of red stars, we developed a photometric method that enabled us to study the spatial distribution of AGB and RGB stars within the Leo A galaxy.
Results. We found a previously unknown sequence of 26 peculiar RGB stars which probably have a strong CN band in their spectra (∼380−390 nm). This conclusion is supported by the infrared CN spectral features observed in four of these stars with available spectra from the literature. Additionally, we present a catalogue of 32 luminous AGB stars and 3 candidate AGB stars. Twelve AGB stars (three of them might have dusty envelopes) from this sample are newly identified; the remaining 20 AGB stars were already presented in the literature based on near-infrared observations. By splitting the RGB sequence into blue and red parts, we revealed different spatial distributions of the two subsets, with the former being more centrally concentrated than the latter. Cross-identification with spectroscopic data available in the literature suggests that the bulk of blue and red RGB stars are, on average, similar in metallicity; however, the red RGB stars might have an excess of metal-deficient stars of [Fe/H] < −1.8. We also found that the distributions of luminous AGB and blue RGB stars have nearly equal scale lengths (0.′87 ± 0.′06 and 0.′89 ± 0.′09, respectively), indicating that they could belong to the same generation. This conclusion is strengthened by the similarities of the cumulative distributions of AGB and blue RGB stars, both showing more centrally concentrated populations compared to red RGB stars. There is also a prominent decline in the ratio of AGB to RGB stars with an increasing radius. These results suggest that the star-forming disk of Leo A is shrinking, which is in agreement with the outside-in star formation scenario of dwarf galaxy evolution.
Key words: galaxies: dwarf / galaxies: individual: Leo A / galaxies: stellar content
© ESO 2021
1. Introduction
According to dwarf galaxy evolution scenarios (Stinson et al. 2009; Graus et al. 2019), star formation is predominantly confined to the inner regions where denser gas tends to reside. This leads to prominent age gradients forming over time in these galaxies as younger objects concentrate in the centre and the older ones spread out to larger radii (Hidalgo et al. 2013; McQuinn et al. 2017). While tidal interactions and gas accretion can clearly affect the distributions of stellar populations in dwarf galaxies, stellar feedback and star migration may also reduce real age gradients (El-Badry et al. 2016). Some nearby dwarf galaxies were found to have well-mixed intermediate-age and old stellar populations, even when external events are unlikely to have had any influence (Skillman et al. 2014; McQuinn et al. 2017). This suggests that a detailed study of the radial extent of different stellar populations within dwarf irregular galaxies might provide some insight into their dynamical and morphological evolution.
Asymptotic giant branch (AGB) stars and red giant branch (RGB) stars are excellent tracers of both morphology and chemical evolution of galaxies. RGB stars represent old (∼2−13 Gyr) stellar populations, which often have a large radial extent and dominate the outskirts of dwarf irregular galaxies, making them ideal tracers of the extent and the underlying structures (e.g., Vansevičius et al. 2004; Hidalgo et al. 2009; Sanna et al. 2010; Bellazzini et al. 2014; Stonkutė et al. 2018a). Luminous AGB stars are tracers of intermediate-age (∼1−3 Gyr) stellar populations, providing additional insight into the structural features and evolution of galaxies (McQuinn et al. 2017; Jones et al. 2018). These low- to intermediate-mass stars at the end of their evolution lose mass through stellar outflows or winds (for the details of evolution and stellar yields of these stars, see the review papers by Herwig 2005; Karakas & Lattanzio 2014), thus contributing to the chemical enrichment of the interstellar medium. The identification and analysis of such objects are therefore valuable for the understanding of structural and chemical evolution of dwarf galaxies.
In this paper we study the populations of AGB and RGB stars in Leo A, an isolated dwarf irregular galaxy located on the periphery of the Local Group at a distance of ∼800 kpc (Dolphin et al. 2003; Bernard et al. 2013). This dark matter dominated (∼80%; Brown et al. 2007; Kirby et al. 2017), gas-rich (Young & Lo 1996; Hunter et al. 2012), and metal-poor (van Zee et al. 2006; Kirby et al. 2017; Ruiz-Escobedo et al. 2018) galaxy has a low stellar mass (Kirby et al. 2017), yet contains multiple stellar populations covering a broad range of ages: H II regions trace recent star formation activity, while RR Lyrae stars (Dolphin et al. 2002; Bernard et al. 2013) indicate the existence of an ancient (≳10 Gyr) stellar population. Leo A is unique in the sense that it has significantly delayed star formation (Cole et al. 2007), which is unlikely to have been triggered by external processes, due to its isolation. The only other isolated dwarf irregular galaxy with a similar delay in star formation is Aquarius (Cole et al. 2014). Therefore, to understand the structure and evolution of a system governed entirely by the processes of self-induced star formation, we studied populations of AGB and RGB stars over the entire extent of Leo A using multicolour photometry data.
The parameters of the Leo A galaxy adopted in this study are provided in Table 1. We note, however, that based on a decontaminated sample of Leo A stars (see Sect. 2) an adjusted galaxy centre position was applied in RA (a shift by +0.5s), compared to the value provided by Vansevičius et al. (2004).
Parameters of the Leo A galaxy.
The paper is organized as follows. In Sect. 2 we describe the methods of star photometry catalogue decontamination. Bright-red star selection and data analysis are discussed in Sect. 3. Radial distributions of AGB and RGB stars are studied in Sect. 4. Finally, the summary and conclusions are given in Sect. 5.
2. Data reduction
Subaru Suprime-Cam stellar photometry data from Stonkutė et al. (2014) (B, V, I) and from Stonkutė et al. (in prep.) (R, Hα) were used as the basis for our study. Crowded-field point spread function (PSF) stellar photometry in R and Hα passbands was performed in the same way as described by Stonkutė et al. (2014). We limited the catalogue to objects with V < 24 since distant background galaxies that are barely distinguishable from stellar sources in the Subaru data start to heavily contaminate the diagrams at fainter magnitudes. Although the Subaru Suprime-Cam stellar photometry catalogue was initially decontaminated of extended sources based on PSF model fitting results and a visual inspection of optical images (Stonkutė et al. 2014), numerous contaminants, such as foreground Milky Way (MW) stars, stellar blends, and some of the background galaxies, are still present in the catalogue. To reduce the impact these objects might have on our results, additional steps were taken to further decontaminate the catalogue.
All steps taken to decontaminate the catalogue are shown in Figs. A.1–A.3. Firstly, we used high-resolution Hubble Space Telescope (HST) Advanced Camera for Surveys (ACS) frames (from the HST programme 10590) to visually identify background galaxies and stellar blends in the Subaru Suprime-Cam catalogue. Cross-identified contaminants (black dots in panels a–c of Fig. A.1) within the central ellipse of  (the largest possible ellipse centred on Leo A that fits entirely within the HST ACS field; see Fig. A.1d) were removed from the Subaru catalogue. Secondly, the part of the catalogue containing objects residing outside the ellipse of
  was decontaminated by restricting the values of sharpness and χ2 parameters (both are indicators of the stellar PSF fit quality to the objects’ images). We selected limits for the two parameters, as depicted in Figs. A.2 and A.3 for the crowded inner part of the galaxy (
 ) and the outer parts (
 ), respectively. The limit of
  was selected based on the completeness of photometry; starting at this radial distance and moving outwards the photometry completeness limit almost does not change. We note that restrictions for the sharpness parameter were chosen to be tighter in the outer part of the galaxy (Figs. A.3f–j) due to lower star image contaminations in less crowded fields. Objects that fall outside the indicated limits in at least three different passbands were not included in further analysis (black dots in Figs. A.2 and A.3, and panels e–h in Fig. A.1). In addition, in Fig. A.2 we show sharpness and χ2 parameter values for contaminant sources identified by visually inspecting HST ACS images (cyan circles).
The catalogue was also decontaminated of foreground MW dwarfs of K-M spectral types by eliminating a prominent sequence of stars in a two-colour diagram, V − I versus B − V (Fig. A.1k). The sequence is covered well by the isochrones with metallicities corresponding to the stellar populations of MW; Z is in the range of 0.001−0.015. Additionally, several stars in this sequence have spectroscopic measurements obtained by Kirby et al. (2017) and were shown not to belong to the Leo A galaxy. The colour–magnitude diagrams (CMDs) of MW dwarfs are provided in panels i and j of Fig. A.1, and the spatial distribution is shown in panel l.
Within the Leo A field (a < 10′) all decontamination procedures reduced the initial number of catalogue objects by ∼22% (interactively removed objects ∼13%; extended objects with poor image quality ∼6%; MW dwarfs ∼3%).
3. Populations of AGB and RGB stars
We used CMDs of decontaminated Subaru Suprime-Cam data to select AGB and RGB stars in Leo A. Firstly, we identified the luminous AGB stars and cross-identified them with data available in the literature, which allowed us to determine their variability and recognize photometric properties of dust-enshrouded stars. Secondly, we selected limits for the RGB stars, and further decontaminated the sample by excluding stars showing unusual behaviour in various CMDs. The cleaned sample of RGB stars was used to determine the distance to the Leo A galaxy, while the excluded unusual stars helped us to identify a peculiar sequence of RGB stars that, when combined with spectroscopic data available in the literature, appear to show a differing chemical composition.
3.1. AGB stars in the Leo A galaxy
An I versus V − I diagram was used to select AGB stars. We define AGB stars as being brighter and redder than the tip of the RGB (TRGB, I = 20.55, V − I = 1.43; see Sect. 3.2.1), as is indicated by the black lines in Fig. 1a. The selected sample consists of 32 such objects (red symbols in Fig. 1). In addition, there are three stars (red open circles in Fig. 1) whose positions in CMDs are rather different from those of the selected AGB stars and are more in agreement with those of MW K-M type dwarfs (black dots in Fig. A.1i–k); however, they are known to be variable (see Sect. 3.1.1) and might have distinct photometry due to their variability. We define these stars as AGB candidates (cAGB). PARSEC isochrones (Bressan et al. 2012) of Z = 0.0007 metallicity are overlaid in panels a and b of Fig. 1 to roughly indicate the approximate age range of the luminous AGB stars in Leo A. The photometric catalogue of AGB and cAGB stars is provided in Table B.1, and identification charts are available in Figs. C.1–C.3.
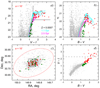 |
Fig. 1. Diagrams of decontaminated Subaru Suprime-Cam photometry data. Panel a: I vs. V − I diagram. Red symbols are AGB stars (selection limits for the luminous AGB stars are indicated by black lines): dots – AGB stars; asterisks – AGB stars with circumstellar dusty envelopes (see Sect. 3.1.2); open circles – cAGB stars. Green dots are peculiar RGB stars (see Sect. 3.2.2). Grey dots are the remaining objects in the decontaminated catalogue. Symbols and colours correspond to the same objects in all panels. PARSEC release v1.2S isochrones (Bressan et al. 2012) of 1.1 Gyr (cyan) and 2.5 Gyr (magenta) ages and of Z = 0.0007 metallicity are overlaid in panels a and b. The isochrones are shifted in magnitude and colour, adopting a true distance modulus of 24.58 (see Sect. 3.2.1), using foreground MW extinction derived from Schlafly & Finkbeiner (2011) data, and assuming the Fitzpatrick (1999) reddening law RV = 3.1 (AB = 0.075, AV = 0.057, AI = 0.031). Panel b: V vs. B − V diagram. Panel c: spatial distribution of objects within the a = 10′ ellipse centred on the Leo A galaxy. Ellipticity of the depicted ellipse is b/a = 0.6 and the position angle of the major axis is PA = 114°. A black square shows the area ( |

We cross-identified AGB stars with observations available in the Gaia Data Release 2 (DR2; Gaia Collaboration 2018) and found that three of them (AGB04, AGB16, AGB32) have proper motion measurements. However, these AGB stars are rather faint, having magnitudes close to the Gaia photometric limit of G = 20.7 (Gaia Collaboration 2016). With this limitation in mind, we cannot confidently assume Gaia’s measurements to be reliable enough to exclude these stars from our sample, especially considering that multiple photometric properties determined from the Subaru data suggest that these stars belong to a population of AGB stars in the Leo A galaxy. A spectroscopic analysis is needed in order to reveal the true nature of these stars.
3.1.1. Variable AGB stars
We cross-identified AGB stars with the variable star catalogues available in the literature. We find our selected AGB and cAGB stars to be long-period variables (LPVs) identified in the works of Snigula (2006), Gössl (2007), and Jones et al. (2018) (Table B.2). AGB13, AGB15, and AGB16 also have counterparts among candidate LPVs listed in Bernard et al. (2013), namely VC05, VC09, and VC12. AGB27 and cAGB02 are the only stars that have a match in the variable star catalogue of the DUST in the Nearby Galaxies with Spitzer (DUSTiNGS) survey (Boyer et al. 2015). The cross-identification results are summarised in Table B.2.
3.1.2. Dusty AGB stars
Jones et al. (2018) obtained near-infrared (NIR) observations for the Leo A galaxy using the WIYN High-resolution Infrared Camera (WHIRC) at Kitt Peak with the aim of studying dusty evolved stellar populations in the central part of this galaxy. The AGB stars studied in the present work are the equivalent of such populations, thus we cross-identified the objects in the two catalogues in order to compare their properties and expand the list of the possibly dusty stars in Leo A.
We find that 3 cAGB stars and 20 AGB stars that fall within the WHIRC field of view (Fig. 1c) have NIR counterparts. Based on the dust production rate (DPR) Jones et al. (2018) classified six of these objects (five AGB stars and one cAGB star) as dust-producing stars (DPR > 10−11 M⊙ yr−1; see the second-to-last column in Table B.1). Five of these dusty stars belong to a conspicuous group of the 11 reddest (V − I > 2.3) AGB and cAGB stars (Fig. 1). It is likely that all stars in this group (nine AGB and two cAGB stars) have prominent dust envelopes. Stars with possible dusty envelopes are flagged with a value of 1 in the last column of Table B.1. Stars at V − I ∼ 2 also show some distinction in their colour and magnitude when compared to other AGB stars, albeit not as pronounced.
3.2. RGB stars in the Leo A galaxy
We set the limits of our RGB star sample (Figs. 2a and d, red lines) to just two magnitudes below the TRGB in order to avoid contamination by the red clump stars and by foreground and background objects that become increasingly numerous at fainter magnitudes. In addition, we employed the parameter QBVI = (B − V)−(V − I)⋅(EB − V/EV − I) (Fig. 2b) and the colour index Hα − R (Fig. 2c) to eliminate objects with an Hα emission or other distinct features in their spectra (e.g., emerging due to an unusual chemical composition), causing those objects to lie outside of the bulk of the RGB stars in various multicolour photometry diagrams. The outliers were removed from the initial RGB sample of 726 stars by applying the following criteria: (24.73 − I)/9.52 < QBVI < (21.83 − I)/9.52, where we applied EB − V/EV − I = 0.72 calculated for the characteristic colour index V − I ∼ 1.3 of RGB stars (Taylor 1986), and |Hα − R| > 0.05. These restrictions reduced the RGB sample to 648 stars. The CMD of the final sample of 648 RGB stars is given in Fig. 2d.
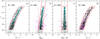 |
Fig. 2. RGB star selection. Decontaminated CMDs (in the present work) from Subaru Suprime-Cam photometry with spectroscopically confirmed members of Leo A (Kirby et al. 2017) are overlaid as cyan crosses. Panel a: I vs. V − I diagram with the selection box for RGB stars outlined in red. All RGB stars falling within an ellipse of a = 8′ are shown as black dots (N = 726). Panel b: I vs. QBVI diagram used to decontaminate the RGB sample of objects with unusual spectra. All the outliers (magenta dots; N = 63) lying outside of the two inclined lines were removed from the sample. Panel c: I vs. Hα − R diagram showing additionally removed objects with |Hα − R| > 0.05 (magenta dots; N = 15). Panel d: CMD of the decontaminated sample of RGB stars (black dots; N = 648) and removed from the RGB sample stars (magenta dots; N = 78). |
3.2.1. TRGB distance to the Leo A galaxy
The high quality of the RGB star photometry data (Fig. 2) suggested that we should apply the TRGB method for distance determination to the Leo A galaxy independently from previous studies. We used the method’s prescriptions presented by Rizzi et al. (2007) and the TRGB MI calibration versus [M/H] from Bellazzini et al. (2004). Taking into account a metallicity range of the bulk of RGB stars, [Fe/H] ∼ −1.3 ÷ −1.7, and a normal α-element abundance, [α/Fe] = 0.04 ± 0.05, estimated based on data by Kirby et al. (2017), we derived the absolute magnitude of the RGB tip to be equal to MI = −4.06 ± 0.03. We also determined the TRGB magnitude and colour index: I = 20.55 ± 0.01; V − I = 1.43 ± 0.03 (based on stars residing in the upper part (I ≲ 21) of the RGB sequence). Therefore, the true distance modulus, (m − M)0, of the Leo A galaxy, assuming an extinction of AI = 0.031 (Schlafly & Finkbeiner 2011), is equal to 24.58 ± 0.04 (824 ± 15 kpc). We note, however, that here we sum up only statistical uncertainties, and any systematic calibration errors are not taken into account; the systematic error of the used method is estimated to be ±0.12 (Bellazzini et al. 2004).
Our estimate of the true distance modulus is in perfect agreement with previous determinations based on the TRGB method: 24.59 ± 0.06 (corrected taking into account MI = −4.06; Dolphin et al. 2003) and 24.57 ± 0.13 (Bernard et al. 2013), and with the value based on Cepheids 24.59 ± 0.03 (Tammann et al. 2011). Also, the true distance modulus derived in this paper is in reasonable agreement with those based on RR Lyrae stars (24.51 ± 0.12, Dolphin et al. 2002; 24.48 ± 0.12, Bernard et al. 2013) and Cepheids (24.70 ± 0.10, Bernard et al. 2013).
3.2.2. Peculiar sequence of the RGB stars
There is a clearly seen well-pronounced sequence of 26 stars to the right of the RGB stars in the I versus QBVI diagram (see Fig. 3a). It is also prominent in other CMDs (see green symbols in Figs. 1 and 3). Hereafter, we refer to this unusual sequence as a peculiar RGB (pRGB). We include in the pRGB sample only the brighter stars (I ≲ 23) and leave out the fainter ones, as the separation between them and other RGB stars becomes dubious due to the greater spread in colour caused by larger photometric errors (Fig. 1b). A catalogue of 26 pRGB stars is provided in Table B.3, and identification charts are shown in Figs. C.4 and C.5.
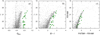 |
Fig. 3. CMDs of pRGB stars. The green symbols are pRGB stars: open circles – stars with metallicity significantly higher than average (Kirby et al. 2017); asterisks – stars with enhanced CN band absorption (Kirby et al. 2017); dots – stars without spectroscopic measurements. Panels a and b: decontaminated CMDs from Subaru Suprime-Cam photometry (Stonkutė et al. 2014). Panel c: CMD from HST ACS photometry (Stonkutė et al. 2018b). |
In Fig. 3 we provide CMDs of stars in Leo A from both the Subaru Suprime-Cam (panels a and b; Stonkutė et al. 2014) and the HST ACS (panel c; Stonkutė et al. 2018b) photometry, where we depict pRGB stars as green symbols. Dots indicate stars with no spectroscopic data, while open circles and asterisks indicate the six stars that are spectroscopically confirmed members of the Leo A galaxy (Kirby et al. 2017). Open circles indicate stars with a significantly higher metallicity than the average of the Leo A stars and asterisks: stars with CN band absorption.
Figure 1c depicts an observed spatial distribution of pRGB stars (green dots), which are concentrated in the galaxy rather than distributed uniformly throughout the field, as is typical for foreground objects, thus leading us to assume that these stars are genuine members of Leo A. In addition, photometry data of pRGB stars are not contaminated by neighbouring objects or defects (see Figs. C.4 and C.5) making it more likely that any discrepancies in CMDs are due to distinct physical properties of the stars rather than to photometric errors.
All six stars of the pRGB sequence, that have spectroscopic measurements obtained by Kirby et al. (2017), have distinct properties from the rest of stars in their sample (N = 168). The metallicity of pRGB01 and pRGB24 (green open circles in Fig. 3) is significantly higher ([Fe/H] = −0.88 ± 0.11 and −0.57 ± 0.11, respectively) compared to the average derived for the RGB star sample ( ). Four pRGB stars (pRGB11, pRGB18, pRGB21, and pRGB25; green asterisks in Fig. 3) show CN band absorption. It is worth noting that the CN features in the spectra were found only for 6 of the 168 stars studied by Kirby et al. (2017): four pRGB stars, plus one regular RGB star that does not show any unusual behaviour in various CMDs, and one star that Kirby et al. (2017) assumed not to be a member of Leo A. We also classify this star as a dwarf of the K-M spectral type residing in MW, based on its position in the V − I versus B − V diagram, as described in Sect. 2.
In the HST ACS CMD (Fig. 3c) the pRGB is less pronounced compared to Subaru Suprime-Cam photometry (Figs. 3a and b) due to differences of the B and F475W passband shapes in the range of ∼380−390 nm. However, 7 out of 15 pRGB stars, which fall within the HST ACS field, are located beyond the red limit of the RGB sequence. This, together with the already confirmed CN band absorption (Kirby et al. 2017) in some of the pRGB stars, indicates that molecular absorption might be the reason behind the prominent split between RGB and pRGB sequences. Strong molecular absorption features in certain spectral regions can selectively affect measurements even in broad photometric bands; thus, an object showing such absorption in its spectrum would have distinct photometry and unusual position in CMDs (Battinelli & Demers 2006).
The pRGB stars could be objects similar to the carbon stars studied by Hamren et al. (2016) in the satellites and halo of the M 31 galaxy. Hamren et al. (2016) have identified 41 carbon stars, many of which are fainter than the TRGB and also bluer in V − I colour than luminous, carbon-rich, thermally pulsating AGB stars. They infer that these objects are likely to be extrinsic carbon stars, RGB stars that have been enriched with carbon by mass transfer from their carbon-rich AGB companions in close binary systems (Izzard & Tout 2004). It is possible that pRGB stars in Leo A are also extrinsic carbon stars; however, a more in-depth spectroscopic analysis of pRGB stars is required in order to determine the origin of these anomalous objects.
4. Radial distributions of the AGB and RGB stars
Since luminous AGB and RGB stars are tracers of intermediate-age and old stellar populations, respectively, radial distributions of these stars can reveal characteristic structural properties of a galaxy. In the case of Leo A, there is a noticeable difference in the distribution of RGB stars within our selected limits in the I versus V − I diagram, with a considerably higher concentration of stars on the red side compared to the blue side (see Fig. 2d). To see whether there are any considerably distinct populations within the RGB sequence, we decided to analyse it in more detail. In Fig. 4 we divide the RGB sequence into blue (bRGB; Δ(V − I) = 0.06) and red (rRGB; Δ(V − I) = 0.1) parts, following the mentioned differences in concentration. The division results in the subset of rRGB stars are three times as large as that of bRGB stars (NbRGB/NrRGB = 0.34). We note that decontamination procedures described in Sects. 2 and 3.2 do not account for a significant difference in the number of stars within the two groups (in total 125 objects were removed from the RGB sample: 71 from bRGB, 54 from rRGB).
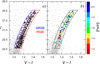 |
Fig. 4. Panel a: I vs. V − I CMD of decontaminated RGB stars (black dots). Selected zones for the bRGB and rRGB stars are outlined in blue and red, respectively. Panel b: RGB stars with available spectroscopic measurements (Kirby et al. 2017) colour-coded by their [Fe/H] values. Selected zones (same as in panel a) for bRGB and rRGB stars are outlined with black lines. |
In order to study connections between colour, metallicity, and spatial distribution of red giant stars, we cross-identified our RGB stars with the ones from Kirby et al. (2017) possessing spectroscopic data. In panel b of Fig. 4, stars with available spectroscopic measurements are overlaid on our selected RGB sample (the outlines for bRGB and rRGB samples are shown in black) and colour-coded by their metallicity. There appears to be no clear relation between metallicity and colour of the RGB stars. The metallicity distribution histograms of bRGB and rRGB stars (Fig. 5) do indeed look similar in the metallicity range of −1.8 ≲ [Fe/H] ≲ −1.3; however, some excess (∼1.5 times) of the lowest metallicity ([Fe/H] < −1.8) rRGB stars compared to the corresponding bRGB stars is noticeable. We note that the sample of available spectroscopic measurements (Kirby et al. 2017) for the bRGB stars is 3.15 times smaller than for the rRGB stars (20 and 63, respectively).
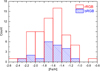 |
Fig. 5. Metallicity distributions for bRGB (blue) and rRGB (red) stars from the spectroscopic sample of Kirby et al. (2017). |
Leo A has an extended star formation history (Cole et al. 2007; Skillman et al. 2014), thus it is expected that its RGB stars include multiple generations of stars with ages ≳1 Gyr, all contributing to the spread of the RGB sequence, as older stars tend to be redder and the younger ones bluer. However, the extended star formation history also suggests that distinct generations of stars might have different metallicities, with younger stars being more metal rich as a result of forming from gas pre-enriched by the progenitor stars. Metallicity has an opposite effect to that of age: metal-rich stars tend to be redder than metal-poor ones. Counteracting effects of age and metallicity being just large enough to compensate for each other could explain a very narrow RGB (Δ(V − I)∼0.2) of the Leo A galaxy. Such a case of age–metallicity degeneracy is clearly reflected in the Carina dwarf spheroidal galaxy, where stellar populations with obviously distinct ages form a very narrow RGB (Koch et al. 2006; Venn et al. 2012).
Kirby et al. (2017) found that the age–metallicity relation for the Leo A galaxy is rather shallow and only turns up during the past 5 Gyr; this result is in agreement with findings by Skillman et al. (2014), who also found that a noticeable progressive increase in metallicity with time started ∼5 Gyr ago when star formation in Leo A became more active (Cole et al. 2007), leading to subsequent generations of stars being increasingly more metal-rich. This indicates that a spread in colour of the oldest (≳5 Gyr) stars might be predominantly due to age, while the younger stars (∼2−5 Gyr) might, in addition, be redder due to higher metallicity. If we look at I versus V − I CMD presented in Fig. 4b, we see that RGB stars of various metallicities overlap, indicating that an age–metallicity degeneracy is present.
Even though there is no noticeable distinction between different populations of RGB stars in a CMD (Fig. 4), there is a considerable difference in the spatial distribution of bRGB and rRGB stars, as can be seen in panels a and c of Fig. 6. The bRGB stars are concentrated in the central part of the Leo A galaxy. The rRGB stars are significantly more spread apart and have a more uniform distribution. By analysing the bRGB-to-rRGB star ratio at different radial distances, we see that while stars are nearly equally numerous in the very centre ( ) of the galaxy, with NbRGB/NrRGB = 0.58, the ratio decreases greatly going to larger radii. Within an elliptical annulus of
  the ratio already drops to 0.33, and even further out, at
  , bRGB stars are so scarce that the ratio is just 0.09. The difference in the number density of the two subsets of RGB stars seems to be too large in the outer part of the galaxy to be attributed to different sizes of the star samples. It appears from these results that the bRGB stars are confined to
  , the Holmberg radius (B = 26.5 mag arcsec−2) of the Leo A galaxy (Mateo 1998). It is interesting to note that in the case of the Cetus dwarf spheroidal galaxy, Taibi et al. (2018) reported reversed distributions: red RGB stars are more concentrated than blue RGB stars. Cetus shows a clearly divided RGB with red stars being metal-rich and blue ones metal-poor; Leo A, on the other hand, shows hardly any correlation between the colour and metallicity of RGB stars. Cetus formed most of its stars in the early stages of evolution and had virtually no star formation for the past ∼8 Gyr, thus the spread of its RGB is primarily determined by stellar metallicity. On the contrary, Leo A had a continuous star formation history throughout its lifetime, which resulted in a wide range of ages and metallicities causing RGB stars from various generations to overlap. These properties indicate some possible variance between different types of galaxies: dwarf spheroidal (Cetus) and dwarf irregular (Leo A).
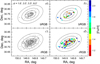 |
Fig. 6. Spatial distribution of bRGB (panels a and b) and rRGB (panels c and d) stars. Colour-coding by [Fe/H] values in panels b and d is the same as in Fig. 4b. Parameters of the depicted ellipses are as follows: semi-major axis, a (indicated in panel a); ellipticity, b/a = 0.6; position angle of the major axis, PA = 114°. |
Additionally, in panels b and d of Fig. 6, stars with spectroscopic measurements from Kirby et al. (2017) are overplotted on the distributions of bRGB and rRGB stars, respectively, and colour-coded to represent their metallicity in the same manner as depicted in panel b of Fig. 4. However, while no distinct characteristics of RGB stars of different metallicities are visible in the CMD, the spatial distribution does reveal that more metal-rich stars tend to concentrate in the central part of the galaxy and only metal-poor stars are detected in the outskirts.
Additional insight into the distribution of RGB stars might be gained from their surface number density profiles and cumulative distributions (see panels a and b of Fig. 7, respectively). A high concentration of bRGB stars towards the centre and a rapid decrease in number density moving outwards results in a considerably steeper profile than that of rRGB stars with scale lengths (SLs) of the two populations in the inner part of the galaxy ( ) being
  and
and  , respectively. Centrally concentrated AGB stars have a SL of
  , nearly identical to that of bRGB stars, which suggests that these populations are likely to represent the same generation of stars. In addition, cumulative distributions in panel b also show similarities between the two populations, as 90% of both luminous AGB and bRGB stars are located within the Holmberg radius (
 ), as opposed to more spread out populations of pRGB and rRGB stars that reach the 90% mark at a ∼ 5′. The pRGB star surface number density profile has a SL of
  (a < 4′), which coincides with those of AGB and bRGB stars. However, the complicated form of pRGB star profiles derived within the entire radial range (a ≲ 8′; Fig. 7) does not provide strong grounds to conclude that it is related to the other stellar populations discussed above.
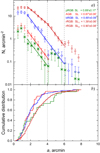 |
Fig. 7. Panel a: surface number density profiles of RGB stars (bRGB – blue diamonds, rRGB – dark red squares), AGB stars (red circles), and pRGB stars (green asterisks) measured in elliptical annuli. Linear fits are shown for different segments of the profiles, and corresponding SL values are indicated in the legend (subscript numbers indicate the segments going from left to right). Vertical dashed lines indicate a limit for a crowded central part of the galaxy ( |

Two prominent breaks at a ∼ 4′ and 6′ are clearly visible in the profile of rRGB stars. The former coincides with the edge of the distribution of bright AGB stars, while the latter is consistent with the beginning of the stellar halo of the Leo A galaxy at  , as found by Vansevičius et al. (2004). Some overdensities, seen in the distribution of stars beyond the Holmberg radius (Fig. 6c), might be responsible for these breaks in the radial profiles since we approximate this somewhat irregular star distribution with ellipses.
Since bRGB stars are more concentrated at the centre of the Leo A galaxy (Fig. 6b) and metal-rich stars from the rRGB sample are also located at the centre (Fig. 6d), it is reasonable to assume that the majority of metal-rich RGB stars (including the ones that do not have spectroscopic measurements) are located within the Holmberg radius (see also the metallicity gradient of RGB stars in Leo A shown in Fig. 11 of Kirby et al. 2017). Looking at the distributions (panels a and c of Fig. 6) and profiles (Fig. 7) of bRGB and rRGB stars, it seems safe to assume that bRGB and rRGB stars in the inner part of the galaxy indeed have significantly different SLs. These two results both indicate a seemingly shrinking star-forming disk of Leo A, which is in agreement with the outside-in star formation scenario of dwarf galaxy evolution (see e.g., Bernard et al. 2007; Zhang et al. 2012; Hidalgo et al. 2013; Benítez-Llambay et al. 2016).
To further test the outside-in star formation scenario, we plotted the ratios of a number of luminous AGB to RGB stars versus the radial distance along the major axis of the galaxy (see Fig. 8a). In Fig. 8b we show the number of AGB stars detected in elliptical annuli. McQuinn et al. (2017) analysed the spatial distributions of thermally pulsating AGB stars (tracing intermediate-age populations) and RGB stars (old populations) in nine dwarf galaxies residing in the outskirts of the Local Group. A prominent decline in the ratio of AGB to RGB stars with increasing radius observed in Leo A is similar to the declines present in the IC 10, NGC 147, and NGC 185 galaxies, while six other galaxies in their sample have well-mixed intermediate-age and old populations. AGB stars in Leo A are traced to just a little over the Holmberg radius (with an exception of a single outlier, AGB32, at a ∼ 8′), while thermally pulsating AGB stars are detected well beyond this radius in all galaxies from the sample of McQuinn et al. (2017) (see the last column in their Table 5 for the values of Holmberg’s radii of each galaxy). This implies that in Leo A intermediate-age populations are indeed more centrally concentrated compared to old stellar populations, which is also in agreement with the outside-in star formation scenario.
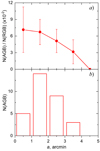 |
Fig. 8. Panel a: ratio of luminous AGB to RGB stars in elliptical annuli. Panel b: number of luminous AGB stars in elliptical annuli. |
5. Summary and conclusions
We used multicolour Subaru Suprime-Cam and HST ACS photometry data to study populations of red stars in the Leo A galaxy. We identified 32 bright AGB stars and 3 AGB candidates (cAGB), which we compared with NIR data obtained by Jones et al. (2018), and determined distinct photometric properties of dusty evolved stars, resulting in 9 AGB and 2 cAGB stars (V − I > 2.3) that are likely to have dusty envelopes. Out of our identified 32 luminous AGB stars, 12 (3 of which are possibly dust-enshrouded) were detected outside the field of available NIR observations (Jones et al. 2018), thus expanding the list of such objects in Leo A to cover the entire extent of the galaxy. We note, however, that only objects that are not significantly obscured by dust, and thus detectable in the optical range, are included in this study.
We also identified the peculiar RGB (pRGB) sequence that is well separated from the normal RGB in diagrams that include measurements in the B passband (Figs. 3a and b). Spectroscopic measurements (Kirby et al. 2017) available for 6 of the 26 pRGB stars actually show distinct features (a CN band absorption or relatively high metallicity) in the spectra of these stars, indicating that the entire sequence (including the stars that do not have available spectroscopic measurements) might indeed be populated with carbon-enhanced or metal-peculiar stars.
Dividing the RGB sequence into two parts revealed fundamentally different distributions of blue and red RGB stars (bRGB and rRGB stars, respectively). The former are centrally concentrated and their distribution has a nearly clear cut at the Holmberg radius ( ; Mateo 1998), while the latter extends considerably further out (to at least 8′). Surface number density profiles also reveal significant details about the distribution of bRGB and rRGB stars. Firstly, SLs in the inner part of the galaxy (a < 4′) are considerably different for bRGB and rRGB stars, with values of
  and
and  , respectively. Secondly, the SL of AGB stars (
 ) is practically the same as that of bRGB stars, suggesting that they could belong to the same generation. Additionally, cumulative distributions of AGB and bRGB stars also show some similarities, as both are considerably more centrally concentrated (90% of stars are located within an ellipse of
  ) when compared to rRGB and pRGB stars (90% at a ∼ 5′). We note, however, that the SL of pRGB stars (
 , a < 4′) is very similar to those of AGB and bRGB; however, the unusual nature of these objects makes it difficult to determine whether they belong to any one population, or if they are a combination of objects from several generations. Adding the available spectroscopic data (Kirby et al. 2017) to the analysis allowed us to demonstrate that the metallicity distributions of bRGB and rRGB stars look similar in the metallicity range of −1.8 ≲ [Fe/H] ≲ −1.3; however, some excess of the lowest metallicity ([Fe/H] < −1.8) rRGB stars, compared to the corresponding bRGB stars, is noticeable. A concentration of the most metal-rich stars in the bRGB and rRGB samples in the central region of the galaxy is evident, as is the prominent decline in the ratio of AGB to RGB stars with increasing radius, all indicating that younger stellar populations reside in the inner part of Leo A.
Distinct structural components with notable differences in age and spatial extent imply an outside-in star formation or efficient star migration to the outskirts of the Leo A galaxy in early stages of its evolution. This might indicate that even isolated small-size and low-mass galaxies like Leo A have a non-trivial star formation history and structure evolution scenario driven solely by the processes of stellar evolution.
Acknowledgments
We are thankful to the anonymous referee for many constructive suggestions and criticism, which helped to improve the paper considerably. We are grateful to Rokas Naujalis for providing us with the results of an independent visual inspection of stars from the Subaru catalogue. This research was funded by a grant No. LAT-09/2016 from the Research Council of Lithuania. This research has made use of the NASA/IPAC Extragalactic Database (NED), which is funded by the National Aeronautics and Space Administration and operated by the California Institute of Technology.
References
- Battinelli, P., & Demers, S. 2006, A&A, 447, 473 [NASA ADS] [CrossRef] [EDP Sciences] [Google Scholar]
- Bellazzini, M., Ferraro, F. R., Sollima, A., Pancino, E., & Origlia, L. 2004, A&A, 424, 199 [NASA ADS] [CrossRef] [EDP Sciences] [Google Scholar]
- Bellazzini, M., Beccari, G., Fraternali, F., et al. 2014, A&A, 566, A44 [NASA ADS] [CrossRef] [EDP Sciences] [Google Scholar]
- Benítez-Llambay, A., Navarro, J. F., Abadi, M. G., et al. 2016, MNRAS, 456, 1185 [NASA ADS] [CrossRef] [Google Scholar]
- Bernard, E. J., Aparicio, A., Gallart, C., Padilla-Torres, C. P., & Panniello, M. 2007, AJ, 134, 1124 [NASA ADS] [CrossRef] [Google Scholar]
- Bernard, E. J., Monelli, M., Gallart, C., et al. 2013, MNRAS, 432, 3047 [NASA ADS] [CrossRef] [Google Scholar]
- Boyer, M. L., McQuinn, K. B. W., Barmby, P., et al. 2015, ApJ, 800, 51 [NASA ADS] [CrossRef] [Google Scholar]
- Bressan, A., Marigo, P., Girardi, L., et al. 2012, MNRAS, 427, 127 [NASA ADS] [CrossRef] [Google Scholar]
- Brown, W. R., Geller, M. J., Kenyon, S. J., & Kurtz, M. J. 2007, ApJ, 666, 231 [NASA ADS] [CrossRef] [Google Scholar]
- Cole, A. A., Skillman, E. D., Tolstoy, E., et al. 2007, ApJ, 659, L17 [NASA ADS] [CrossRef] [Google Scholar]
- Cole, A. A., Weisz, D. R., Dolphin, A. E., et al. 2014, ApJ, 795, 54 [NASA ADS] [CrossRef] [Google Scholar]
- Dolphin, A. E., Saha, A., Claver, J., et al. 2002, AJ, 123, 3154 [NASA ADS] [CrossRef] [Google Scholar]
- Dolphin, A. E., Saha, A., Skillman, E. D., et al. 2003, AJ, 125, 1261 [NASA ADS] [CrossRef] [Google Scholar]
- El-Badry, K., Wetzel, A., Geha, M., et al. 2016, ApJ, 820, 131 [NASA ADS] [CrossRef] [Google Scholar]
- Fitzpatrick, E. L. 1999, PASP, 111, 63 [NASA ADS] [CrossRef] [Google Scholar]
- Gaia Collaboration (Prusti, T., et al.) 2016, A&A, 595, A1 [NASA ADS] [CrossRef] [EDP Sciences] [Google Scholar]
- Gaia Collaboration (Brown, A. G. A., et al.) 2018, A&A, 616, A1 [NASA ADS] [CrossRef] [EDP Sciences] [Google Scholar]
- Gössl, C. A. 2007, PhD Thesis, Ludwig-Maximilians-Universität München [Google Scholar]
- Graus, A. S., Bullock, J. S., Fitts, A., et al. 2019, MNRAS, 490, 1186 [Google Scholar]
- Hamren, K., Beaton, R. L., Guhathakurta, P., et al. 2016, ApJ, 828, 15 [NASA ADS] [CrossRef] [Google Scholar]
- Herwig, F. 2005, ARA&A, 43, 435 [NASA ADS] [CrossRef] [Google Scholar]
- Hidalgo, S. L., Aparicio, A., Martínez-Delgado, D., & Gallart, C. 2009, ApJ, 705, 704 [Google Scholar]
- Hidalgo, S. L., Monelli, M., Aparicio, A., et al. 2013, ApJ, 778, 103 [NASA ADS] [CrossRef] [Google Scholar]
- Hunter, D. A., Ficut-Vicas, D., Ashley, T., et al. 2012, AJ, 144, 134 [NASA ADS] [CrossRef] [Google Scholar]
- Izzard, R. G., & Tout, C. A. 2004, MNRAS, 350, L1 [NASA ADS] [CrossRef] [Google Scholar]
- Jones, O. C., Maclay, M. T., Boyer, M. L., et al. 2018, ApJ, 854, 117 [NASA ADS] [CrossRef] [Google Scholar]
- Karakas, A. I., & Lattanzio, J. C. 2014, PASA, 31, e030 [NASA ADS] [CrossRef] [Google Scholar]
- Kirby, E. N., Rizzi, L., Held, E. V., et al. 2017, ApJ, 834, 9 [NASA ADS] [CrossRef] [Google Scholar]
- Koch, A., Grebel, E. K., Wyse, R. F. G., et al. 2006, AJ, 131, 895 [NASA ADS] [CrossRef] [Google Scholar]
- Mateo, M. L. 1998, ARA&A, 36, 435 [NASA ADS] [CrossRef] [Google Scholar]
- McQuinn, K. B. W., Boyer, M. L., Mitchell, M. B., et al. 2017, ApJ, 834, 78 [NASA ADS] [CrossRef] [Google Scholar]
- Rizzi, L., Tully, R. B., Makarov, D., et al. 2007, ApJ, 661, 815 [NASA ADS] [CrossRef] [MathSciNet] [Google Scholar]
- Ruiz-Escobedo, F., Peña, M., Hernández-Martínez, L., & García-Rojas, J. 2018, MNRAS, 481, 396 [NASA ADS] [CrossRef] [Google Scholar]
- Sanna, N., Bono, G., Stetson, P. B., et al. 2010, ApJ, 722, L244 [NASA ADS] [CrossRef] [Google Scholar]
- Schlafly, E. F., & Finkbeiner, D. P. 2011, ApJ, 737, 103 [NASA ADS] [CrossRef] [Google Scholar]
- Skillman, E. D., Hidalgo, S. L., Weisz, D. R., et al. 2014, ApJ, 786, 44 [NASA ADS] [CrossRef] [Google Scholar]
- Snigula, J. 2006, PhD Thesis, Ludwig-Maximilians-Universität München [Google Scholar]
- Stinson, G. S., Dalcanton, J. J., Quinn, T., et al. 2009, MNRAS, 395, 1455 [NASA ADS] [CrossRef] [Google Scholar]
- Stonkutė, R., Arimoto, N., Hasegawa, T., et al. 2014, ApJS, 214, 19 [NASA ADS] [CrossRef] [Google Scholar]
- Stonkutė, R., Čeponis, M., Leščinskaitė, A., Naujalis, R., & Vansevičius, V. 2018a, A&A, 614, A144 [NASA ADS] [CrossRef] [EDP Sciences] [Google Scholar]
- Stonkutė, R., Čeponis, M., Leščinskaitė, A., & Vansevičius, V. 2018b, Proc. IAU Symp., 14, 139 [Google Scholar]
- Taibi, S., Battaglia, G., Kacharov, N., et al. 2018, A&A, 618, A122 [NASA ADS] [CrossRef] [EDP Sciences] [Google Scholar]
- Tammann, G. A., Reindl, B., & Sandage, A. 2011, A&A, 531, A134 [NASA ADS] [CrossRef] [EDP Sciences] [Google Scholar]
- Taylor, B. J. 1986, ApJS, 60, 577 [NASA ADS] [CrossRef] [Google Scholar]
- van Zee, L., Skillman, E. D., & Haynes, M. P. 2006, ApJ, 637, 269 [NASA ADS] [CrossRef] [Google Scholar]
- Vansevičius, V., Arimoto, N., Hasegawa, T., et al. 2004, ApJ, 611, L93 [NASA ADS] [CrossRef] [Google Scholar]
- Venn, K. A., Shetrone, M. D., Irwin, M. J., et al. 2012, ApJ, 751, 102 [NASA ADS] [CrossRef] [Google Scholar]
- Young, L. M., & Lo, K. Y. 1996, ApJ, 462, 203 [NASA ADS] [CrossRef] [Google Scholar]
- Zhang, H.-X., Hunter, D. A., Elmegreen, B. G., Gao, Y., & Schruba, A. 2012, AJ, 143, 47 [NASA ADS] [CrossRef] [Google Scholar]
Appendix A: Supplementary data
In this appendix, ancillary plots are provided showing results of the decontamination of the Subaru Suprime-Cam catalogue described in Sect. 2.
In Fig. A.1 CMDs, two-colour diagrams, and spatial distributions are provided for stars removed using different methods of decontamination. The panels in the first row display objects that were interactively removed from the central ellipse ( ) using HST ACS images. The panels in the second row show objects removed based on constraining sharpness and χ2 parameters, as depicted in Figs. A.2 and A.3. The panels in the bottom row show MW dwarfs of M-K spectral types, as selected from the two-colour diagram provided in panel k.
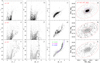 |
Fig. A.1. CMDs, two-colour diagrams, and spatial distribution from Subaru Suprime-Cam photometry (V < 24). Panels a–c: diagrams with objects within the |

Figures A.2 and A.3 show the limits set for sharpness and χ2 parameters in the inner ( ) and the outer (
 ) parts of the galaxy, respectively. The objects that fall outside these limits in at least three passbands were removed from the catalogue. In Fig. A.2 the contaminants that were removed based on a visual inspection of HST ACS images are also marked.
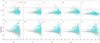 |
Fig. A.2. Photometry quality parameters of objects in the crowded field ( |


Appendix B: Data tables and catalogues
In this appendix, the tables and catalogues for AGB and peculiar RGB (pRGB) stars are provided.
Table B.1 is a catalogue of the 32 luminous AGB stars and 3 AGB candidates (cAGB) identified in this study. The first column is the ID of the star; Cols. 2 and 3 are the equatorial coordinates; Cols. 4−8 provide the Subaru Suprime-Cam magnitudes in B, V, I, R, and Hα passbands (the Johnson-Cousins system); Cols. 9−13 are the respective photometric errors; Cols. 14−17 give the J, H, K magnitudes and the dust production rate from Jones et al. (2018); the last column is a flag for dusty stars (1 for stars that are likely to have circumstellar dusty envelopes, 0 for stars with no dust).
AGB stars in the Leo A galaxy.
Table B.2 lists the results of cross-identification of the AGB, cAGB, and pRGB stars with variable stars from the literature. The first column shows the ID of the stars in this work; Cols. 2 and 3 give the ID and variability period in days from Snigula (2006); Cols. 4 and 5 give the ID and variability period from Gössl (2007); Cols. 6–8 show the IDs of variable stars from the works of Bernard et al. (2013), Boyer et al. (2015), and Jones et al. (2018), respectively.
Cross-identification of the AGB, cAGB, and pRGB stars in the Leo A galaxy with known variable stars.
Table B.3 is a catalogue of the pRGB stars. Columns 1−13 provide information equivalent to that given in Table B.1; Cols. 14 and 15 give the infrared magnitudes ([3.6] and [4.5], respectively) from Boyer et al. (2015).
pRGB stars in the Leo A galaxy.
Appendix C: Identification charts
In this appendix, identification charts are provided for the luminous AGB (Figs. C.1 and C.2), cAGB (Fig. C.3), and pRGB (Figs. C.4 and C.5) stars. Subaru Suprime-Cam images are provided for all the objects, and when available HST ACS images are also displayed.
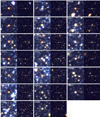 |
Fig. C.1. Identification charts for the AGB stars within the HST ACS field. Subaru Suprime-Cam images (R – red, V – green, B – blue) are displayed on the left, HST ACS on the right; all images are 12″ × 12″; north is up, east is to the left. The ID of the AGB star is indicated in the top left corner of each image. |
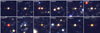 |
Fig. C.2. Identification charts for the AGB stars outside the HST ACS field. The displayed Subaru Suprime-Cam images are of the same size and orientation as in Fig. C.1. |
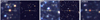 |
Fig. C.3. Identification charts for the cAGB stars. Subaru Suprime-Cam and HST ACS images (same as Fig. C.1) are shown for cAGB01 and cAGB02 stars; the Subaru Suprime-Cam image is shown for cAGB03, which is located outside the HST ACS field. |
All Tables
Cross-identification of the AGB, cAGB, and pRGB stars in the Leo A galaxy with known variable stars.
All Figures
|
Fig. 1. Diagrams of decontaminated Subaru Suprime-Cam photometry data. Panel a: I vs. V − I diagram. Red symbols are AGB stars (selection limits for the luminous AGB stars are indicated by black lines): dots – AGB stars; asterisks – AGB stars with circumstellar dusty envelopes (see Sect. 3.1.2); open circles – cAGB stars. Green dots are peculiar RGB stars (see Sect. 3.2.2). Grey dots are the remaining objects in the decontaminated catalogue. Symbols and colours correspond to the same objects in all panels. PARSEC release v1.2S isochrones (Bressan et al. 2012) of 1.1 Gyr (cyan) and 2.5 Gyr (magenta) ages and of Z = 0.0007 metallicity are overlaid in panels a and b. The isochrones are shifted in magnitude and colour, adopting a true distance modulus of 24.58 (see Sect. 3.2.1), using foreground MW extinction derived from Schlafly & Finkbeiner (2011) data, and assuming the Fitzpatrick (1999) reddening law RV = 3.1 (AB = 0.075, AV = 0.057, AI = 0.031). Panel b: V vs. B − V diagram. Panel c: spatial distribution of objects within the a = 10′ ellipse centred on the Leo A galaxy. Ellipticity of the depicted ellipse is b/a = 0.6 and the position angle of the major axis is PA = 114°. A black square shows the area ( |
| In the text | |
|
Fig. 2. RGB star selection. Decontaminated CMDs (in the present work) from Subaru Suprime-Cam photometry with spectroscopically confirmed members of Leo A (Kirby et al. 2017) are overlaid as cyan crosses. Panel a: I vs. V − I diagram with the selection box for RGB stars outlined in red. All RGB stars falling within an ellipse of a = 8′ are shown as black dots (N = 726). Panel b: I vs. QBVI diagram used to decontaminate the RGB sample of objects with unusual spectra. All the outliers (magenta dots; N = 63) lying outside of the two inclined lines were removed from the sample. Panel c: I vs. Hα − R diagram showing additionally removed objects with |Hα − R| > 0.05 (magenta dots; N = 15). Panel d: CMD of the decontaminated sample of RGB stars (black dots; N = 648) and removed from the RGB sample stars (magenta dots; N = 78). |
| In the text | |
|
Fig. 3. CMDs of pRGB stars. The green symbols are pRGB stars: open circles – stars with metallicity significantly higher than average (Kirby et al. 2017); asterisks – stars with enhanced CN band absorption (Kirby et al. 2017); dots – stars without spectroscopic measurements. Panels a and b: decontaminated CMDs from Subaru Suprime-Cam photometry (Stonkutė et al. 2014). Panel c: CMD from HST ACS photometry (Stonkutė et al. 2018b). |
| In the text | |
|
Fig. 4. Panel a: I vs. V − I CMD of decontaminated RGB stars (black dots). Selected zones for the bRGB and rRGB stars are outlined in blue and red, respectively. Panel b: RGB stars with available spectroscopic measurements (Kirby et al. 2017) colour-coded by their [Fe/H] values. Selected zones (same as in panel a) for bRGB and rRGB stars are outlined with black lines. |
| In the text | |
|
Fig. 5. Metallicity distributions for bRGB (blue) and rRGB (red) stars from the spectroscopic sample of Kirby et al. (2017). |
| In the text | |
|
Fig. 6. Spatial distribution of bRGB (panels a and b) and rRGB (panels c and d) stars. Colour-coding by [Fe/H] values in panels b and d is the same as in Fig. 4b. Parameters of the depicted ellipses are as follows: semi-major axis, a (indicated in panel a); ellipticity, b/a = 0.6; position angle of the major axis, PA = 114°. |
| In the text | |
|
Fig. 7. Panel a: surface number density profiles of RGB stars (bRGB – blue diamonds, rRGB – dark red squares), AGB stars (red circles), and pRGB stars (green asterisks) measured in elliptical annuli. Linear fits are shown for different segments of the profiles, and corresponding SL values are indicated in the legend (subscript numbers indicate the segments going from left to right). Vertical dashed lines indicate a limit for a crowded central part of the galaxy ( |
| In the text | |
|
Fig. 8. Panel a: ratio of luminous AGB to RGB stars in elliptical annuli. Panel b: number of luminous AGB stars in elliptical annuli. |
| In the text | |
|
Fig. A.1. CMDs, two-colour diagrams, and spatial distribution from Subaru Suprime-Cam photometry (V < 24). Panels a–c: diagrams with objects within the |
| In the text | |
|
Fig. A.2. Photometry quality parameters of objects in the crowded field ( |
| In the text | |
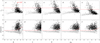 |
Fig. A.3. Same as in Fig. A.2, but for the outer less crowded field ( |
| In the text | |
|
Fig. C.1. Identification charts for the AGB stars within the HST ACS field. Subaru Suprime-Cam images (R – red, V – green, B – blue) are displayed on the left, HST ACS on the right; all images are 12″ × 12″; north is up, east is to the left. The ID of the AGB star is indicated in the top left corner of each image. |
| In the text | |
|
Fig. C.2. Identification charts for the AGB stars outside the HST ACS field. The displayed Subaru Suprime-Cam images are of the same size and orientation as in Fig. C.1. |
| In the text | |
|
Fig. C.3. Identification charts for the cAGB stars. Subaru Suprime-Cam and HST ACS images (same as Fig. C.1) are shown for cAGB01 and cAGB02 stars; the Subaru Suprime-Cam image is shown for cAGB03, which is located outside the HST ACS field. |
| In the text | |
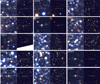 |
Fig. C.4. Identification charts for the pRGB stars within the HST ACS field (same as Fig. C.1). |
| In the text | |
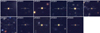 |
Fig. C.5. Identification charts for the pRGB stars outside the HST ACS field (same as Fig. C.2). |
| In the text | |
Current usage metrics show cumulative count of Article Views (full-text article views including HTML views, PDF and ePub downloads, according to the available data) and Abstracts Views on Vision4Press platform.
Data correspond to usage on the plateform after 2015. The current usage metrics is available 48-96 hours after online publication and is updated daily on week days.
Initial download of the metrics may take a while.