| Issue |
A&A
Volume 697, May 2025
|
|
|---|---|---|
| Article Number | L6 | |
| Number of page(s) | 4 | |
| Section | Letters to the Editor | |
| DOI | https://doi.org/10.1051/0004-6361/202554442 | |
| Published online | 14 May 2025 | |
Letter to the Editor
Accuracy of the ‘tip of the red giant branch’ distance determination method
Test bed – the M 33 galaxy
Center for Physical Sciences and Technology, Saulėtekio Av. 3, 10257 Vilnius, Lithuania
⋆ Corresponding author: This email address is being protected from spambots. You need JavaScript enabled to view it.
Received:
10
March
2025
Accepted:
17
April
2025
Abstract
Context. To solve the so-called Hubble tension problem, highly accurate methods of determining extragalactic distances are needed. Therefore, the accuracy and applicability of the tip of the red giant branch (TRGB) method is of the utmost importance.
Aims. In this work, we aim to study variations in the TRGB versus radial distance and location in the M 33 galaxy disc.
Methods. We used colour-magnitude diagrams of stars from the M 33 Subaru Suprime-Cam stellar photometry catalogue (V and I-passbands of the Johnson-Cousins system) to test the accuracy and robustness of the TRGB method in determining extragalactic distances.
Results. We derived radial (metallicity) and azimuthal (galaxy inclination) variations in the TRGB magnitude (ITRGB). We find the ITRGB = 20.638 ± 0.008 magnitude to be virtually constant over the radial distance from 7 to 11 kpc. Assuming the absolute TRGB magnitude, MITRGB = −4.05, and foreground extinction, AI = 0.062, we derived the true distance modulus of the M 33 galaxy to be (ITRGB − MITRGB)0 = 24.626 ± 0.008stat (∼842 kpc).
Conclusions. We demonstrate the ability of the TRGB method to discern the distance difference between the proximal and distal parts of the galaxy disc, which is ∼1.3% of the distance to M 33. We show that the TRGB method is highly accurate and can be reliably applied to the red giant branch star populations of a low metallicity ([Fe/H] ≲ −1.3). With a slightly lower accuracy, it can also be applied in cases of higher metallicity, which is more common for numerous low-mass spiral galaxies.
Key words: galaxies: individual: M 33 / galaxies: spiral / galaxies: stellar content
© The Authors 2025
 Open Access article, published by EDP Sciences, under the terms of the Creative Commons Attribution License (https://creativecommons.org/licenses/by/4.0), which permits unrestricted use, distribution, and reproduction in any medium, provided the original work is properly cited.
This article is published in open access under the Subscribe to Open model. This email address is being protected from spambots. You need JavaScript enabled to view it. to support open access publication.
1. Introduction
The late-type (Scd) dwarf spiral galaxy M 33 (NGC 598), residing in the Local Group, is well resolvable by ground-based observations and serves as a good nearby target for various galaxy studies (Hodge 2012). Recently, however, the M 33 galaxy has also become a helpful indirect reference point for the so-called Hubble tension problem and for extragalactic distance calibrations (Lee et al. 2022; Breuval et al. 2023).
The distance to M 33 has been determined many times (137, according to NED1) and the results span a wide range of distance moduli (from 24.10 to 25.06). However, even the most accurate distance estimates to M 33, determined using the Cepheid (Breuval et al. 2023) and the tip of the red giant branch (TRGB) (Lee et al. 2022) methods, differ noticeably. Therefore, we decided to test the TRGB method by applying it to different regions of the same galaxy.
In this Letter, we study red giant branch (RGB) stars, which represent old (∼2 − 13 Gyr) stellar populations and are excellent tracers of both the morphology and chemical evolution of galaxies (Ferguson et al. 2007; Leščinskaitė et al. 2021). We use the results from the Subaru stellar photometry survey of M 33 (Stonkutė & Vansevičius 2024), which enables us to study the potential of the TRGB method in detail.
Ferguson et al. (2007) claimed that M 33 has an unperturbed stellar disc without any notable signs of a thick disc or a halo. The undistorted thin disc of M 33 offers advantages for investigating the accuracy of the TRGB method from the galactic centre to the disc edges, due to the small dispersion of RGB star distances with respect to the disc plane. The warp of the M 33 gaseous disc, previously identified from H I observations (Corbelli et al. 1989), becomes significant only beyond the radial distances examined in the present study. Therefore, the M 33 galaxy is a perfect test bed, considering its virtually unperturbed disc, favourable orientation, distance, size, and significant gradient of metallicity (Cioni 2009), for testing the TRGB distance determination method at accuracy levels better than 1%. The basic parameters of the M 33 galaxy adopted in this study are provided in Table 1.
The paper is organized as follows. In Section 2, we describe the TRGB method applied. Results are discussed in Section 3. Conclusions are presented in Section 4.
2. Data and the TRGB method
The Suprime-Cam (Miyazaki et al. 2002) catalogue of 803 095 star-like objects (15 < V < 25) in a field (62′×95′) centred on M 33 was taken from Stonkutė & Vansevičius (2024). The achievable photometric quality with the Suprime-Cam can also be learned from the studies of M 31 (Narbutis et al. 2008) and Leo A (Stonkutė et al. 2014). For the present study, we used stellar photometry data in the V and I-passbands in the magnitude range of 18 < I < 23. A sample of stars located in the range of radial distances from 6 kpc to 10 kpc is shown in Fig. 1. For the TRGB analysis, we used stars displayed in Fig. 2 that fall within the colour-magnitude diagram (CMD) region (a parallelogram) marked in Fig. 1 with red lines.
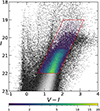 |
Fig. 1. CMD of the M 33 stars residing in the range of radial distances from 6 to 10 kpc (number of stars – 162 087). The region from which stars were selected for the TRGB analysis is outlined with red lines and the number density of stars is colour-coded. The colour bar indicates number of stars in a box of 0.01 × 0.01 mag. |
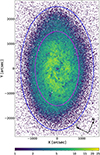 |
Fig. 2. Number density distribution of the M 33 stars taken from the CMD region (parallelogram) marked in Fig. 1. In total, 201 920 star-like objects are shown. Magenta and blue ellipses mark radial distances along the major axis of 6 and 10 kpc, respectively. North and east directions are indicated by arrows. The colour bar indicates the number of stars in a box of 15″ × 15″. |
The CMD of stars in Fig. 1 clearly shows prominent main-sequence, blue- and red-loop stars, as well as numerous RGB and AGB stars. This suggests that the M 33 survey data selected for this Letter are well suited for detailed stellar population analyses similar to the ones performed in the Leo A galaxy by Leščinskaitė et al. (2021, 2022), which are based on the Suprime-Cam stellar photometry from the same set of observations. The narrow RGB, comparable in width to the ones of dwarf irregular galaxies, resulting from the combined effects of various stellar populations differing in age, metallicity, and extinction, implies that virtually the entire M 33 disc (except for the very central regions due to crowding) is well suited for precise studies of radial and azimuthal TRGB variations. We note, however, that crowding effects (estimated based on artificial star tests) on the determined TRGB magnitude are small, ≲0.003 mag, even in the inner parts of the M 33 disc.
Various methods are used to determine the TRGB (Madore et al. 2023). The most popular one is probably the Sobel filter method, applied to detect the maximum gradient of the RGB star number change versus the I-passband magnitude. We employed a modified version of this method (Fig. 3). We constructed histograms of I-passband magnitudes of stars from the CMD region marked in Fig. 1 with various histogram bin sizes, from 0.01 to 0.05 mag (Fig. 3a). Then, gradients of the histograms were calculated (Fig. 3b):  , where Ni is the number of stars in a bin, i. The multiple Gaussian peak fit was applied to the gradient data plotted against the I-passband magnitude (Fig. 3b) and the fitted parameters of the most prominent peak were assigned as the TRGB magnitude and its uncertainty. We selected the final histogram bin size based on the peak’s highest contrast and the narrowest width; however, we note that by varying the bin size the TRGB magnitude changes less than 0.01 mag. This method is more robust than the Sobel filter method in the cases in which a small number of stars are available for fitting. This is important for studies of the radial TRGB variations in narrow rings, especially in the outer parts of the M 33 galaxy disc. It is worth mentioning that the TRGB determination results obtained in the present Letter (and discussed in the next section) are in good agreement with the ones derived using the Sobel filter method by Stonkutė & Vansevičius (2024).
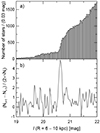 |
Fig. 3. Panel a: Histogram of I-passband magnitudes of the stars from the CMD region marked in Fig. 1, residing in the range of radial distances from 6 to 10 kpc. Panel b: Gradients calculated from the histogram, |

The colour index of the TRGB, (V − I)TRGB, was determined as the fitted maximum (fifth-order polynomial) of the V − I histogram of stars residing in the marked CMD region (Fig. 1) from the TRGB magnitude to 0.5 mag below it. The TRGB colour index uncertainty was estimated using the 16th and 84th percentiles of the V − I distribution.
3. Results and discussion
A large number of RGB stars and the high quality of the photometry data (Fig. 1) enabled us to study the radial and azimuthal TRGB variations in detail. The ITRGB magnitude was determined in 2 kpc wide rings from 3 kpc to 11 kpc (Fig. 4). The numbers of stars used for TRGB determination (from the region marked in Fig. 1 in the magnitude range, 20 < I < 21) within the outer five rings from 7 kpc to 11 kpc are: 9340, 5953, 3165, 1536, and 929. The very central part (R ≲ 2 kpc) of the galaxy is too crowded in the case of ground-based observations (the lower completeness of the photometry is noticeable in Fig. 2); therefore, it was omitted from the analysis.
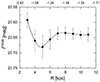 |
Fig. 4. Magnitude of TRGB, ITRGB, versus radial distance. Corresponding [Fe/H] values (see Table 1) are indicated above the top axis. |
Virtually constant ITRGB values (within a 0.007 mag range) are derived at the radial distances from 7 to 11 kpc (Fig. 4). The metallicity of the RGB stars, estimated based on the AGB star measurements by Cioni (2009), in this radial distance range is rather low, −1.6 ≲ [Fe/H] ≲ −1.3. Variations in ITRGB at smaller radial distances (R ≲ 6 kpc) slightly increase, most likely due to differential extinction effects, the younger mean age of the RGB stars, and crowding effects (Fig. 5).
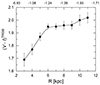 |
Fig. 5. Colour index of TRGB, (V − I)TRGB, versus radial distance. Corresponding [Fe/H] values (see Table 1) are indicated above the top axis. |
We calculated the weighted (wi = 1/σi2; here, σi is a parameter of the Gaussian fit to the most prominent peak of the gradient histogram constructed for the i-th radial ring, see Fig. 3) mean magnitude of ITRGB = 20.638 ± 0.008 based on five independent estimates (marked with a red ellipse in Fig. 6) within the radial distance from 7 to 11 kpc. However, when a group was selected by applying a criterion of (V − I)TRGB > 1.9, the accuracy became slightly lower, ITRGB = 20.641 ± 0.018.
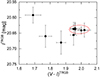 |
Fig. 6. Magnitude of TRGB, ITRGB, versus the colour index of TRGB, (V − I)TRGB. The red ellipse covers five measurements used to calculate the average ITRGB estimate. |
The radial dependence of the TRGB colour index, (V − I)TRGB, is rather flat outwards starting from ∼6 kpc (Fig. 5). This ensures that RGB stellar populations are homogeneous in the M 33 disc and are suitable for highly accurate distance determination. This circumstance could probably help to reconcile the dichotomy between distance estimates to M 33 based on the Cepheid and TRGB methods (Breuval et al. 2023; Lee et al. 2022).
Moreover, the tight correlation between ITRGB and (V − I)TRGB (Fig. 6) strengthens the conclusion that the TRGB distance determination method can be successfully applied to stellar populations in numerous M 33-type galaxies, available for study in the local Universe. The cumulative use of ITRGB and (V − I)TRGB for selection of the RGB star populations would make the TRGB method more robust when applied in complicated environments of late-type galaxy discs.
The azimuthal dependence of the TRGB was determined in four 45° segments along and perpendicular to the major axis. We used RGB stars residing at radial distances from 6 to 9 kpc to secure an unperturbed disc part (Corbelli et al. 1989; Ferguson et al. 2007); therefore, an approximate effective radial distance of these stars from the galaxy centre is ∼7 kpc. Consequently, these areas, being located on the opposite parts of the disc, are separated by a distance of ∼14 kpc, which translates to a projected distance difference of ∼11 kpc (this makes ∼1.3% of the distance to M 33) due to the inclination of the galaxy disc (Table 1).
The TRGB magnitudes (ITRGB) derived in the segments along the major axis are: 20.641 ± 0.022 (north) and 20.635 ± 0.020 (south). Therefore, there is no significant difference when taking error estimates into account. ITRGB derived in the segments perpendicular to the major axis are: 20.647 ± 0.021 (east) and 20.615 ± 0.021 (west). The TRGB magnitude difference of 0.032 mag (∼1.5σ) could be noticed, which translates to a distance difference of ∼13 kpc. This result is in good agreement with the projected distance difference caused by the inclination of the galaxy disc. Therefore, it also indicates the high potential of the TRGB method and suggests that M 33 is a suitable test bed for the calibration of various distance determination methods.
The most accurate true distance moduli of M 33, which were recently determined based on the I-passband TRGB, 24.72 ± 0.02stat ± 0.07syst (Lee et al. 2022), and the Cepheid, 24.622 ± 0.030 (Breuval et al. 2023) methods, differ noticeably. The origin of the difference in the M 33 distances determined using these methods is discussed in detail by Madore & Freedman (2024).
To test our TRGB determination results, we calculated the M 33 true distance modulus taking into account prescriptions given by Rizzi et al. (2007), Madore et al. (2023). We assumed the absolute TRGB magnitude of MITRGB = −4.05 (Lee et al. 2022), which fits well with the M 33 metallicity (Magrini et al. 2007; Cioni 2009). Finally, by employing our determination of ITRGB = 20.638 ± 0.008 and correcting it for the foreground interstellar extinction (AI = 0.062, see Table 1), we derived the M 33 true distance modulus of (ITRGB − MITRGB)0 = 24.626 ± 0.008stat (∼842 kpc).
Estimating the systematic error budget is rather tricky (for the MITRGB error evaluation, see Bellazzini et al. 2004; Lee et al. 2022). Additionally, the extinction and metallicity effects (Rizzi et al. 2007; Madore et al. 2023), as well as contamination of the RGB star sample, used for the TRGB magnitude determination, with various types of stars including variables, could also be responsible for some systematic effects (Anderson et al. 2024). However, a more detailed discussion of these issues, despite their larger contribution (in comparison with TRGB statistical errors) to the overall distance error budget, is beyond the scope of this Letter.
4. Conclusions
We have used published Subaru Suprime-Cam stellar photometry data (Stonkutė & Vansevičius 2024) to study limitations of the TRGB distance determination method using the M 33 disc as a test bed. We have demonstrated the accuracy of the TRGB method by analysing radial and azimuthal variations in the ITRGB magnitude and the (V − I)TRGB colour index.
We have found the weighted mean magnitude to be virtually constant, ITRGB = 20.638 ± 0.008stat, over the radial distances from 7 to 11 kpc, which corresponds to star metallicities of [Fe/H] ∼ −1.3 and ∼−1.6, respectively (Cioni 2009). By assuming the TRGB absolute magnitude of MITRGB = −4.05, we derived the true distance modulus of (ITRGB − MITRGB)0 = 24.626 ± 0.008stat, which is in good agreement with our previous result (Stonkutė & Vansevičius 2024), despite the different approach employed in the TRGB magnitude determination.
Additionally, we have demonstrated the ability of the TRGB method to discern the distance difference to the proximal and distal parts of the galaxy disc, which is only ∼1.3% of the distance to the M 33 galaxy. This suggests that the TRGB method has the potential to achieve accuracies better than 1% in determining extragalactic distances.
Acknowledgments
I am grateful to the anonymous referee for the constructive report that has contributed to improving this work. I am thankful to Dr. Rima Stonkutė for her invaluable help in organizing the data and figures. The research has made use of the NASA/IPAC Extragalactic Database (NED), which is operated by the Jet Propulsion Laboratory, California Institute of Technology, under contract with the National Aeronautics and Space Administration. This project has received financial support from the Research Council of Lithuania (LMTLT), agreement No S-MIP-24-98. Computations were performed on the supercomputer GALAX of the Center for Physical Sciences and Technology, Lithuania.
References
- Anderson, R. I., Koblischke, N. W., & Eyer, L. 2024, ApJ, 963, L43 [NASA ADS] [CrossRef] [Google Scholar]
- Bellazzini, M., Ferraro, F. R., Sollima, A., et al. 2004, A&A, 424, 199 [NASA ADS] [CrossRef] [EDP Sciences] [Google Scholar]
- Breuval, L., Riess, A. G., Macri, L. M., et al. 2023, ApJ, 951, 118 [CrossRef] [Google Scholar]
- Cioni, M.-R. L. 2009, A&A, 506, 1137 [NASA ADS] [CrossRef] [EDP Sciences] [Google Scholar]
- Corbelli, E., Schneider, S. E., & Salpeter, E. E. 1989, AJ, 97, 390 [NASA ADS] [CrossRef] [Google Scholar]
- de Vaucouleurs, G., de Vaucouleurs, A., Corwin, H. G., et al. 1991, Third Reference Catalogue of Bright Galaxies (New York: Springer) [Google Scholar]
- Ferguson, A., Irwin, M., Chapman, S., et al. 2007, Astrophysics and Space Science Proceedings (Springer), 239 [Google Scholar]
- Hodge, P. 2012, The Spiral Galaxy M33 (Springer), 158 [Google Scholar]
- Lee, A. J., Rousseau-Nepton, L., Freedman, W. L., et al. 2022, ApJ, 933, 201 [NASA ADS] [CrossRef] [Google Scholar]
- Leščinskaitė, A., Stonkutė, R., & Vansevičius, V. 2021, A&A, 647, A170 [CrossRef] [EDP Sciences] [Google Scholar]
- Leščinskaitė, A., Stonkutė, R., & Vansevičius, V. 2022, A&A, 660, A79 [NASA ADS] [CrossRef] [EDP Sciences] [Google Scholar]
- Madore, B. F., & Freedman, W. L. 2024, ApJ, 961, 166 [Google Scholar]
- Madore, B. F., Freedman, W. L., Owens, K. A., & Jang, I. S. 2023, AJ, 166, 2 [NASA ADS] [CrossRef] [Google Scholar]
- Magrini, L., Vílchez, J. M., Mampaso, A., et al. 2007, A&A, 470, 865 [NASA ADS] [CrossRef] [EDP Sciences] [Google Scholar]
- Miyazaki, S., Komiyama, Y., Sekiguchi, M., et al. 2002, PASJ, 54, 833 [Google Scholar]
- Narbutis, D., Vansevičius, V., Kodaira, K., et al. 2008, ApJS, 177, 174 [NASA ADS] [CrossRef] [Google Scholar]
- Rizzi, L., Tully, R. B., Makarov, D., et al. 2007, ApJ, 661, 815 [Google Scholar]
- Schlafly, E. F., & Finkbeiner, D. P. 2011, ApJ, 737, 103 [Google Scholar]
- Stonkutė, R., & Vansevičius, V. 2024, ApJS, 273, 22 [Google Scholar]
- Stonkutė, R., Arimoto, N., Hasegawa, T., et al. 2014, ApJS, 214, 19 [Google Scholar]
All Tables
All Figures
|
Fig. 1. CMD of the M 33 stars residing in the range of radial distances from 6 to 10 kpc (number of stars – 162 087). The region from which stars were selected for the TRGB analysis is outlined with red lines and the number density of stars is colour-coded. The colour bar indicates number of stars in a box of 0.01 × 0.01 mag. |
| In the text | |
|
Fig. 2. Number density distribution of the M 33 stars taken from the CMD region (parallelogram) marked in Fig. 1. In total, 201 920 star-like objects are shown. Magenta and blue ellipses mark radial distances along the major axis of 6 and 10 kpc, respectively. North and east directions are indicated by arrows. The colour bar indicates the number of stars in a box of 15″ × 15″. |
| In the text | |
|
Fig. 3. Panel a: Histogram of I-passband magnitudes of the stars from the CMD region marked in Fig. 1, residing in the range of radial distances from 6 to 10 kpc. Panel b: Gradients calculated from the histogram, |
| In the text | |
|
Fig. 4. Magnitude of TRGB, ITRGB, versus radial distance. Corresponding [Fe/H] values (see Table 1) are indicated above the top axis. |
| In the text | |
|
Fig. 5. Colour index of TRGB, (V − I)TRGB, versus radial distance. Corresponding [Fe/H] values (see Table 1) are indicated above the top axis. |
| In the text | |
|
Fig. 6. Magnitude of TRGB, ITRGB, versus the colour index of TRGB, (V − I)TRGB. The red ellipse covers five measurements used to calculate the average ITRGB estimate. |
| In the text | |
Current usage metrics show cumulative count of Article Views (full-text article views including HTML views, PDF and ePub downloads, according to the available data) and Abstracts Views on Vision4Press platform.
Data correspond to usage on the plateform after 2015. The current usage metrics is available 48-96 hours after online publication and is updated daily on week days.
Initial download of the metrics may take a while.