Fig. A.1.
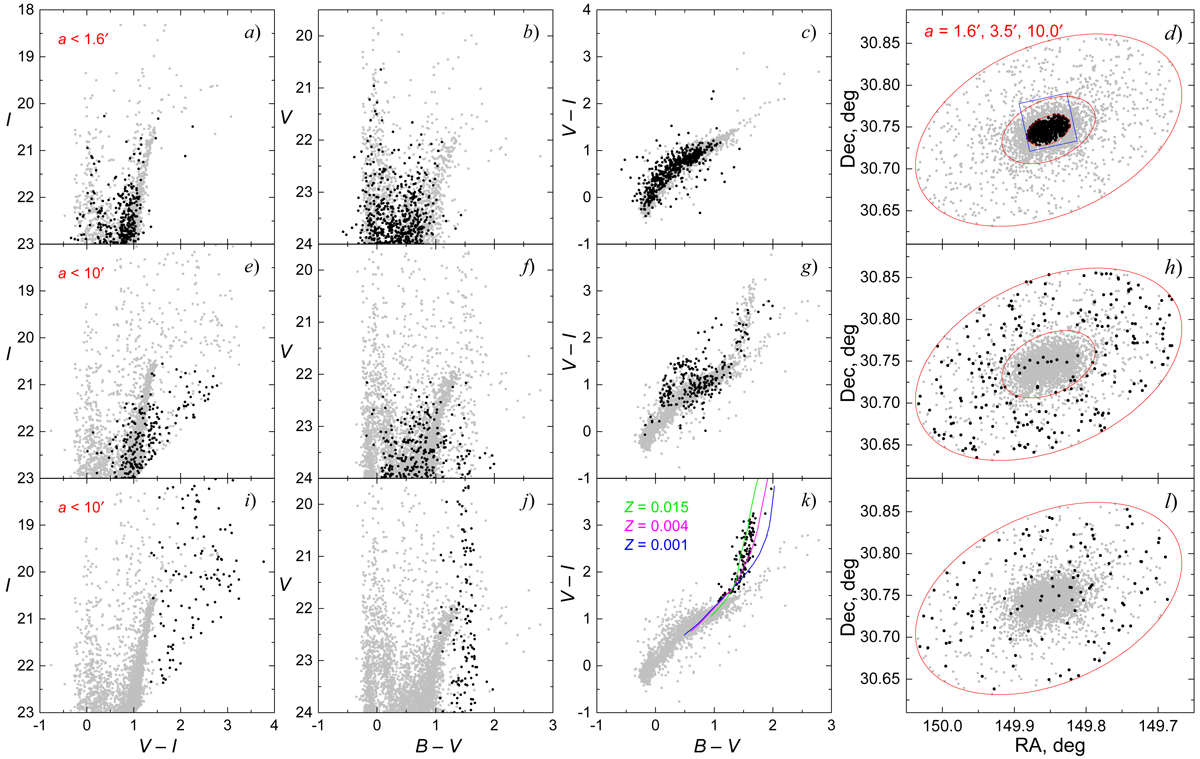
CMDs, two-colour diagrams, and spatial distribution from Subaru Suprime-Cam photometry (V < 24). Panels a–c: diagrams with objects within the ![]() ellipse (innermost ellipse centred on Leo A shown in panel d is limited by the extent of the HST ACS field outlined with blue lines). Interactively removed objects (based on visual HST ACS image analysis) are shown as black dots. Panel d: object distribution in the initial catalogue. Parameters of the depicted ellipses are as follows: semi-major axis, a (indicated in the top left corner); ellipticity, b/a = 0.6; position angle of the major axis, PA = 114°. Panels e–h: diagrams with objects excluded from further analysis by applying restrictions of sharpness and χ2 (see Sect. 2 and Figs. A.2 and A.3) shown as black dots. Panels i–l: diagrams with MW dwarfs of K-M spectral types shown as black dots. The isochrones (Bressan et al. 2012) for main-sequence stars of masses 0.09−0.80 M⊙ and of Z = 0.015, 0.004, 0.001 metallicity (green, magenta, and blue, respectively) are depicted in panel k.
ellipse (innermost ellipse centred on Leo A shown in panel d is limited by the extent of the HST ACS field outlined with blue lines). Interactively removed objects (based on visual HST ACS image analysis) are shown as black dots. Panel d: object distribution in the initial catalogue. Parameters of the depicted ellipses are as follows: semi-major axis, a (indicated in the top left corner); ellipticity, b/a = 0.6; position angle of the major axis, PA = 114°. Panels e–h: diagrams with objects excluded from further analysis by applying restrictions of sharpness and χ2 (see Sect. 2 and Figs. A.2 and A.3) shown as black dots. Panels i–l: diagrams with MW dwarfs of K-M spectral types shown as black dots. The isochrones (Bressan et al. 2012) for main-sequence stars of masses 0.09−0.80 M⊙ and of Z = 0.015, 0.004, 0.001 metallicity (green, magenta, and blue, respectively) are depicted in panel k.
Current usage metrics show cumulative count of Article Views (full-text article views including HTML views, PDF and ePub downloads, according to the available data) and Abstracts Views on Vision4Press platform.
Data correspond to usage on the plateform after 2015. The current usage metrics is available 48-96 hours after online publication and is updated daily on week days.
Initial download of the metrics may take a while.