Fig. 2.
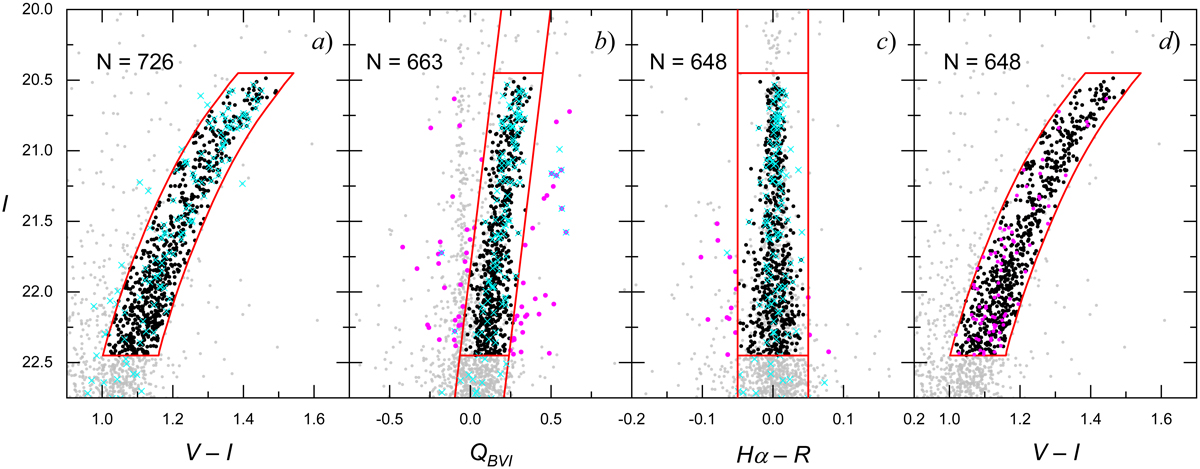
RGB star selection. Decontaminated CMDs (in the present work) from Subaru Suprime-Cam photometry with spectroscopically confirmed members of Leo A (Kirby et al. 2017) are overlaid as cyan crosses. Panel a: I vs. V − I diagram with the selection box for RGB stars outlined in red. All RGB stars falling within an ellipse of a = 8′ are shown as black dots (N = 726). Panel b: I vs. QBVI diagram used to decontaminate the RGB sample of objects with unusual spectra. All the outliers (magenta dots; N = 63) lying outside of the two inclined lines were removed from the sample. Panel c: I vs. Hα − R diagram showing additionally removed objects with |Hα − R| > 0.05 (magenta dots; N = 15). Panel d: CMD of the decontaminated sample of RGB stars (black dots; N = 648) and removed from the RGB sample stars (magenta dots; N = 78).
Current usage metrics show cumulative count of Article Views (full-text article views including HTML views, PDF and ePub downloads, according to the available data) and Abstracts Views on Vision4Press platform.
Data correspond to usage on the plateform after 2015. The current usage metrics is available 48-96 hours after online publication and is updated daily on week days.
Initial download of the metrics may take a while.