Fig. 7.
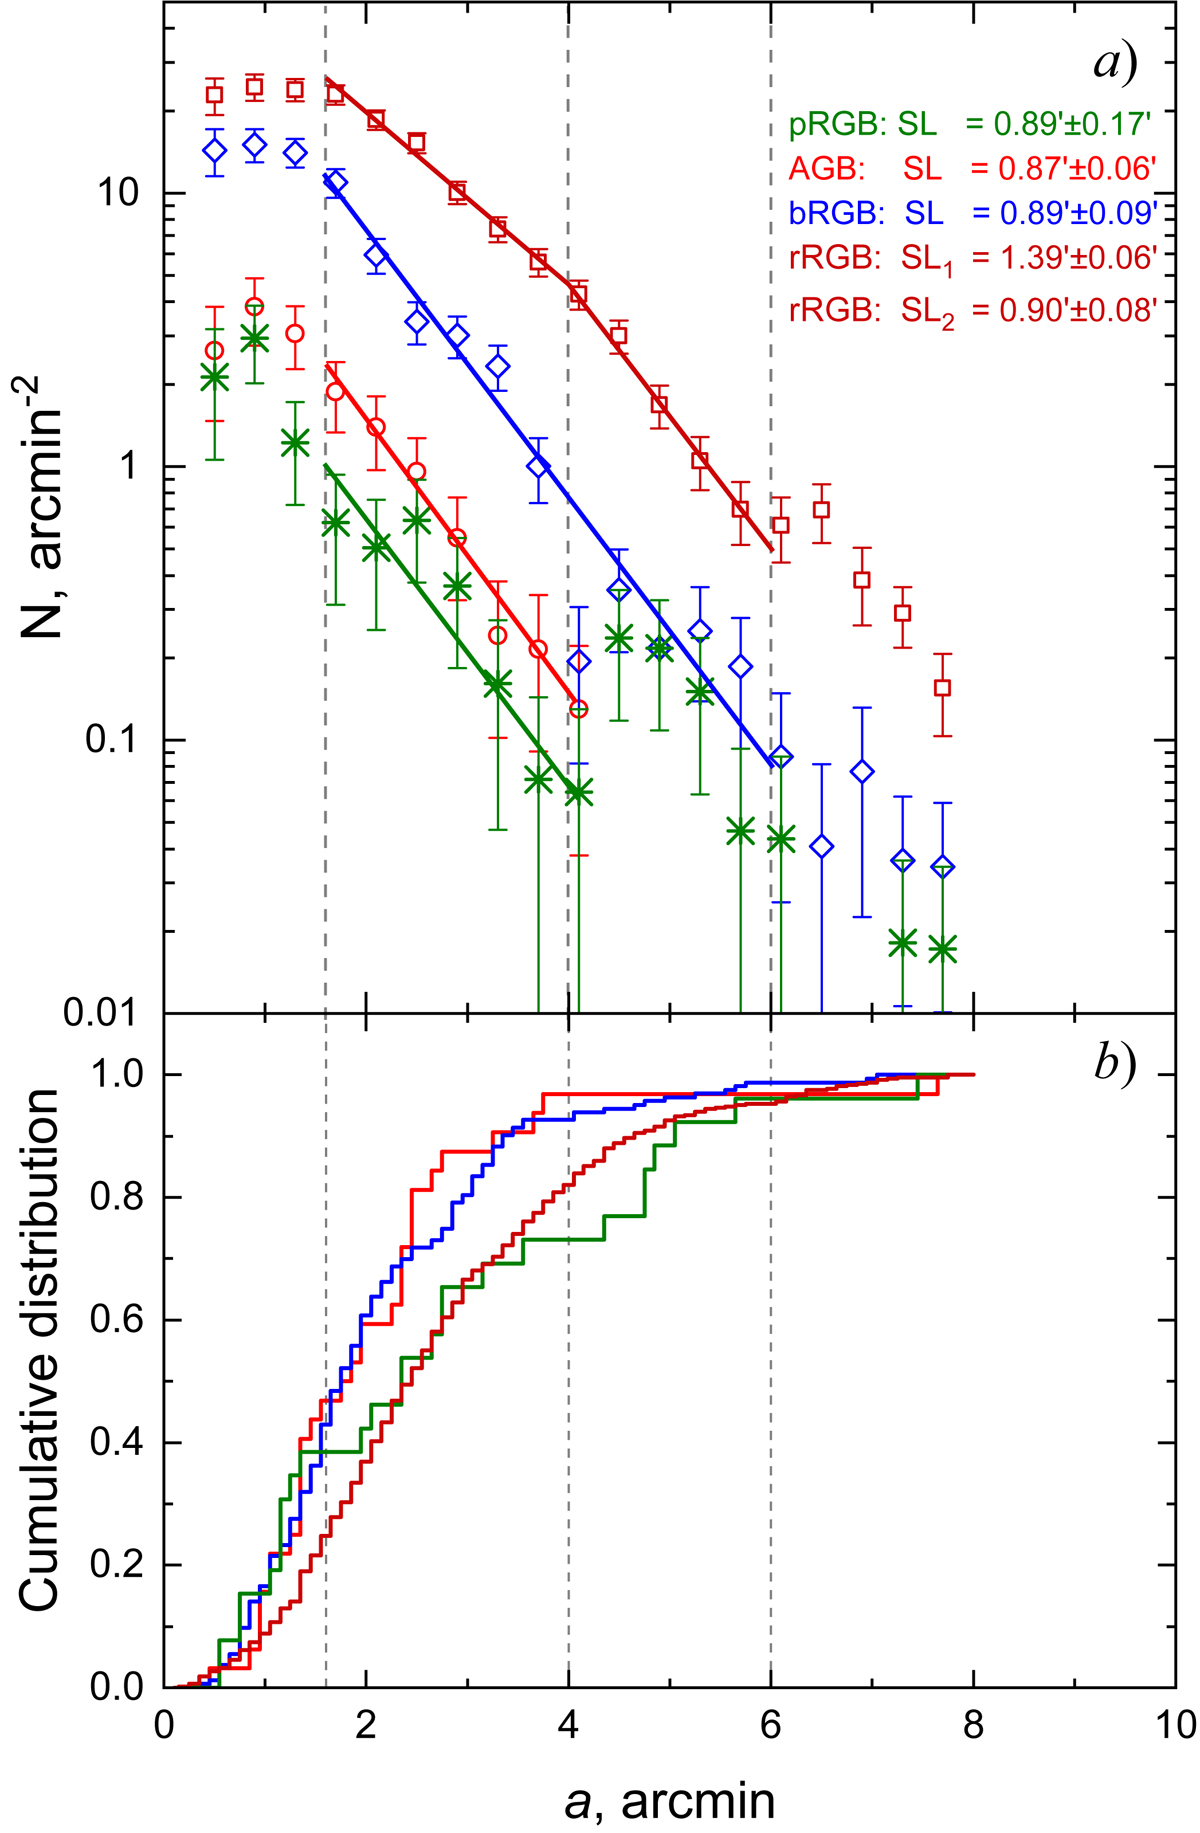
Panel a: surface number density profiles of RGB stars (bRGB – blue diamonds, rRGB – dark red squares), AGB stars (red circles), and pRGB stars (green asterisks) measured in elliptical annuli. Linear fits are shown for different segments of the profiles, and corresponding SL values are indicated in the legend (subscript numbers indicate the segments going from left to right). Vertical dashed lines indicate a limit for a crowded central part of the galaxy (![]() , completeness at I = 22.5 is ∼80%), an edge of the distribution of bright AGB stars (a ∼ 4′), and a position of a prominent break in the rRGB profile (a ∼ 6′). Panel b: normalized cumulative distributions of AGB, pRGB, bRGB, and rRGB stars (colours are the same as in panel a).
, completeness at I = 22.5 is ∼80%), an edge of the distribution of bright AGB stars (a ∼ 4′), and a position of a prominent break in the rRGB profile (a ∼ 6′). Panel b: normalized cumulative distributions of AGB, pRGB, bRGB, and rRGB stars (colours are the same as in panel a).
Current usage metrics show cumulative count of Article Views (full-text article views including HTML views, PDF and ePub downloads, according to the available data) and Abstracts Views on Vision4Press platform.
Data correspond to usage on the plateform after 2015. The current usage metrics is available 48-96 hours after online publication and is updated daily on week days.
Initial download of the metrics may take a while.