Fig. 4.
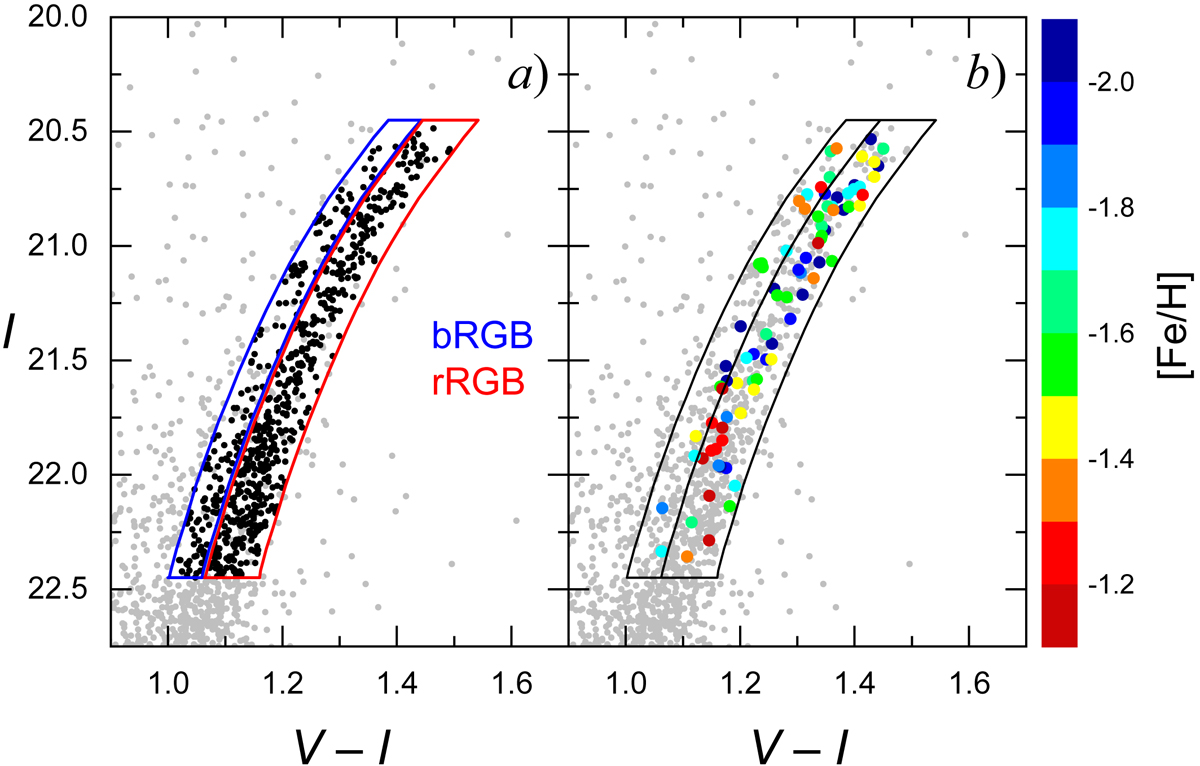
Panel a: I vs. V − I CMD of decontaminated RGB stars (black dots). Selected zones for the bRGB and rRGB stars are outlined in blue and red, respectively. Panel b: RGB stars with available spectroscopic measurements (Kirby et al. 2017) colour-coded by their [Fe/H] values. Selected zones (same as in panel a) for bRGB and rRGB stars are outlined with black lines.
Current usage metrics show cumulative count of Article Views (full-text article views including HTML views, PDF and ePub downloads, according to the available data) and Abstracts Views on Vision4Press platform.
Data correspond to usage on the plateform after 2015. The current usage metrics is available 48-96 hours after online publication and is updated daily on week days.
Initial download of the metrics may take a while.