Fig. A.2.
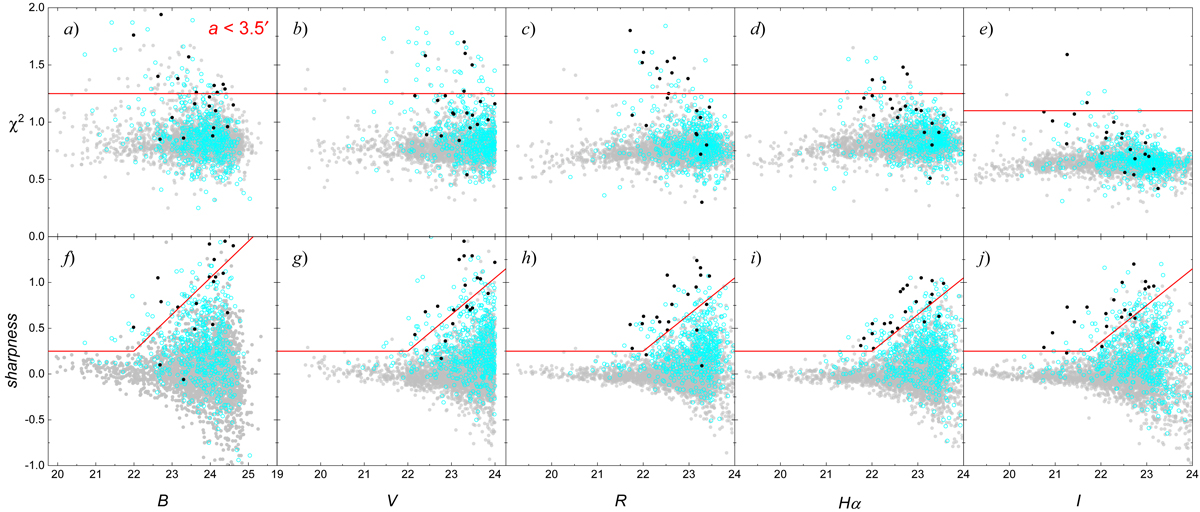
Photometry quality parameters of objects in the crowded field (![]() , see Fig. A.1h) vs. magnitudes in B, V, R, Hα, and I passbands. Panels a–e: χ2 – a goodness-of-fit parameter, indicating how well an object’s profile is fit by the PSF; panels f–j: sharpness – an object profile’s sharpness with respect to the PSF. The grey dots are stellar objects; cyan circles are contaminants (background galaxies, stellar blends;
, see Fig. A.1h) vs. magnitudes in B, V, R, Hα, and I passbands. Panels a–e: χ2 – a goodness-of-fit parameter, indicating how well an object’s profile is fit by the PSF; panels f–j: sharpness – an object profile’s sharpness with respect to the PSF. The grey dots are stellar objects; cyan circles are contaminants (background galaxies, stellar blends; ![]() ) removed from the catalogue based on a visual inspection of HST ACS images; black dots are extended objects that were excluded from further analysis based on their χ2 and sharpness. The red lines indicate limits selected for decontamination; objects that fall outside the limits in at least three passbands were excluded. The gradient of the sloping lines is the same in all passbands.
) removed from the catalogue based on a visual inspection of HST ACS images; black dots are extended objects that were excluded from further analysis based on their χ2 and sharpness. The red lines indicate limits selected for decontamination; objects that fall outside the limits in at least three passbands were excluded. The gradient of the sloping lines is the same in all passbands.
Current usage metrics show cumulative count of Article Views (full-text article views including HTML views, PDF and ePub downloads, according to the available data) and Abstracts Views on Vision4Press platform.
Data correspond to usage on the plateform after 2015. The current usage metrics is available 48-96 hours after online publication and is updated daily on week days.
Initial download of the metrics may take a while.