Fig. 1.
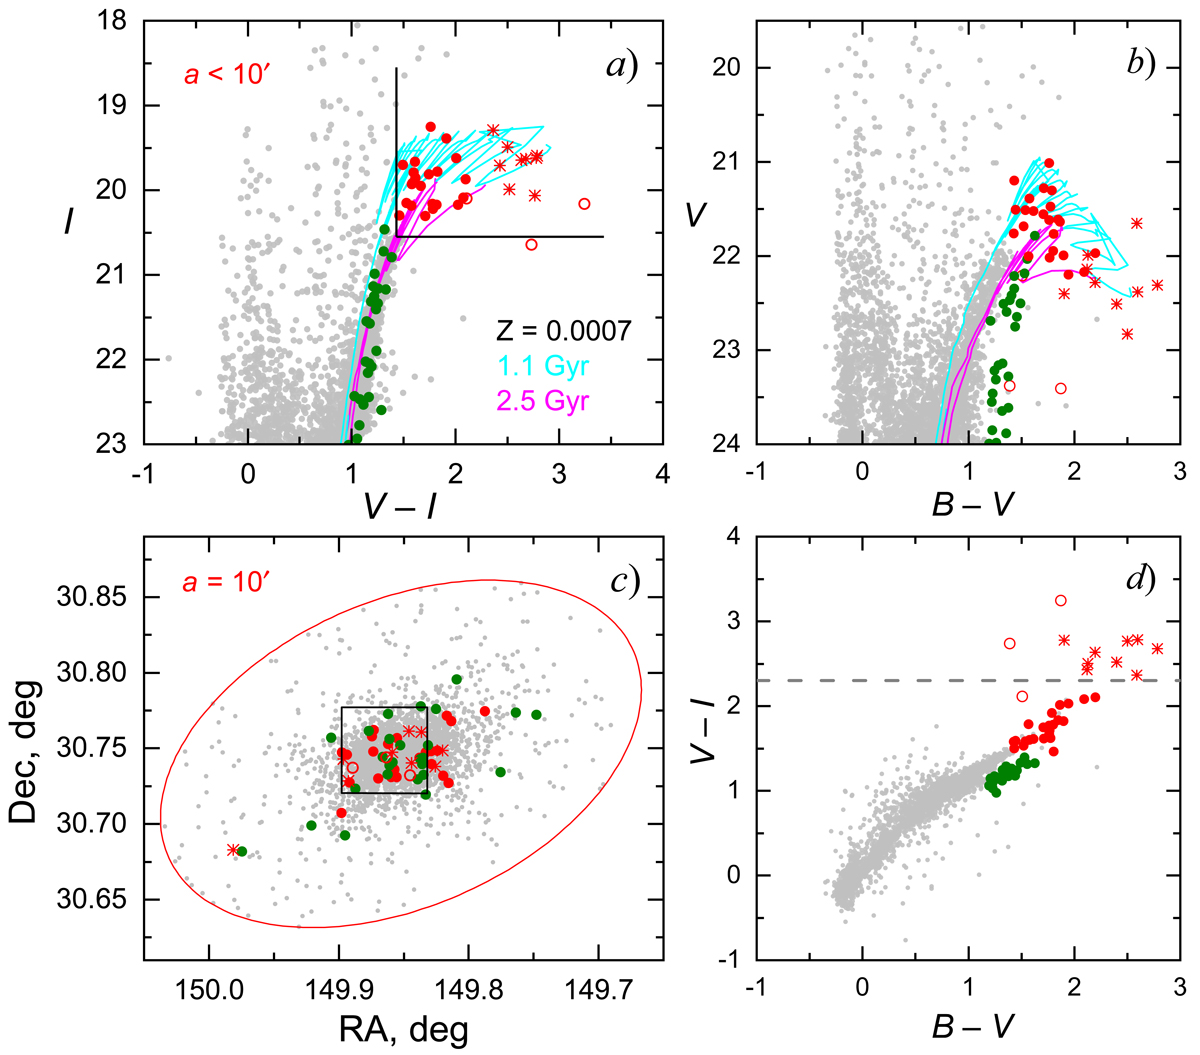
Diagrams of decontaminated Subaru Suprime-Cam photometry data. Panel a: I vs. V − I diagram. Red symbols are AGB stars (selection limits for the luminous AGB stars are indicated by black lines): dots – AGB stars; asterisks – AGB stars with circumstellar dusty envelopes (see Sect. 3.1.2); open circles – cAGB stars. Green dots are peculiar RGB stars (see Sect. 3.2.2). Grey dots are the remaining objects in the decontaminated catalogue. Symbols and colours correspond to the same objects in all panels. PARSEC release v1.2S isochrones (Bressan et al. 2012) of 1.1 Gyr (cyan) and 2.5 Gyr (magenta) ages and of Z = 0.0007 metallicity are overlaid in panels a and b. The isochrones are shifted in magnitude and colour, adopting a true distance modulus of 24.58 (see Sect. 3.2.1), using foreground MW extinction derived from Schlafly & Finkbeiner (2011) data, and assuming the Fitzpatrick (1999) reddening law RV = 3.1 (AB = 0.075, AV = 0.057, AI = 0.031). Panel b: V vs. B − V diagram. Panel c: spatial distribution of objects within the a = 10′ ellipse centred on the Leo A galaxy. Ellipticity of the depicted ellipse is b/a = 0.6 and the position angle of the major axis is PA = 114°. A black square shows the area (![]() ) of NIR observations by Jones et al. (2018) (see Sect. 3.1.2). Panel d: two-colour diagram, V − I vs. B − V. A horizontal dashed line gives the lower limit (V − I = 2.3) of the region occupied with luminous AGB and cAGB stars which possess circumstellar dusty envelopes (see Sect. 3.1.2).
) of NIR observations by Jones et al. (2018) (see Sect. 3.1.2). Panel d: two-colour diagram, V − I vs. B − V. A horizontal dashed line gives the lower limit (V − I = 2.3) of the region occupied with luminous AGB and cAGB stars which possess circumstellar dusty envelopes (see Sect. 3.1.2).
Current usage metrics show cumulative count of Article Views (full-text article views including HTML views, PDF and ePub downloads, according to the available data) and Abstracts Views on Vision4Press platform.
Data correspond to usage on the plateform after 2015. The current usage metrics is available 48-96 hours after online publication and is updated daily on week days.
Initial download of the metrics may take a while.