| Issue |
A&A
Volume 628, August 2019
|
|
|---|---|---|
| Article Number | L5 | |
| Number of page(s) | 17 | |
| Section | Letters to the Editor | |
| DOI | https://doi.org/10.1051/0004-6361/201935429 | |
| Published online | 06 August 2019 | |
Letter to the Editor
PG 1610+062: a runaway B star challenging classical ejection mechanisms
1
Dr. Karl Remeis-Observatory & ECAP, Astronomical Institute, Friedrich-Alexander University Erlangen-Nuremberg (FAU), Sternwartstr. 7, 96049 Bamberg, Germany
e-mail: This email address is being protected from spambots. You need JavaScript enabled to view it.
2
Institut für Physik und Astronomie, Universität Potsdam, Karl-Liebknecht-Str. 24/25, 14476 Potsdam, Germany
3
Kavli Institute for Theoretical Physics, University of California, Santa Barbara, CA 93106, USA
4
Division of Physics, Mathematics, and Astronomy, California Institute of Technology, Pasadena, CA 91125, USA
5
European Space Astronomy Centre (ESA/ESAC), Operations Department, Villanueva de la Canada, Madrid, Spain
Received:
7
March
2019
Accepted:
10
July
2019
Abstract
Hypervelocity stars are rare objects, mostly main-sequence (MS) B stars, traveling so fast that they will eventually escape from the Milky Way. Recently, it has been shown that the popular Hills mechanism, in which a binary system is disrupted via a close encounter with the supermassive black hole at the Galactic center, may not be their only ejection mechanism. The analyses of Gaia data ruled out a Galactic center origin for some of them, and instead indicated that they are extreme disk runaway stars ejected at velocities exceeding the predicted limits of classical scenarios (dynamical ejection from star clusters or binary supernova ejection). We present the discovery of a new extreme disk runaway star, PG 1610+062, which is a slowly pulsating B star bright enough to be studied in detail. A quantitative analysis of spectra taken with ESI at the Keck Observatory revealed that PG 1610+062 is a late B-type MS star of 4–5 M⊙ with low projected rotational velocity. Abundances (C, N, O, Ne, Mg, Al, Si, S, Ar, and Fe) were derived differentially with respect to the normal B star HD 137366 and indicate that PG 1610+062 is somewhat metal rich. A kinematic analysis, based on our spectrophotometric distance (17.3 kpc) and on proper motions from Gaia’s second data release, shows that PG 1610+062 was probably ejected from the Carina-Sagittarius spiral arm at a velocity of 550 ± 40 km s−1, which is beyond the classical limits. Accordingly, the star is in the top five of the most extreme MS disk runaway stars and is only the second among the five for which the chemical composition is known.
Key words: stars: abundances / stars: individual: HD 137366 / stars: kinematics and dynamics / stars: individual: PG 1610+062 / stars: early-type
© ESO 2019
1. Introduction
Young stars are expected to be found close to their birthplaces, namely the star-forming regions in the Galactic disk. Finding them far away in the Galactic halo implies that they have been forced to leave their primal environment. Two mechanisms are usually discussed in the literature to explain the presence of these so-called runaway stars (see, e.g., Hoogerwerf et al. 2001 and references therein). In the binary-supernova scenario (Blaauw 1961) the massive primary star of a binary explodes as a core-collapse supernova and the secondary component is released at almost orbital velocity. In the dynamic scenario (Poveda et al. 1967) the runaway stars are formed via gravitational interactions in young and dense stellar clusters, for instance close binary-binary encounters, where the least massive star is usually set free. With typical ejection velocities below a few hundred km s−1, both of these disk runaway scenarios are by far less powerful than the Hills mechanism (Hills 1988), which describes the disruption of a binary system during a close flyby of the supermassive black hole at the Galactic center (GC). Due to the strong tidal forces, one component is captured while the other is able to leave the site at very high velocity (up to thousands of km s−1). To highlight their unique origin (and to follow the nomenclature by Vickers et al. 2015), stars stemming from this particular mechanism are referred to as Hills stars in this work. Apart from their formation channels, ejected stars may also be classified according to whether they are gravitationally bound to or unbound from the Milky Way. Stars exceeding their local escape velocity from the Galaxy are commonly called hypervelocity stars (HVSs), the first of which were discovered in 2005 (Brown et al. 2005; Hirsch et al. 2005; Edelmann et al. 2005). A dedicated spectroscopic survey covering 29% of the sky revealed 21 candidate HVSs, all of which are late B-type stars that are unbound from the Milky Way if they are main-sequence (MS) stars, and thus at distances of 50–120 kpc (Brown et al. 2014). Until recently, the Hills mechanism was widely assumed to be the only ejection scenario that is capable of producing MS HVSs (Brown 2015). However, high-precision astrometry from Gaia’s second data release (DR; Gaia Collaboration 2018) shows that some of the candidate HVSs no longer qualify as Hills stars because the GC can be most likely ruled out as their spatial origin (Irrgang et al. 2018a). Because the ejection velocities of those dismissed Hills stars are higher than the upper limits for the two “classical” disk ejection scenarios mentioned above, a powerful yet neglected or unknown mechanism (e.g., dynamical interactions with massive stars or intermediate-mass black holes) must be at work (Irrgang et al. 2018a). To gain deeper insights, more stars ejected by this mechanism have to be studied in detail. Here, we investigate PG 1610+062, a blue star at high Galactic latitude (b = +37.80°). It was first discovered during the Palomar-Green survey (Green et al. 1986) where it was classified as a horizontal branch B star. Apart from a re-classification as MS B-type star by Geier et al. (2015), no attempt has been made since then to study this object in more detail. The star attracted our attention in the course of the MUCHFUSS project (Geier et al. 2011) because a set of low-resolution spectra indicated that its radial velocity might be variable (Geier et al. 2015). Unlike the faint stars of the HVS sample, which have visual magnitudes between 17.5 and 20 mag (Brown et al. 2014), PG 1610+062 is bright enough (V = 15.6 mag) for a high-precision quantitative spectroscopic (Sect. 2) and photometric (Sect. 3) analysis. A kinematic investigation (Sect. 4) yields an ejection velocity of 550 ± 40 km s−1, granting PG 1610+062 a place in the top five of the most extreme disk runaway MS stars known to date (Sect. 5).
2. Spectroscopic analysis
The spectroscopic analysis is based on four medium-resolution (R ≈ 8000) spectra of decent individual signal-to-noise ratio (S/N ≈ 60 − 110 in the visual) obtained with the ESI spectrograph (Sheinis et al. 2002) mounted at the Keck II telescope and based on low-resolution spectra taken with the SDSS spectrograph (Smee et al. 2013, R ≈ 1500 − 2500, S/N ≈ 102 in the visual) and the TWIN spectrograph1 mounted at the 3.5 m telescope at Calar Alto observatory (R ≈ 1500 − 2500, S/N ≈ 160 in the visual, coadded from 14 individual spectra).
The quantitative analysis strategy and the applied models are explained in detail in Irrgang et al. (2014). In short, a simultaneous fit of all spectra over their entire spectral range is performed to constrain all parameters (i.e., atmospheric parameters and chemical abundances) at the same time. The underlying synthetic spectra are based on the hybrid approach, where the structure of the atmosphere is computed in local thermodynamic equilibrium (LTE) with ATLAS12 (Kurucz et al. 1996). Departures from LTE are then accounted for by applying updated versions of DETAIL and SURFACE (Giddings 1981; Butler & Giddings 1985). The DETAIL code computes population numbers in non-LTE by numerically solving the coupled radiative transfer and statistical equilibrium equations. The SURFACE code uses the resulting departure coefficients and more detailed line-broadening data to compute the final synthetic spectrum. All three codes have been recently updated to allow for level dissolution of hydrogen – following the description by Hubeny et al. (1994) and using line broadening tables by Tremblay & Bergeron (2009) – and non-LTE feedback on the atmospheric structure (Irrgang et al. 2018b).
In order to minimize systematic uncertainties, we carried out a differential abundance analysis with respect to the B-type star HD 137366, for which a high-quality spectrum (R ≈ 48 000, S/N ≈ 470 in the visual) taken with FEROS (Kaufer et al. 1999) is available. This particular object was chosen because, on the one hand, it is nearby and thus a representative of B-type stars in the solar neighborhood and, on the other hand, it is almost a spectroscopic twin of PG 1610+062 (see Fig. A.1) making it an ideal target for a differential abundance study.
The results of the spectroscopic analyses are summarized in Table 1. Both objects are late B-type stars with slow projected rotation (v sin (i)∼15 km s−1), i.e., they exhibit very sharp metal lines. While the abundance pattern of HD 137366 is very similar to those of other young B-type stars in the solar neighborhood (cf. Nieva & Przybilla 2012), there is a uniform enrichment in the elemental abundances of PG 1610+062 (Fig. 1) which indicates a higher baseline metallicity. At least to some extent, this is expected because the star originates ∼1.8 kpc closer to the GC than the Sun (see Sect. 4) so that Galactic abundance gradients (see, e.g., Nieva & Przybilla 2012 and references therein) come into play. Stellar parameters (Table 2) are based on comparing the stars’ positions in a (Teff, log(g)) diagram to single-star evolutionary tracks by Georgy et al. (2013). The two objects are consistent with being young (∼83 Myr), massive (∼4–5 M⊙) MS stars. In principle, the derived values for Teff, log(g), and v sin (i) also fit those of blue horizontal branch stars. This option, however, is very unlikely because the abundance patterns of those evolved objects are strongly altered by diffusion processes, an effect that is not observed here.
Atmospheric parameters and abundances of the two program stars.
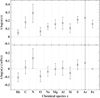 |
Fig. 1. Differential abundance pattern (top) and element-to-iron abundance ratios (bottom) of PG 1610+062 with respect to the solar neighborhood reference star HD 137366. The error bars are the square roots of the quadratic sums of the statistical uncertainties given in Table 1, and thus represent 99% confidence intervals. |
3. Photometric analysis
3.1. Spectral energy distribution
Spectral energy distributions (see Fig. A.2) were also investigated in order to cross-check atmospheric parameters and to derive spectrophotometric distances. Table 3 lists the parameters derived from fitting ATLAS12 models to the available photometric measurements. For both targets, spectroscopic and photometric results are consistent with each other, with almost identical effective temperatures. The spectrophotometric distances d given in Table 2 are based on the corresponding stellar radii R⋆ and on the angular diameters Θ = 2R⋆/d from Table 3. For the nearby reference star HD 137366, the parallax measurement from Gaia DR2 is highly significant (ϖ = 2.8014 ± 0.0566 mas) and can thus be exploited as a consistency check. The agreement between parallactic (1/ϖ = 357 ± 8 pc) and spectrophotometric distance (see Table 2) is perfect, validating its MS nature and showing that our spectrophotometric distance estimates are trustworthy. This is important for PG 1610+062, which is quite distant (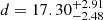 kpc), and hence has a highly uncertain Gaia parallax (ϖ = 0.0143 ± 0.0520 mas).
Stellar parameters, spectrophotometric distances, color excesses, and photospheric mass fractions of the two program stars.
Stellar parameters derived from photometry.
3.2. Light curve
PG 1610+062 lies right inside the instability domain of slowly pulsating B (SPB) stars (see, e.g., Moravveji 2016) and is thus expected to pulsate if it is a MS star. The ATLAS variable star catalog (Heinze et al. 2018) indeed classifies it as a candidate variable star. Because this classification is based on a purely automated procedure, we decided to reanalyze the ATLAS data to test the robustness of the results. The outcome of this exercise, which is presented in the Appendix, confirms the oscillation period reported by Heinze et al. (2018) of 4.336721 days. Moreover, it shows that PG 1610+062 exhibits oscillation properties (see Table A.1) that are characteristic of SPB stars (see, e.g., Catelan & Smith 2015 and references therein). Another typical feature of SPB stars are temporal distortions of the line profiles (see, e.g., Irrgang et al. 2016). Spectra with very high spectral resolution and S/N are required to resolve them, which unfortunately are not available. At the limited quality of our spectra, the variations may only lead to small changes in the radial velocity on the order of a few km s−1, which we and Geier et al. (2015) indeed observed. We conclude that PG 1610+062 is an SPB star, which supports our classification as a MS star.
4. Kinematic analysis
To investigate the origin of PG 1610+062, a detailed kinematic investigation was carried out (i.e., the star’s trajectory was traced back to the Galactic disk; see Fig. 2). Only the most recent disk-crossing event is considered here because all the others occurred too far in the past to be compatible with the lifetime of the star. Systematic uncertainties were estimated by applying three different models for the gravitational potential of the Milky Way, all of which are axisymmetric three-component models with identical mathematical forms for the bulge and disk, but with their own parameter values and varying expressions for the dark matter halo component (see Irrgang et al. 2013 for details). Because the Galactocentric radii traveled by the program star (roughly between 12.4 and 6.5 kpc) lie in a regime where the halo component is the dominating acceleration force (see, e.g., Fig. 1 in Kenyon et al. 2008), these three models are ideally suited to assess systematic uncertainties, which turned out to be completely negligible. A comparison with recent analyses of the motion of globular clusters, satellite galaxies, and extreme velocity stars shows that the models’ mass distributions and local escape velocities are consistent with results from Gaia DR2 astrometry (Irrgang et al. 2018a). Statistical uncertainties in the spectrophotometric distance, radial velocity, and proper motions from Gaia DR2 (Lindegren et al. 2018; Gaia DR2 4450123955938796160, μαcosδ = −0.616 ± 0.076 mas yr−1, μδ = 0.176 ± 0.042 mas yr−1) were propagated via a Monte Carlo procedure with 100 000 runs that simultaneously and independently varies the individual parameters assuming Gaussian distributions for each parameter, while also accounting for asymmetric error bars and the correlation (0.5031) between the two proper motion components. The outcome of the kinematic analysis is summarized in Table 4 and is perfectly consistent with a Galactic disk runaway scenario. PG 1610+062 was shot into the halo ∼41 Myr ago from a region with a Galactocentric radius of ∼6.5 kpc, which possibly coincided with the location of the now nearby Carina-Sagittarius spiral arm. Despite its huge ejection velocity of 550 ± 40 km s−1, it is still gravitationally bound to the Milky Way because the ejection vector was somewhat opposite to Galactic rotation.
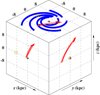 |
Fig. 2. Three-dimensional orbit of PG 1610+062 in a Galactic Cartesian coordinate system in which the z-axis points to the Galactic north pole. The nine trajectories (red lines; arrows indicate the star’s current position) are computed in Model I of Irrgang et al. (2013) and illustrate the effects of uncertainties in the distance, proper motions, and radial velocity. Orbits were computed back in time until they reached the Galactic plane. The small black rimmed, shaded areas are 1σ (red) and 2σ (light blue) contours for the intersection of the Galactic plane. The thick blue solid lines schematically represent the loci of the spiral arms 41 Myr ago based on the polynomial logarithmic arm model of Hou & Han (2014) and the Galactic rotation curve of Model I of Irrgang et al. (2013). The current positions of the Sun and the GC are marked by a yellow circled dot (⊙) and a black plus sign (+), respectively. The orbit is characteristic of a disk runaway star. |
Kinematic parameters of PG 1610+062 for the three different Galactic mass models of Irrgang et al. (2013).
In contrast, the kinematic properties of HD 137366 are typical of thin-disk stars in the solar neighborhood (see Fig. A.5).
5. Summary and discussion
With the release of Gaia DR2, there is growing observational evidence that MS stars can be accelerated to beyond their local Galactic escape velocity from within the Galactic disk, i.e., without the involvement of the supermassive black hole at the GC (Li et al. 2018; Irrgang et al. 2018a; Hattori et al. 2019). While the first of these unbound disk runaway stars (which are sometimes referred to as hyper-runaway stars; see Przybilla et al. 2008), HD 271791, could still be explained in the framework of the “classical” disk ejection scenarios outlined in Sect. 1, namely via an extreme case of the supernova mechanism with additional boost by Galactic rotation (Przybilla et al. 2008), this is not the case for most of the other unbound disk runaway candidates because their intrinsic ejection velocities (see Table 5) exceed the respective upper limits of ∼400 km s−1 (see Irrgang et al. 2018a for an extensive discussion on the upper limits). Close encounters with very massive stars or intermediate-mass black holes offer, in principle, a straightforward explanation (see, e.g., Irrgang et al. 2018a and references therein). However, the rates at which those strong dynamical interactions may occur are not well constrained because the actual number of massive perturbers and the conditions in their host clusters are uncertain (see, e.g., Hattori et al. 2019). With only a few objects known so far, it is still crucial to increase the sample of stars ejected by this powerful mechanism in order to provide tighter observational constraints on the theory. Here, we present the discovery of a new member of this tiny group, PG 1610+062. Owing to the unprecedented precision of proper motions from Gaia DR2 and that this star is relatively close (∼17.3 kpc) compared to many other extreme velocity stars, it is possible to study it in great detail. Our spectroscopic, photometric, and kinematic analyses suggest that PG 1610+062 is a young B-type MS star originating from a relatively small area close to the Carina-Sagittarius spiral arm, which today is not too far away from the Sun. Although it is not gravitationally unbound from the Milky Way, it is in the top five of the most extreme MS disk runaway stars (see Table 5) and is, after LAMOST-HVS1, only the second of these five for which the chemical composition is known.
Ejection velocities (relative to the rotating Galactic disk) and heliocentric distances of candidate MS stars that were possibly ejected from the Galactic disk beyond the velocity limit of classical mechanisms.
Acknowledgments
We thank John E. Davis for the development of the SLXFIG module used to prepare the figures in this paper. Based on observations made with ESO Telescopes at the La Silla Paranal Observatory under programme ID 091.C-0713(A). Based on data from the CAHA Archive at CAB (INTA-CSIC). Some of the data presented herein were obtained at the W.M. Keck Observatory, which is operated as a scientific partnership among the California Institute of Technology, the University of California and the National Aeronautics and Space Administration. The Observatory was made possible by the generous financial support of the W.M. Keck Foundation. The authors wish to recognize and acknowledge the very significant cultural role and reverence that the summit of Mauna Kea has always had within the indigenous Hawaiian community. We are most fortunate to have the opportunity to conduct observations from this mountain. This work has made use of data from the European Space Agency (ESA) mission Gaia (https://www.cosmos.esa.int/gaia), processed by the Gaia Data Processing and Analysis Consortium (DPAC, https://www.cosmos.esa.int/web/gaia/dpac/consortium). Funding for the DPAC has been provided by national institutions, in particular the institutions participating in the Gaia Multilateral Agreement. Funding for the Sloan Digital Sky Survey IV has been provided by the Alfred P. Sloan Foundation, the U.S. Department of Energy Office of Science, and the Participating Institutions. SDSS acknowledges support and resources from the Center for High-Performance Computing at the University of Utah. The SDSS web site is www.sdss.org. SDSS is managed by the Astrophysical Research Consortium for the Participating Institutions of the SDSS Collaboration including the Brazilian Participation Group, the Carnegie Institution for Science, Carnegie Mellon University, the Chilean Participation Group, the French Participation Group, Harvard-Smithsonian Center for Astrophysics, Instituto de Astrofísica de Canarias, The Johns Hopkins University, Kavli Institute for the Physics and Mathematics of the Universe (IPMU)/University of Tokyo, Lawrence Berkeley National Laboratory, Leibniz Institut für Astrophysik Potsdam (AIP), Max-Planck-Institut für Astronomie (MPIA Heidelberg), Max-Planck-Institut für Astrophysik (MPA Garching), Max-Planck-Institut für Extraterrestrische Physik (MPE), National Astronomical Observatories of China, New Mexico State University, New York University, University of Notre Dame, Observatório Nacional/MCTI, The Ohio State University, Pennsylvania State University, Shanghai Astronomical Observatory, United Kingdom Participation Group, Universidad Nacional Autónoma de México, University of Arizona, University of Colorado Boulder, University of Oxford, University of Portsmouth, University of Utah, University of Virginia, University of Washington, University of Wisconsin, Vanderbilt University, and Yale University. Based on observations made with the NASA Galaxy Evolution Explorer. GALEX is operated for NASA by the California Institute of Technology under NASA contract NAS5-98034. The Pan-STARRS1 Surveys (PS1) and the PS1 public science archive have been made possible through contributions by the Institute for Astronomy, the University of Hawaii, the Pan-STARRS Project Office, the Max-Planck Society and its participating institutes, the Max Planck Institute for Astronomy, Heidelberg and the Max Planck Institute for Extraterrestrial Physics, Garching, The Johns Hopkins University, Durham University, the University of Edinburgh, the Queen’s University Belfast, the Harvard-Smithsonian Center for Astrophysics, the Las Cumbres Observatory Global Telescope Network Incorporated, the National Central University of Taiwan, the Space Telescope Science Institute, the National Aeronautics and Space Administration under Grant No. NNX08AR22G issued through the Planetary Science Division of the NASA Science Mission Directorate, the National Science Foundation Grant No. AST-1238877, the University of Maryland, Eotvos Lorand University (ELTE), the Los Alamos National Laboratory, and the Gordon and Betty Moore Foundation. This publication makes use of data products from the Two Micron All Sky Survey, which is a joint project of the University of Massachusetts and the Infrared Processing and Analysis Center/California Institute of Technology, funded by the National Aeronautics and Space Administration and the National Science Foundation. This publication makes use of data products from the Wide-field Infrared Survey Explorer, which is a joint project of the University of California, Los Angeles, and the Jet Propulsion Laboratory/California Institute of Technology, funded by the National Aeronautics and Space Administration.
References
- Ahn, C. P., Alexandroff, R., Allende Prieto, C., et al. 2012, ApJS, 203, 21 [NASA ADS] [CrossRef] [Google Scholar]
- Bianchi, L., Herald, J., Efremova, B., et al. 2011, Ap&SS, 335, 161 [NASA ADS] [CrossRef] [Google Scholar]
- Blaauw, A. 1961, Bull. Astron. Inst. Neth., 15, 265 [Google Scholar]
- Brown, W. R. 2015, Annu. Rev. Astron. Astrophys., 53, 15 [NASA ADS] [CrossRef] [Google Scholar]
- Brown, W. R., Geller, M. J., Kenyon, S. J., & Kurtz, M. J. 2005, ApJ, 622, L33 [NASA ADS] [CrossRef] [Google Scholar]
- Brown, W. R., Geller, M. J., & Kenyon, S. J. 2014, ApJ, 787, 89 [NASA ADS] [CrossRef] [Google Scholar]
- Butler, K., & Giddings, J. R. 1985, Newsletter of Analysis of Astronomical Spectra, No. 9 (Univ. London) [Google Scholar]
- Camarota, L., & Holberg, J. B. 2014, MNRAS, 438, 3111 [NASA ADS] [CrossRef] [Google Scholar]
- Catelan, M., & Smith, H. A. 2015, Pulsating Stars (New York: Wiley-VCH) [CrossRef] [Google Scholar]
- Chambers, K. C., Magnier, E. A., Metcalfe, N., et al. 2017, VizieR Online Data Catalog: II/349 [Google Scholar]
- Cutri, R. M., et al. 2014, VizieR Online Data Catalog: II/328 [Google Scholar]
- Edelmann, H., Napiwotzki, R., Heber, U., Christlieb, N., & Reimers, D. 2005, ApJ, 634, L181 [NASA ADS] [CrossRef] [Google Scholar]
- Evans, D. W., Riello, M., De Angeli, F., et al. 2018, A&A, 616, A4 [NASA ADS] [CrossRef] [EDP Sciences] [Google Scholar]
- Fitzpatrick, E. L. 1999, PASP, 111, 63 [NASA ADS] [CrossRef] [Google Scholar]
- Gaia Collaboration (Brown, A. G. A., et al.) 2018, A&A, 616, A1 [NASA ADS] [CrossRef] [EDP Sciences] [Google Scholar]
- Geier, S., Hirsch, H., Tillich, A., et al. 2011, A&A, 530, A28 [NASA ADS] [CrossRef] [EDP Sciences] [Google Scholar]
- Geier, S., Kupfer, T., Heber, U., et al. 2015, A&A, 577, A26 [NASA ADS] [CrossRef] [EDP Sciences] [Google Scholar]
- Georgy, C., Ekström, S., Granada, A., et al. 2013, A&A, 553, A24 [NASA ADS] [CrossRef] [EDP Sciences] [Google Scholar]
- Giddings, J. R. 1981, PhD Thesis, Univ. London [Google Scholar]
- Green, R. F., Schmidt, M., & Liebert, J. 1986, ApJS, 61, 305 [NASA ADS] [CrossRef] [Google Scholar]
- Hattori, K., Valluri, M., Castro, N., et al. 2019, ApJ, 873, 116 [NASA ADS] [CrossRef] [Google Scholar]
- Heber, U., Edelmann, H., Napiwotzki, R., Altmann, M., & Scholz, R.-D. 2008, A&A, 483, L21 [NASA ADS] [CrossRef] [EDP Sciences] [Google Scholar]
- Heinze, A. N., Tonry, J. L., Denneau, L., et al. 2018, AJ, 156, 241 [NASA ADS] [CrossRef] [Google Scholar]
- Henden, A. A., Levine, S., Terrell, D., & Welch, D. L. 2015, Amer. Astron. Soc. Mett. Abstr., 225, 336.16 [Google Scholar]
- Hills, J. G. 1988, Nature, 331, 687 [Google Scholar]
- Hirsch, H. A., Heber, U., O’Toole, S. J., & Bresolin, F. 2005, A&A, 444, L61 [NASA ADS] [CrossRef] [EDP Sciences] [Google Scholar]
- Hoogerwerf, R., de Bruijne, J. H. J., & de Zeeuw, P. T. 2001, A&A, 365, 49 [NASA ADS] [CrossRef] [EDP Sciences] [Google Scholar]
- Hou, L. G., & Han, J. L. 2014, A&A, 569, A125 [NASA ADS] [CrossRef] [EDP Sciences] [Google Scholar]
- Hubeny, I., Hummer, D. G., & Lanz, T. 1994, A&A, 282, 151 [NASA ADS] [Google Scholar]
- Irrgang, A., Wilcox, B., Tucker, E., & Schiefelbein, L. 2013, A&A, 549, A137 [NASA ADS] [CrossRef] [EDP Sciences] [Google Scholar]
- Irrgang, A., Przybilla, N., Heber, U., et al. 2014, A&A, 565, A63 [NASA ADS] [CrossRef] [EDP Sciences] [Google Scholar]
- Irrgang, A., Desphande, A., Moehler, S., Mugrauer, M., & Janousch, D. 2016, A&A, 591, L6 [NASA ADS] [CrossRef] [EDP Sciences] [Google Scholar]
- Irrgang, A., Kreuzer, S., & Heber, U. 2018a, A&A, 620, A48 [NASA ADS] [CrossRef] [EDP Sciences] [Google Scholar]
- Irrgang, A., Kreuzer, S., Heber, U., & Brown, W. 2018b, A&A, 615, L5 [NASA ADS] [CrossRef] [EDP Sciences] [Google Scholar]
- Kaufer, A., Stahl, O., Tubbesing, S., et al. 1999, The Messenger, 95, 8 [Google Scholar]
- Kenyon, S. J., Bromley, B. C., Geller, M. J., & Brown, W. R. 2008, ApJ, 680, 312 [NASA ADS] [CrossRef] [Google Scholar]
- Kurucz, R. L. 1996, in Model Atmospheres and Spectrum Synthesis, eds. S. J. Adelman, F. Kupka, & W. W. Weiss (San Francisco: ASP), 160 [Google Scholar]
- Li, Y.-B., Luo, A.-L., Zhao, G., et al. 2018, AJ, 156, 87 [NASA ADS] [CrossRef] [Google Scholar]
- Lindegren, L., Hernández, J., Bombrun, A., et al. 2018, A&A, 616, A2 [NASA ADS] [CrossRef] [EDP Sciences] [Google Scholar]
- Moehler, S., Modigliani, A., Freudling, W., et al. 2014, A&A, 568, A9 [NASA ADS] [CrossRef] [EDP Sciences] [Google Scholar]
- Moravveji, E. 2016, MNRAS, 455, L67 [NASA ADS] [Google Scholar]
- Nieva, M.-F., & Przybilla, N. 2012, A&A, 539, A143 [NASA ADS] [CrossRef] [EDP Sciences] [Google Scholar]
- Poveda, A., Ruiz, J., & Allen, C. 1967, Boletin de los Observatorios Tonantzintla y Tacubaya, 4, 86 [Google Scholar]
- Przybilla, N., Fernanda Nieva, M., Heber, U., & Butler, K. 2008, ApJ, 684, L103 [Google Scholar]
- Rufener, F. 1988, Catalogue of stars measured in the Geneva Observatory photometric system : 4: 1988 (Sauverny: Observatoire de Geneve) [Google Scholar]
- Sheinis, A. I., Bolte, M., Epps, H. W., et al. 2002, PASP, 114, 851 [NASA ADS] [CrossRef] [Google Scholar]
- Silva, M. D. V., & Napiwotzki, R. 2011, MNRAS, 411, 2596 [NASA ADS] [CrossRef] [Google Scholar]
- Skrutskie, M. F., Cutri, R. M., Stiening, R., et al. 2006, AJ, 131, 1163 [NASA ADS] [CrossRef] [Google Scholar]
- Smee, S. A., Gunn, J. E., Uomoto, A., et al. 2013, AJ, 146, 32 [Google Scholar]
- Tremblay, P. E., & Bergeron, P. 2009, ApJ, 696, 1755 [NASA ADS] [CrossRef] [Google Scholar]
- van Leeuwen, F. 2007, in Hipparcos, the New Reduction of the Raw Data, Astrophys. Space Sci. Lib., 350 [Google Scholar]
- Vickers, J. J., Smith, M. C., & Grebel, E. K. 2015, AJ, 150, 77 [NASA ADS] [CrossRef] [Google Scholar]
Appendix
After removing a few obvious outliers, the available ATLAS light curves (which consist of 90 measurements in the cyan (c) band spread over 653.29 days and 88 data points in the orange (o) band spread over 686.25 days) were fitted with a cosine function of the form
![Mathematical equation: $$ \begin{aligned} \mathrm{mag} _j(t) = \overline{\mathrm{mag} }_j + A_{j} \cos \left(2\pi \left[(t-T_{\mathrm{ref} }) \nu _\mathrm{osc} +\phi _{\mathrm{ref} }\right] \right). \end{aligned} $$](/articles/aa/full_html/2019/08/aa35429-19/aa35429-19-eq186.gif) (A.1)
(A.1)
The time-dependent magnitude magj(t) is thus parameterized by a mean magnitude  , an oscillation semiamplitude Aj, and an oscillation frequency νosc. The parameter ϕref is the phase at the fixed reference epoch Tref. The index j ∈ {c, o} refers to the two passbands. The best-fitting parameters are listed in Table A.1 and the corresponding phased light curves are shown in Fig. A.3. The oscillation period reported by Heinze et al. (2018), 4.336721 days, is nicely confirmed here. However, due to the very scarce sampling, alias frequencies at 1 − νosc, 1 + νosc, and 2 − νosc are almost as likely as νosc itself (see Fig. A.4). Without better data coverage, it remains unclear which of them is actually the true one.
Observed oscillation parameters of PG 1610+062 derived from the two ATLAS light curves.
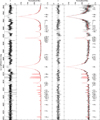 |
Fig. A.1. Comparison of best-fitting model spectrum (red line) with normalized observed spectrum (black line) for HD 137366 (left, FEROS) and PG 1610+062 (right, ESI). Light colors mark regions that have been excluded from fitting (e.g., due to the presence of features that are not properly included in our models). For the sake of clarity, only the strongest of the lines used in the analysis are labeled. Residuals χ are shown as well. Telluric correction is performed via interpolation within the pre-calculated grid of transmission spectra presented by Moehler et al. (2014). Although the atmospheric conditions used in this spectral library are tailored to Cerro Paranal, the two free parameters of airmass and precipitable water vapor content are enough to ensure a decent representation of many telluric features for different observing sites and weather conditions. Regions where telluric features are not properly reproduced by this approach have been excluded as well. |
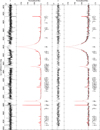 |
Fig. A.1. continued. |
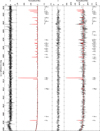 |
Fig. A.1. continued. |
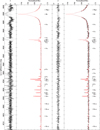 |
Fig. A.1. continued. |
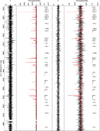 |
Fig. A.1. continued. |
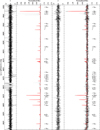 |
Fig. A.1. continued. |
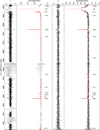 |
Fig. A.1. continued. |
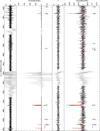 |
Fig. A.1. continued. |
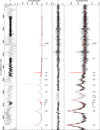 |
Fig. A.1. continued. |
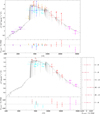 |
Fig. A.2. Comparison of synthetic and observed photometry for PG 1610+062 (top figure) and HD 137366 (bottom figure). The main panels show the spectral energy distributions. The colored data points are filter-averaged fluxes which were converted from observed magnitudes (the respective filter widths are indicated by the dashed horizontal lines), while the gray solid line represents the best-fitting model (degraded to a spectral resolution of 6 Å). The residual panels at the bottom and on the side show the differences between synthetic and observed magnitudes and colors, respectively. The extinction law by Fitzpatrick (1999) with the color excess as free parameter was used to account for interstellar reddening. The photometric systems are color-coded as follows: violet: GALEX (DR5, Bianchi et al. 2011, corrected using the description given in Camarota & Holberg 2014); gold: SDSS (DR9, Ahn et al. 2012); blue: Johnson-Cousins (APASS DR9, Henden et al. 2015); cyan: Gaia (Evans et al. 2018), HIPPARCOS (van Leeuwen 2007); brown: Tycho (van Leeuwen 2007); crimson: Pan-STARRS (Chambers et al. 2017), Geneva (Rufener 1988); red: 2MASS (Skrutskie et al. 2006); magenta: WISE (Cutri et al. 2014). |
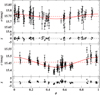 |
Fig. A.3. Phased ATLAS light curves for PG 1610+062: the measurements are represented by black crosses with error bars while the best-fitting model (see Table A.1) is indicated by the red solid curve. The red dashed line indicates the derived mean magnitude. Residuals χ are shown as well. |
 |
Fig. A.4. The χ2 landscape (“periodogram”), which results from fitting the ATLAS light curves with the model given in Eq. (A.1), as a function of the oscillation frequency νosc, which is sampled in steps of 0.01/686.25 d−1 to ensure that phase shifts are always less than 0.01. |
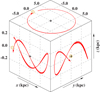 |
Fig. A.5. Same as Fig. 2, but for HD 137366. Orbits were computed back in time for 200 Myr. The star behaves like a typical solar-neighborhood object. |
All Tables
Stellar parameters, spectrophotometric distances, color excesses, and photospheric mass fractions of the two program stars.
Kinematic parameters of PG 1610+062 for the three different Galactic mass models of Irrgang et al. (2013).
Ejection velocities (relative to the rotating Galactic disk) and heliocentric distances of candidate MS stars that were possibly ejected from the Galactic disk beyond the velocity limit of classical mechanisms.
Observed oscillation parameters of PG 1610+062 derived from the two ATLAS light curves.
All Figures
|
Fig. 1. Differential abundance pattern (top) and element-to-iron abundance ratios (bottom) of PG 1610+062 with respect to the solar neighborhood reference star HD 137366. The error bars are the square roots of the quadratic sums of the statistical uncertainties given in Table 1, and thus represent 99% confidence intervals. |
| In the text | |
|
Fig. 2. Three-dimensional orbit of PG 1610+062 in a Galactic Cartesian coordinate system in which the z-axis points to the Galactic north pole. The nine trajectories (red lines; arrows indicate the star’s current position) are computed in Model I of Irrgang et al. (2013) and illustrate the effects of uncertainties in the distance, proper motions, and radial velocity. Orbits were computed back in time until they reached the Galactic plane. The small black rimmed, shaded areas are 1σ (red) and 2σ (light blue) contours for the intersection of the Galactic plane. The thick blue solid lines schematically represent the loci of the spiral arms 41 Myr ago based on the polynomial logarithmic arm model of Hou & Han (2014) and the Galactic rotation curve of Model I of Irrgang et al. (2013). The current positions of the Sun and the GC are marked by a yellow circled dot (⊙) and a black plus sign (+), respectively. The orbit is characteristic of a disk runaway star. |
| In the text | |
|
Fig. A.1. Comparison of best-fitting model spectrum (red line) with normalized observed spectrum (black line) for HD 137366 (left, FEROS) and PG 1610+062 (right, ESI). Light colors mark regions that have been excluded from fitting (e.g., due to the presence of features that are not properly included in our models). For the sake of clarity, only the strongest of the lines used in the analysis are labeled. Residuals χ are shown as well. Telluric correction is performed via interpolation within the pre-calculated grid of transmission spectra presented by Moehler et al. (2014). Although the atmospheric conditions used in this spectral library are tailored to Cerro Paranal, the two free parameters of airmass and precipitable water vapor content are enough to ensure a decent representation of many telluric features for different observing sites and weather conditions. Regions where telluric features are not properly reproduced by this approach have been excluded as well. |
| In the text | |
|
Fig. A.1. continued. |
| In the text | |
|
Fig. A.1. continued. |
| In the text | |
|
Fig. A.1. continued. |
| In the text | |
|
Fig. A.1. continued. |
| In the text | |
|
Fig. A.1. continued. |
| In the text | |
|
Fig. A.1. continued. |
| In the text | |
|
Fig. A.1. continued. |
| In the text | |
|
Fig. A.1. continued. |
| In the text | |
|
Fig. A.2. Comparison of synthetic and observed photometry for PG 1610+062 (top figure) and HD 137366 (bottom figure). The main panels show the spectral energy distributions. The colored data points are filter-averaged fluxes which were converted from observed magnitudes (the respective filter widths are indicated by the dashed horizontal lines), while the gray solid line represents the best-fitting model (degraded to a spectral resolution of 6 Å). The residual panels at the bottom and on the side show the differences between synthetic and observed magnitudes and colors, respectively. The extinction law by Fitzpatrick (1999) with the color excess as free parameter was used to account for interstellar reddening. The photometric systems are color-coded as follows: violet: GALEX (DR5, Bianchi et al. 2011, corrected using the description given in Camarota & Holberg 2014); gold: SDSS (DR9, Ahn et al. 2012); blue: Johnson-Cousins (APASS DR9, Henden et al. 2015); cyan: Gaia (Evans et al. 2018), HIPPARCOS (van Leeuwen 2007); brown: Tycho (van Leeuwen 2007); crimson: Pan-STARRS (Chambers et al. 2017), Geneva (Rufener 1988); red: 2MASS (Skrutskie et al. 2006); magenta: WISE (Cutri et al. 2014). |
| In the text | |
|
Fig. A.3. Phased ATLAS light curves for PG 1610+062: the measurements are represented by black crosses with error bars while the best-fitting model (see Table A.1) is indicated by the red solid curve. The red dashed line indicates the derived mean magnitude. Residuals χ are shown as well. |
| In the text | |
|
Fig. A.4. The χ2 landscape (“periodogram”), which results from fitting the ATLAS light curves with the model given in Eq. (A.1), as a function of the oscillation frequency νosc, which is sampled in steps of 0.01/686.25 d−1 to ensure that phase shifts are always less than 0.01. |
| In the text | |
|
Fig. A.5. Same as Fig. 2, but for HD 137366. Orbits were computed back in time for 200 Myr. The star behaves like a typical solar-neighborhood object. |
| In the text | |
Current usage metrics show cumulative count of Article Views (full-text article views including HTML views, PDF and ePub downloads, according to the available data) and Abstracts Views on Vision4Press platform.
Data correspond to usage on the plateform after 2015. The current usage metrics is available 48-96 hours after online publication and is updated daily on week days.
Initial download of the metrics may take a while.