Free Access
Fig. A.4.
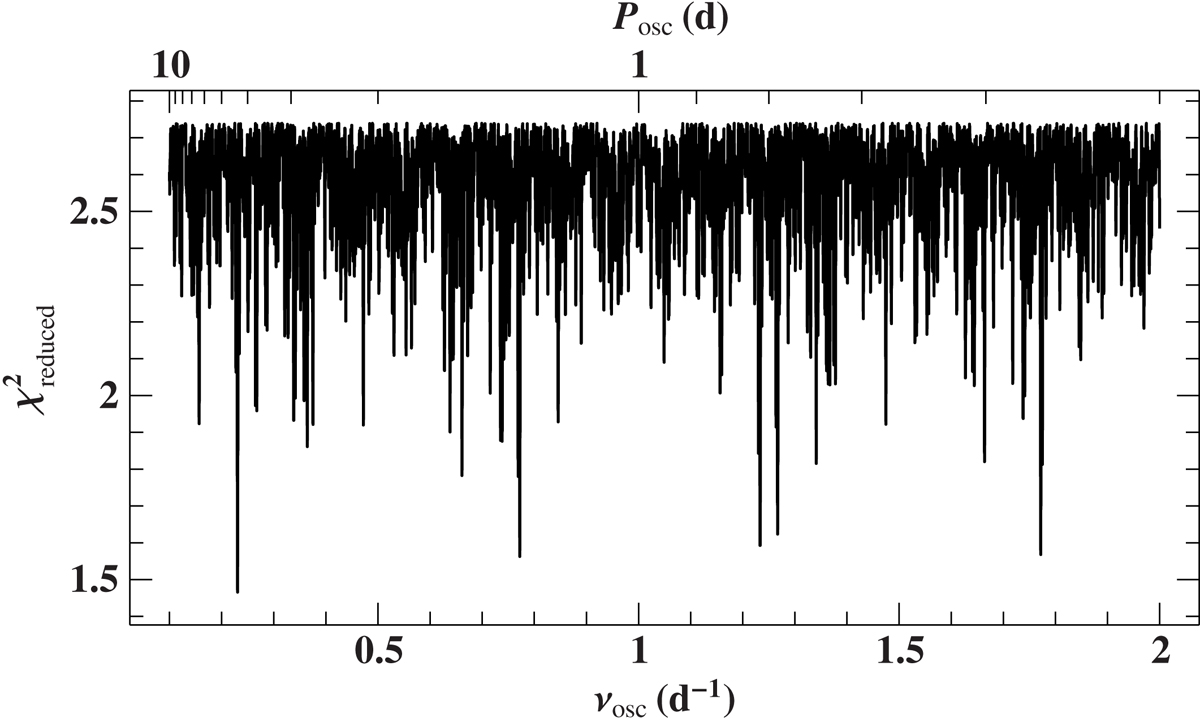
The χ2 landscape (“periodogram”), which results from fitting the ATLAS light curves with the model given in Eq. (A.1), as a function of the oscillation frequency νosc, which is sampled in steps of 0.01/686.25 d−1 to ensure that phase shifts are always less than 0.01.
Current usage metrics show cumulative count of Article Views (full-text article views including HTML views, PDF and ePub downloads, according to the available data) and Abstracts Views on Vision4Press platform.
Data correspond to usage on the plateform after 2015. The current usage metrics is available 48-96 hours after online publication and is updated daily on week days.
Initial download of the metrics may take a while.