Free Access
Fig. A.3.
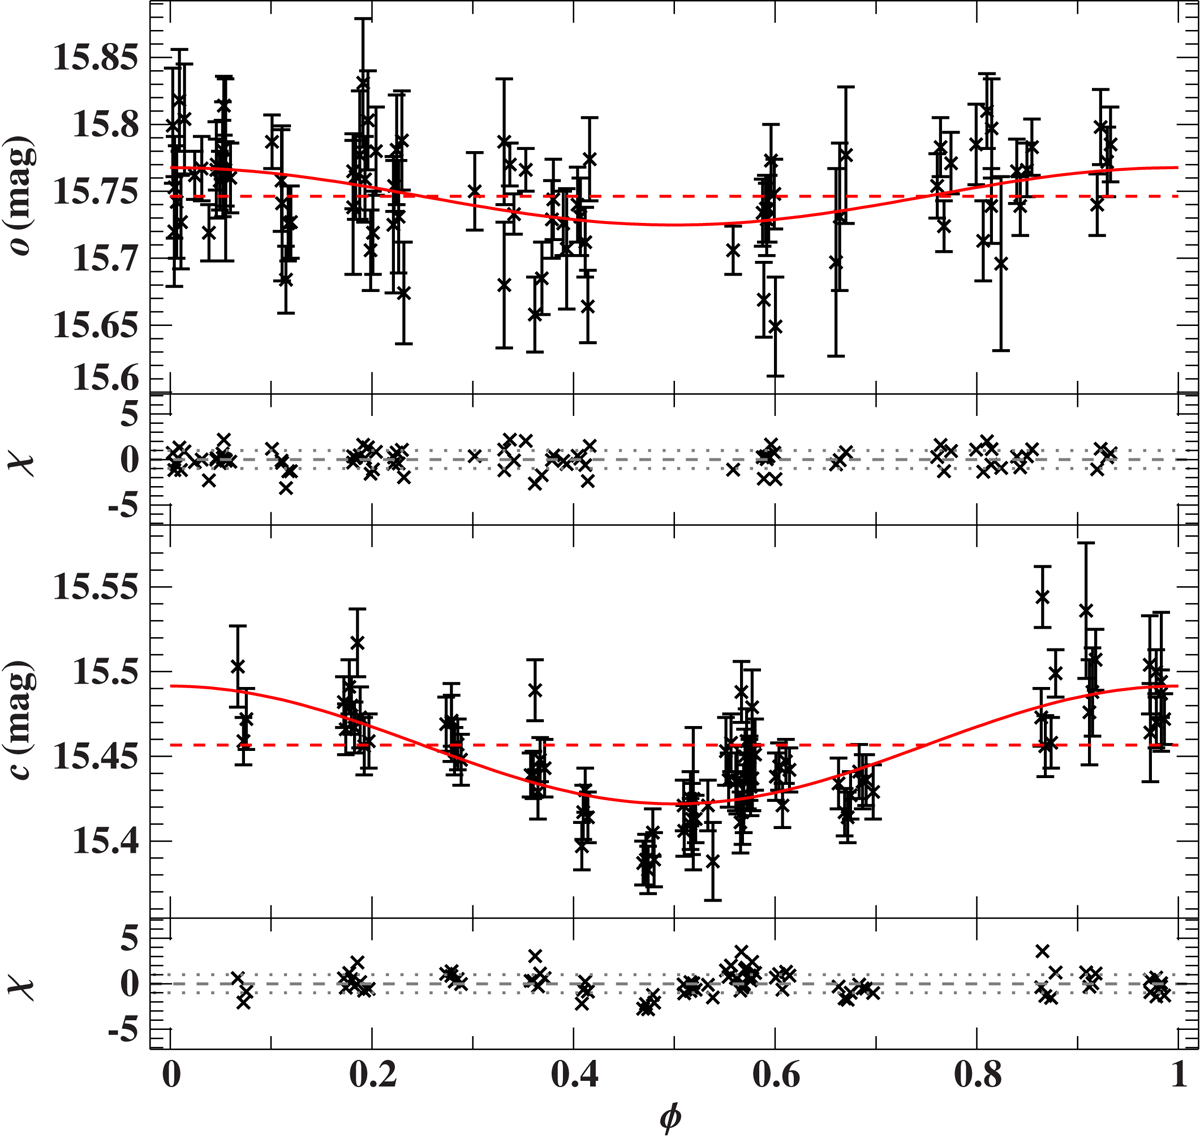
Phased ATLAS light curves for PG 1610+062: the measurements are represented by black crosses with error bars while the best-fitting model (see Table A.1) is indicated by the red solid curve. The red dashed line indicates the derived mean magnitude. Residuals χ are shown as well.
Current usage metrics show cumulative count of Article Views (full-text article views including HTML views, PDF and ePub downloads, according to the available data) and Abstracts Views on Vision4Press platform.
Data correspond to usage on the plateform after 2015. The current usage metrics is available 48-96 hours after online publication and is updated daily on week days.
Initial download of the metrics may take a while.