Fig. A.1.
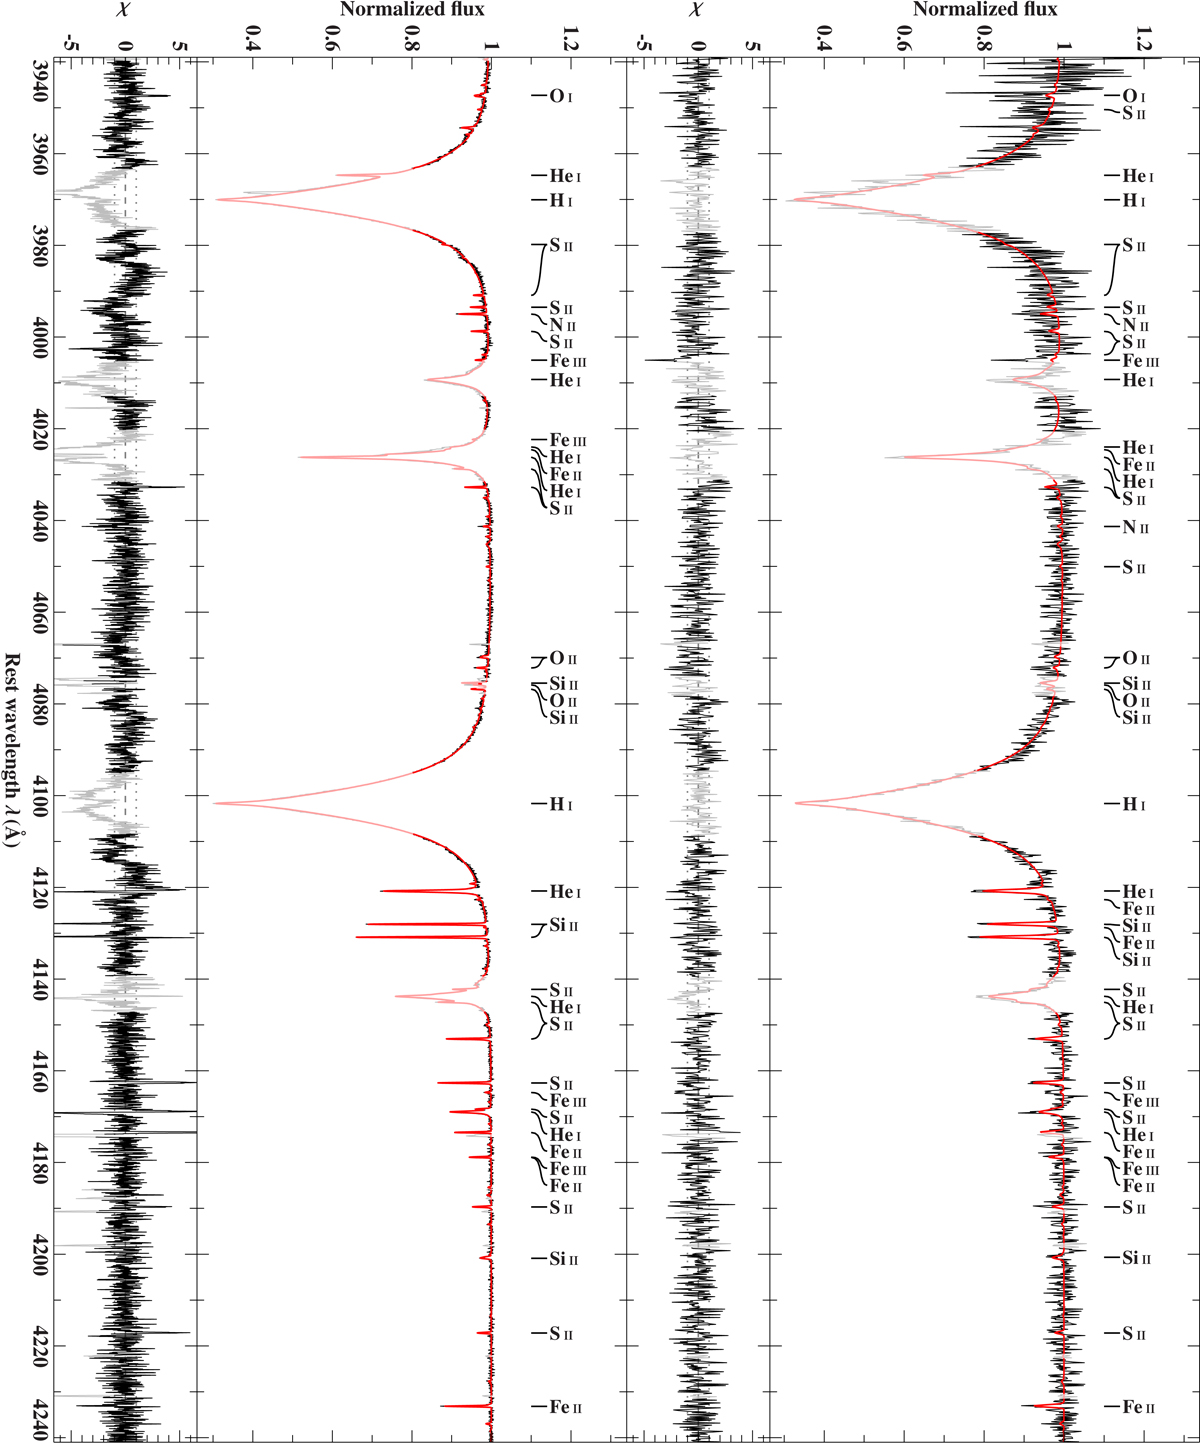
Comparison of best-fitting model spectrum (red line) with normalized observed spectrum (black line) for HD 137366 (left, FEROS) and PG 1610+062 (right, ESI). Light colors mark regions that have been excluded from fitting (e.g., due to the presence of features that are not properly included in our models). For the sake of clarity, only the strongest of the lines used in the analysis are labeled. Residuals χ are shown as well. Telluric correction is performed via interpolation within the pre-calculated grid of transmission spectra presented by Moehler et al. (2014). Although the atmospheric conditions used in this spectral library are tailored to Cerro Paranal, the two free parameters of airmass and precipitable water vapor content are enough to ensure a decent representation of many telluric features for different observing sites and weather conditions. Regions where telluric features are not properly reproduced by this approach have been excluded as well.
Current usage metrics show cumulative count of Article Views (full-text article views including HTML views, PDF and ePub downloads, according to the available data) and Abstracts Views on Vision4Press platform.
Data correspond to usage on the plateform after 2015. The current usage metrics is available 48-96 hours after online publication and is updated daily on week days.
Initial download of the metrics may take a while.