Free Access
Fig. 1.
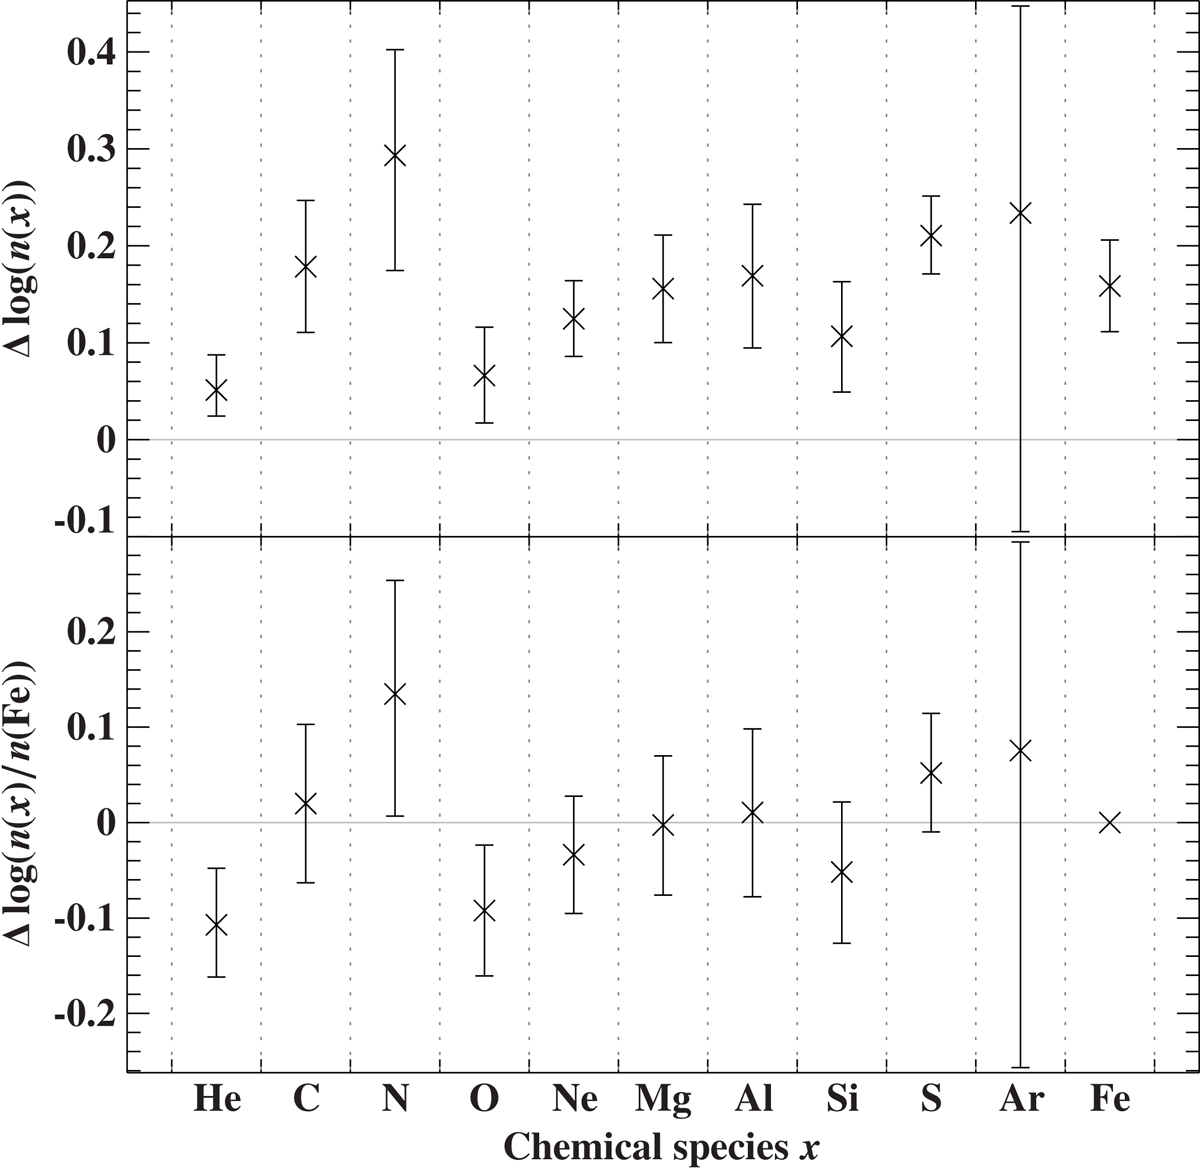
Differential abundance pattern (top) and element-to-iron abundance ratios (bottom) of PG 1610+062 with respect to the solar neighborhood reference star HD 137366. The error bars are the square roots of the quadratic sums of the statistical uncertainties given in Table 1, and thus represent 99% confidence intervals.
Current usage metrics show cumulative count of Article Views (full-text article views including HTML views, PDF and ePub downloads, according to the available data) and Abstracts Views on Vision4Press platform.
Data correspond to usage on the plateform after 2015. The current usage metrics is available 48-96 hours after online publication and is updated daily on week days.
Initial download of the metrics may take a while.