Fig. A.2.
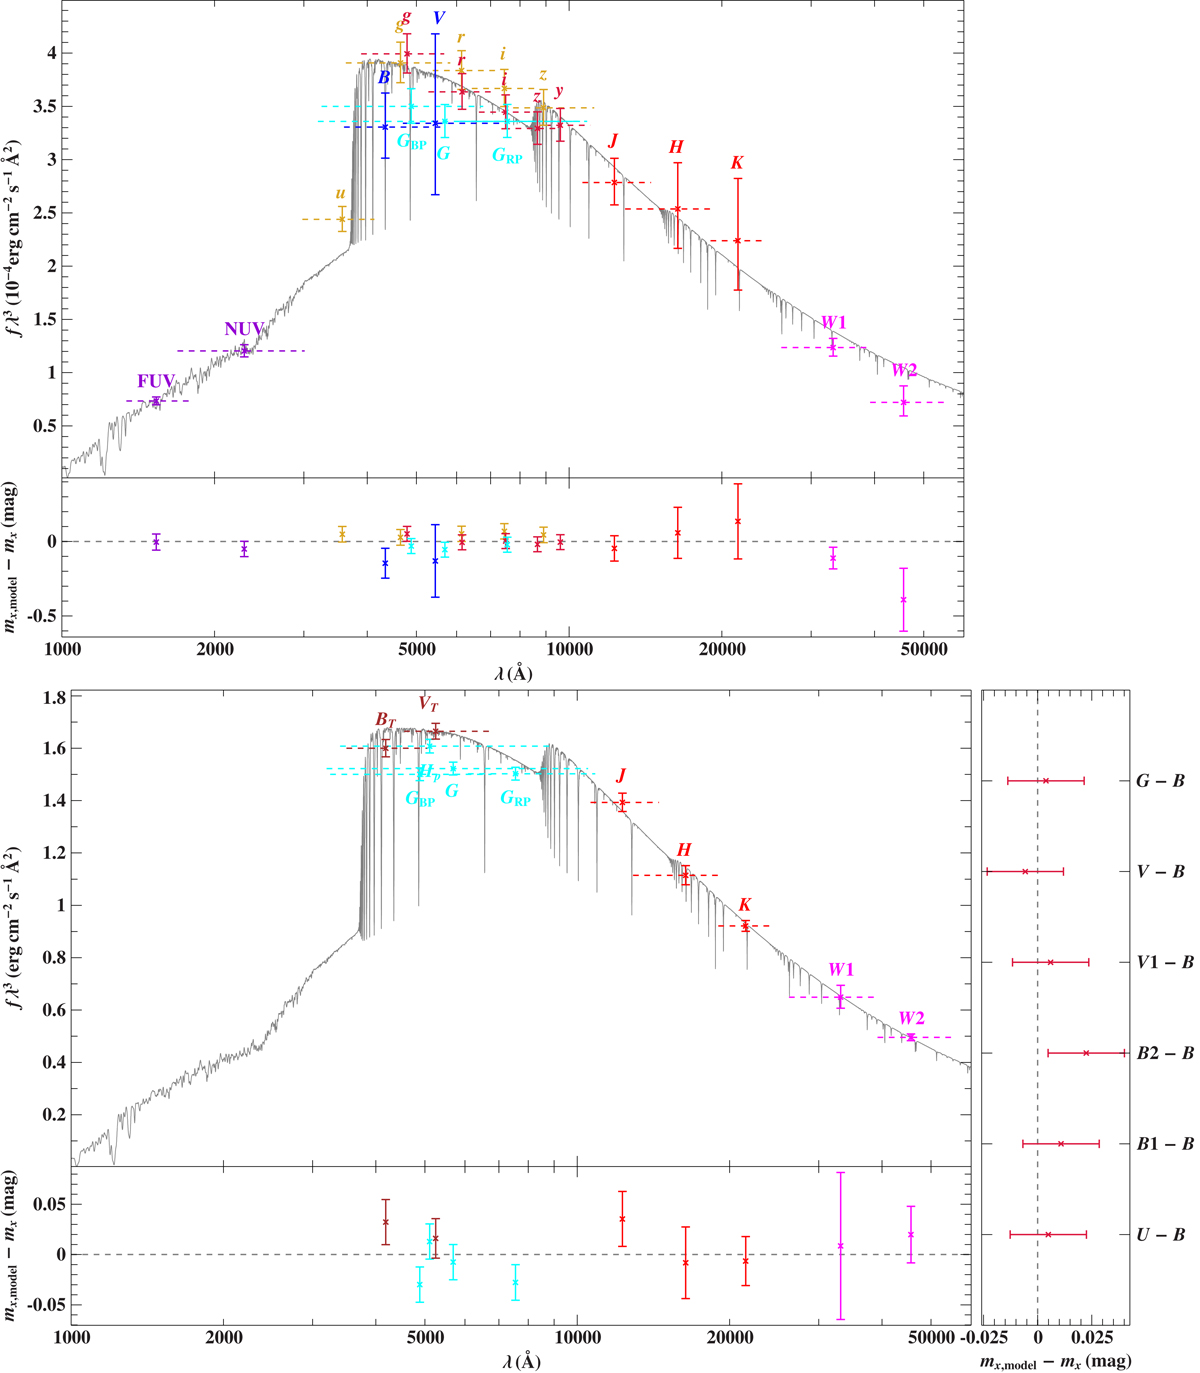
Comparison of synthetic and observed photometry for PG 1610+062 (top figure) and HD 137366 (bottom figure). The main panels show the spectral energy distributions. The colored data points are filter-averaged fluxes which were converted from observed magnitudes (the respective filter widths are indicated by the dashed horizontal lines), while the gray solid line represents the best-fitting model (degraded to a spectral resolution of 6 Å). The residual panels at the bottom and on the side show the differences between synthetic and observed magnitudes and colors, respectively. The extinction law by Fitzpatrick (1999) with the color excess as free parameter was used to account for interstellar reddening. The photometric systems are color-coded as follows: violet: GALEX (DR5, Bianchi et al. 2011, corrected using the description given in Camarota & Holberg 2014); gold: SDSS (DR9, Ahn et al. 2012); blue: Johnson-Cousins (APASS DR9, Henden et al. 2015); cyan: Gaia (Evans et al. 2018), HIPPARCOS (van Leeuwen 2007); brown: Tycho (van Leeuwen 2007); crimson: Pan-STARRS (Chambers et al. 2017), Geneva (Rufener 1988); red: 2MASS (Skrutskie et al. 2006); magenta: WISE (Cutri et al. 2014).
Current usage metrics show cumulative count of Article Views (full-text article views including HTML views, PDF and ePub downloads, according to the available data) and Abstracts Views on Vision4Press platform.
Data correspond to usage on the plateform after 2015. The current usage metrics is available 48-96 hours after online publication and is updated daily on week days.
Initial download of the metrics may take a while.