| Issue |
A&A
Volume 601, May 2017
|
|
|---|---|---|
| Article Number | L3 | |
| Number of page(s) | 4 | |
| Section | Letters | |
| DOI | https://doi.org/10.1051/0004-6361/201730851 | |
| Published online | 03 May 2017 | |
First detection of the 448 GHz H2O transition in space
1 Department of Physics, University of Oxford, Keble Road, Oxford, OX1 3RH, UK
e-mail: This email address is being protected from spambots. You need JavaScript enabled to view it.
2 Universidad de Alcalá, Departamento de Física y Matemáticas, Campus Universitario, 28871 Alcalá de Henares, Madrid, Spain
3 Observatorio Astronómico Nacional (OAN-IGN)-Observatorio de Madrid, Alfonso XII, 3, 28014 Madrid, Spain
4 Centro de Astrobiología (CSIC/INTA), Ctra de Torrejón a Ajalvir, km 4, 28850 Torrejón de Ardoz, Madrid, Spain
5 Instituto de Astrofísica de Andalucía, CSIC, Glorieta de la Astronomía, s/n, 18008 Granada, Spain
6 Universidade Federal do Rio Grande do Sul, Instituto de Física, CP 15051, Porto Alegre 91501-970, RS, Brazil
Received: 22 March 2017
Accepted: 18 April 2017
Abstract
We present the first detection of the ortho-H2O 423 − 330 transition at 448 GHz in space. We observed this transition in the local (z = 0.010) luminous infrared (IR) galaxy ESO 320-G030 (IRAS F11506-3851) using the Atacama Large Millimeter/submillimeter Array (ALMA). The water 423 − 330 emission, which originates in the highly obscured nucleus of this galaxy, is spatially resolved over a region of ~65 pc in diameter and shows a regular rotation pattern compatible with the global molecular and ionized gas kinematics. The line profile is symmetric and well fitted by a Gaussian with an integrated flux of 37.0 ± 0.7 Jy km s-1. Models predict this water transition as a potential collisionally excited maser transition. On the contrary, in this galaxy, we find that the 423 − 330 emission is primarily excited by the intense far-IR radiation field present in its nucleus. According to our modeling, this transition is a probe of deeply buried galaxy nuclei thanks to the high dust optical depths (τ100μm> 1, NH> 1024 cm-2) required to efficiently excite it.
Key words: galaxies: ISM / galaxies: nuclei / infrared: galaxies / ISM: molecules
© ESO, 2017
1. Introduction
Water is a molecule of astrophysical interest because it not only plays a central role in the Oxygen chemistry of the interstellar medium (e.g., Hollenbach et al. 2009; van Dishoeck et al. 2013) but it is also one of the main coolants of shocked gas (e.g., Flower & Pineau Des Forêts 2010). In addition, thanks to its energy level structure, water couples very well to the far-infrared (far-IR) radiation field providing an effective probe of the far-IR continuum in the warm compact regions found in active galactic nuclei (AGNs) and young star-forming regions (e.g., González-Alfonso et al. 2014, hereafter GA14).
Water excitation models have long predicted the maser nature of the 423 − 330 transition pumped by collisions when the kinetic temperature is Tkin ~ 1000 K and the hydrogen density nH2 ~ 105 cm-3 (e.g., Deguchi 1977; Cooke & Elitzur 1985; Neufeld & Melnick 1991; Yates et al. 1997; Daniel & Cernicharo 2013; Gray et al. 2016). This transition can also be excited by radiative pumping through the absorption of far-IR photons (see Sect. 4 and Fig. 1). Therefore, the determination of the dominant excitation mechanism, which might vary from source to source, is required to properly interpret the 423 − 330 emission as a tracer of dense hot molecular gas or as a tracer of intense IR radiation fields in compact regions.
In this letter, we present the first detection of the ortho-H2O 423 − 330 448.001 GHz transition in space1. No previous detections of this transition in Galactic objects have been reported, probably because of the high atmospheric opacity due to the terrestrial water vapor. Only recently, thanks to the sensitivity of the Atacama Large Millimeter/submillimeter Array (ALMA), it became possible to observe this transition in nearby galaxies red-shifted into more accessible frequencies.
We observed the H2O 423 − 330 transition in ESO 320-G030 (IRAS F11506-3851; D = 48 Mpc; 235 pc arcsec-1). This object is an isolated spiral galaxy with a regular velocity field (Bellocchi et al. 2016) and an IR luminosity (log LIR /L⊙ = 11.3) in the lower end of the luminous IR galaxy (LIRGs) range (11 < log LIR /L⊙< 12). It is a starburst object with no evidence of an AGN based on X-ray and mid-IR diagnostics (Pereira-Santaella et al. 2010, 2011), and hosts an extremely obscured nucleus (AV ~ 40 mag) and a massive outflow powered by the presumed nuclear starburst detected in the ionized, neutral atomic, and molecular phases (Arribas et al. 2014; Cazzoli et al. 2014, 2016; Pereira-Santaella et al. 2016, hereafter PS16). In addition, a molecular gas inflow is suggested by the inverse P Cygni profile observed in the far-IR OH absorptions (González-Alfonso et al. 2017). It is an OH megamaser source (Norris et al. 1986), but no 22 GHz H2O maser emission has been detected (Wiggins et al. 2016). This is consistent with the starburst activity of the nucleus of ESO 320-G030 (see Lo 2005).
2. ALMA data reduction
We obtained band 8 ALMA observations of ESO 320-G030 on 2016 November 16 using 42 antennas of the 12-m array as part of the project #2016.1.00263.S. The total on-source integration time was 10.5 min. The baselines ranged from 15 m to 920 m that correspond to a maximum recoverable scale of ~2′′ based on the ALMA Cycle 4 Technical Handbook equations. A three pointing pattern was used to obtain a mosaic with uniform sensitivity over a ~8′′× 8′′ field of view.
In this letter, we only use data from a spectral window centered at 443.0 GHz (1.875 GHz/1270 km s-1 bandwidth and 1.95 MHz/1.3 km s-1 channels) where the redshifted H2O 423 − 330 448.001 GHz transition is detected. The remaining ALMA data will be analyzed in a future paper (Pereira-Santaella et al., in prep.). The data were reduced and calibrated using the ALMA reduction software CASA (v4.7.0; McMullin et al. 2007). For the flux calibration we used J1229+0203 (3C 273) assuming a flux density of 2.815 Jy at 449.6 GHz and a spectral index α = − 0.78 (fν ∝ να). The final data-cube has 300 × 300 pixels of 0.̋05 and 31.2 MHz (20 km s-1) channels. For the cleaning, we used the Briggs weighting with R = 0.5 (Briggs 1995) which provides a beam with a full-width half-maximum (FWHM) of 0.̋26 × 0.̋24 (~60 pc) and a position angle (PA) of 58°. The 1σ sensitivity is ~4.8 mJy beam-1 per channel. We corrected the data-cube for the primary beam pattern of the mosaic.
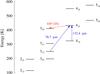 |
Fig. 1 Partial energy level diagram of ortho-H2O. The 423 − 330 448 GHz transition is indicated in red. The 78.7 and 132.4 μm transitions, which populate the 423 level radiatively through the absorption of far-IR photons (see Sect. 4), are marked in blue. |
3. Data analysis
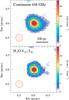 |
Fig. 2 Map of the 448 GHz (rest frequency) continuum (top panel) and zeroth moment of the H2O 423 − 330 emission (bottom panel) of ESO 320-G030. The dashed line contour marks the 3σ level (7 mJy beam-1 and 2.5 Jy km s-1 beam-1, respectively). The solid contour lines indicate the peak × (0.5, 0.9) levels. The red hatched ellipses indicate the beam size (0.̋26 × 0.̋24, PA = 58°). The coordinates are relative to 11 53 11.7192 +39 07 49.105 (J2000). |
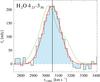 |
Fig. 3 Continuum subtracted profile of the H2O 423 − 330 448 GHz emission in ESO 320-G030 extracted using a circular aperture with |
We detect continuum and line emission only in the central ~200 pc (~1′′). This is consistent with the extent of the 233 GHz (1.3 mm) continuum emission in this object (see PS16). We estimated the continuum level in each pixel from the median flux density in the line-free channels of the spectral window. The resulting continuum map is shown in Fig. 2. The measured total continuum emission in the central 200 pc is 183 ± 4 mJy.
From the continuum subtracted data cube, we extracted the nuclear spectrum using a  aperture (Fig. 3). A line is detected at 443 451 ± 2 MHz. This corresponds to a rest frame frequency of 448 007 ± 4 MHz (using the systemic velocity vradio = 3049 ± 2 km s-1, derived from CO(2−1); see PS16) which agrees with the frequency expected for the ortho-H2O 423 − 330 transition (448001 MHz; Pickett et al. 1998). This line identification is also supported by the detection of strong far-IR and sub-mm water transitions in the Herschel observations of this object (see Sect. 4). We also detect a weaker emission line (3.7 ± 0.6 Jy km s-1) which we tentatively identify as two CH2NH transitions at ~446.8 GHz (Eup = 96 and 117 K; Pickett et al. 1998). Another two CH2NH transitions at 447.9 and 448.1 GHz might contribute to the 423 − 330 flux. However, these have Eup ≥ 280 K so their contributions are likely negligible.
We fitted a Gaussian to the H2O 423 − 330 profile and the result is shown in Fig. 3. We obtained a total flux of 37.0 ± 0.7 Jy km s-1, a velocity of 3045 ± 1 km s-1, and a FWHM of 161 ± 2 km s-1. The 423 − 330 profile is symmetric and it is centered at the systemic velocity. By contrast, the nuclear CO(2−1) profile has a higher FWHM and presents a more complex asymmetric profile (see Figs. 3 and 6 of PS16).
From the 448 GHz continuum and the zeroth moment water emission maps (Fig. 2), we measured the sizes of the emitting regions by fitting a 2D Gaussian. Both the continuum and the water emission are spatially resolved in the ALMA observations with the continuum being more extended. The continuum size (FWHM) is 0.̋38 × 0.̋32, which, deconvolved by the beam size, corresponds to 60 pc × 50 pc at the distance of ESO 320-G030. The size of the water emission is 0.̋30 ± 0.̋02, which is equivalent to a deconvolved FWHM of 40 ± 3 pc. For a uniform-brightness disk, the equivalent radius is 0.8 × FWHM (Sakamoto et al. 2008), that is, R ~ 45 and 30 − 35 pc for the 448 GHz continuum and the H2O line, respectively.
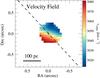 |
Fig. 4 Velocity field of the H2O 423 − 330 emission. The black cross marks the position of the water emission peak (see Fig. 2). The dashed line is the minor kinematic axis derived from the kinematic analysis of the CO(2−1) emission (see PS16). |
We also determined the spatially resolved kinematics of the water emission by fitting a Gaussian profile pixel by pixel. The velocity field of the water line is shown in Fig. 4 for the pixels where the line is detected at >3σ. It shows a clear rotating pattern whose kinematic axes are approximately aligned with the large-scale kinematic axes derived from both the CO(2−1) and Hα emissions (PS16; Bellocchi et al. 2013). The slight angular deviation, ~25°, is similar to that observed in the nuclear CO(2−1) kinematics and might be related to the secondary stellar bar and the elongated molecular structure associated with this bar (PS16). The FWHM line width ranges from ~100–170 km s-1 with the maximum value close to the water emission peak.
Based on the measured continuum fluxes at 448 GHz and 244 GHz (PS16), and on the emitting region size, we estimated the dust temperature and optical depth. First, we subtracted the free-free contribution at these frequencies (~7 mJy; PS16). Then, we solved the gray-body equation assuming 1.5 <β< 1.85 and using a Monte Carlo bootstrapping method to estimate the confidence intervals. We find that Tdust = 25 − 80 K and τ448 GHz = 0.2 − 1.3. These values may be significantly higher in the more compact region sampled by the H2O 448 GHz emission.
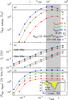 |
Fig. 5 a) Model predictions showing the luminosity of the H2O 448 GHz line as a function of the continuum optical depth at 448 GHz (τ448, lower axis) and at 100 μm (τ100, upper axis), for uniform Tdust = 50, 65, and 80 K. The models assume spherical symmetry with a radius R = 35 pc. The assumed H2O abundance is X(H2O) = 1.5 × 10⁻⁶ (solid lines) and X(H2O) = 6 × 10⁻⁶ (dashed red line). The shadowed regions mark the favored ranges inferred from the ESO 320-G030 observations. b) Comparison between the predicted continua at 448 GHz (squares) and 244 GHz (starred symbols) and the observed values (after subtracting the free-free emission; horizontal stripes). c) Comparison between the predicted absorbing flux of the pumping H2O 423 − 312 line at 79 μm and the observed value (− 920 Jy km s-1 within ± 150 km s-1; horizontal stripe). The insert compares the observed H2O 423 − 312 absorption at 78.7 μm with the predictions of the three models encircled in the three panels. The widths of the horizontal stripes assume uncertainties of ± 10% for LH2O 448, and ± 20% for the continuum flux densities and for the flux of the H2O 79 μm line. |
4. Modeling the H2O 448 GHz emission
Figure 5a shows the model predictions for the H2O 448 GHz luminosity as a function of the continuum optical depth for different dust temperatures (Tdust = 50, 65, and 80 K). The models, based on those reported in GA14, use the observed size (R = 35 pc) and assume a H2O column density of NH2O = 2 × 10¹⁸ × τ100 (solid lines) and 8 × 10¹⁸ × τ100 (dashed red line). These values correspond to H2O abundances relative to H nuclei of XH2O = 1.5 × 10⁻⁶ and 6 × 10⁻⁶, respectively, for a standard gas-to-dust ratio of 100 by mass. The horizontal shaded rectangle indicates the measured value of 3.8 × 10⁴L⊙, and the vertical shaded rectangle highlights the observationally favored τ448 ≳ 0.2, corresponding to τ100 ≳ 8.
At low column densities, LH2O 448 increases sharply with τ448 due to the enhancement of the far-IR radiation field, responsible for the H2O excitation, and to the increase of NH2O. The H2O 448 GHz line is not masing, but usually shows suprathermal excitation (TEX>Tdust) in some shells.
The excitation is dominated in all cases by radiative pumping through the 423 − 312 and 423 − 414 lines at 78.7 and 132.4 μm (Fig. 1). Collisional excitation (included in the models with nH2 = 3 × 104 cm-3 and Tgas = 150 K) has the effect of increasing the population of the low-lying levels from which the radiative pumping cycle works (see GA14) thus still having an overall effect on line fluxes. As τ100 increases above unity, the increase in τ100 only slightly enhances the far-IR radiation field and LH2O 448 flattens. It is only in this regime that LH2O 448 approaches the observed value for high enough Tdust ≳ 65 K or NH2O = 8 × 10¹⁸ × τ100, indicating that the H2O 448 GHz line is an excellent probe of buried galaxy nuclei. At higher τ100, line opacity effects and extinction effects at 448 GHz (for τ448 approaching unity) decrease LH2O 448.
With an adopted H2O abundance of 1.5 × 10⁻⁶ and Tdust ~ 65 K (green lines and symbols), we can approximately match the observed H2O 448 GHz emission (Fig. 5a), and the 448 and 244 GHz continuum emissions (Fig. 5b) for τ448 ≈ 0.3. However, the same observables can also be fitted, for τ448 = 0.4 − 0.6, with a higher XH2O = 6 × 10⁻⁶ and a more moderate Tdust = 50 K (red-dashed lines). We can discriminate between both solutions by noting that the dust opacity conditions required for the H2O 448 GHz line to emit efficiently, τ100> 1, are similar to the conditions required to have strong absorption in the high-lying H2O lines at far-IR wavelengths (e.g., González-Alfonso et al. 2012; Falstad et al. 2017), strongly suggesting that both the 448 GHz emission line and the far-IR absorption lines arise in similar regions. One of the main H2O lines responsible for the pumping of the H2O 448 GHz transition, the 423 − 312 line at ≈79 μm (Fig. 1), was observed with Herschel/PACS (Pilbratt et al. 2010; Poglitsch et al. 2010) within the open time program HerMoLIRG (PI: E. González-Alfonso; OBSID = 1342248549). We compare in Fig. 5c the predicted absorbing flux in this line and the observed value (− 920 Jy km s-1 between − 150 and + 150 km s-1, the observed velocity range of the H2O 448 GHz line at zero intensity; see Fig. 3). While the Tdust ~ 50 K model underpredicts the pumping H2O 79 μm absorption, the Tdust ~ 65 K model better accounts for it, with still some unmatched redshifted absorption (see insert in Fig. 5c). We thus conclude that the H2O 448 GHz line originates in warm regions (Tdust ≳ 60 K).
Our favored models indicate that the luminosity of the nuclear region where the H2O 448 GHz arises is (4 − 6) × 1010 L⊙, that is, ~25% of the total galaxy luminosity. While approximately accounting for the observables reported in this Letter (LH2O 448, allowed τ448 range, f448, f244, and 423 − 312 absorption strength for the observed size), we advance the Herschel detection of very-high-lying H2O absorption lines indicating the presence of an additional warmer component in the nuclear region of ESO 320-G030. The full set of H2O (and OH) lines will be studied in a future work.
5. Conclusions
We detected the ortho-H2O 423 − 330 transition at 448 GHz using ALMA observations of the local spiral LIRG ESO 320-G030. The H2O 448 GHz emission arises from the highly obscured nucleus of this galaxy and is spatially resolved (r ~ 30 pc). The H2O 448 GHz velocity field is compatible with the global regular rotation pattern of the molecular and ionized gas in ESO 320-G030. Our radiative transfer modeling shows that it is mainly excited by the intense far-IR radiation field present in the nucleus of this source. The conditions for the excitation of the 448 GHz water transition indicate that it can probe deeply buried, warm environments both locally and at high redshifts.
Persson et al. (2007) reported a tentative detection of the water isotopologue H O 423 − 330 transition at 489.054 GHz in Orion, although it is blended with a much stronger methanol transition.
Acknowledgments
We thank the anonymous referee for useful comments and suggestions. We thank M. Villar-Martín and S. Motta for useful comments and careful reading of the manuscript. M.P.S. acknowledges support from STFC through grant ST/N000919/1, the John Fell Oxford University Press (OUP) Research Fund and the University of Oxford. E.G.S., A.U., S.G.B., J.M.P., L.C., A.A.H., S.A., S.C., and F.R.V. acknowledge financial support by the Spanish MEC under grants ESP2015-65597-C4-1-R, AYA2012-32295, ESP2015-68694, AYA2013-42227-P and AYA2015-64346-C2-1-P, which is partly funded by the FEDER programme. E.G.A. a Research Associate at the Harvard-Smithsonian CfA and acknowledges support by NASA grant ADAP NNX15AE56G. This paper makes use of the following ALMA data: ADS/JAO.ALMA#2016.1.00263.S. ALMA is a partnership of ESO (representing its member states), NSF (USA) and NINS (Japan), together with NRC (Canada) and NSC and ASIAA (Taiwan) and KASI (Republic of Korea), in cooperation with the Republic of Chile. The Joint ALMA Observatory is operated by ESO, AUI/NRAO and NAOJ.
References
- Arribas, S., Colina, L., Bellocchi, E., Maiolino, R., & Villar-Martín, M. 2014, A&A, 568, A14 [NASA ADS] [CrossRef] [EDP Sciences] [Google Scholar]
- Bellocchi, E., Arribas, S., Colina, L., & Miralles-Caballero, D. 2013, A&A, 557, A59 [NASA ADS] [CrossRef] [EDP Sciences] [Google Scholar]
- Bellocchi, E., Arribas, S., & Colina, L. 2016, A&A, 591, A85 [NASA ADS] [CrossRef] [EDP Sciences] [Google Scholar]
- Briggs, D. S. 1995, Ph.D. Thesis, New Mexico Institute of Mining and Technology [Google Scholar]
- Cazzoli, S., Arribas, S., Colina, L., et al. 2014, A&A, 569, A14 [NASA ADS] [CrossRef] [EDP Sciences] [Google Scholar]
- Cazzoli, S., Arribas, S., Maiolino, R., & Colina, L. 2016, A&A, 590, A125 [NASA ADS] [CrossRef] [EDP Sciences] [Google Scholar]
- Cooke, B., & Elitzur, M. 1985, ApJ, 295, 175 [NASA ADS] [CrossRef] [Google Scholar]
- Daniel, F., & Cernicharo, J. 2013, A&A, 553, A70 [NASA ADS] [CrossRef] [EDP Sciences] [Google Scholar]
- Deguchi, S. 1977, PASJ, 29, 669 [NASA ADS] [Google Scholar]
- Falstad, N., González-Alfonso, E., Aalto, S., & Fischer, J. 2017, A&A, 597, A105 [NASA ADS] [CrossRef] [EDP Sciences] [Google Scholar]
- Flower, D. R., & Pineau Des Forêts, G. 2010, MNRAS, 406, 1745 [NASA ADS] [Google Scholar]
- González-Alfonso, E., Fischer, J., Graciá-Carpio, J., et al. 2012, A&A, 541, A4 [NASA ADS] [CrossRef] [EDP Sciences] [Google Scholar]
- González-Alfonso, E., Fischer, J., Aalto, S., & Falstad, N. 2014, A&A, 567, A91 [NASA ADS] [CrossRef] [EDP Sciences] [Google Scholar]
- González-Alfonso, E., Fischer, J., Spoon, H. W. W., et al. 2017, ApJ, 836, 11 [NASA ADS] [CrossRef] [Google Scholar]
- Gray, M. D., Baudry, A., Richards, A. M. S., et al. 2016, MNRAS, 456, 374 [NASA ADS] [CrossRef] [Google Scholar]
- Hollenbach, D., Kaufman, M. J., Bergin, E. A., & Melnick, G. J. 2009, ApJ, 690, 1497 [CrossRef] [Google Scholar]
- Lo, K. Y. 2005, ARA&A, 43, 625 [NASA ADS] [CrossRef] [Google Scholar]
- McMullin, J. P., Waters, B., Schiebel, D., Young, W., & Golap, K. 2007, in Astronomical Data Analysis Software and Systems XVI, eds. R. A. Shaw, F. Hill, & D. J. Bell, ASP Conf. Ser., 376, 127 [Google Scholar]
- Neufeld, D. A., & Melnick, G. J. 1991, ApJ, 368, 215 [NASA ADS] [CrossRef] [Google Scholar]
- Norris, R. P., Whiteoak, J. B., Gardner, F. F., Allen, D. A., & Roche, P. F. 1986, MNRAS, 221, 51P [NASA ADS] [CrossRef] [Google Scholar]
- Pereira-Santaella, M., Alonso-Herrero, A., Rieke, G. H., et al. 2010, ApJS, 188, 447 [NASA ADS] [CrossRef] [Google Scholar]
- Pereira-Santaella, M., Alonso-Herrero, A., Santos-Lleo, M., et al. 2011, A&A, 535, A93 [NASA ADS] [CrossRef] [EDP Sciences] [Google Scholar]
- Pereira-Santaella, M., Colina, L., García-Burillo, S., et al. 2016, A&A, 594, A81 [NASA ADS] [CrossRef] [EDP Sciences] [Google Scholar]
- Persson, C. M., Olofsson, A. O. H., Koning, N., et al. 2007, A&A, 476, 807 [NASA ADS] [CrossRef] [EDP Sciences] [Google Scholar]
- Pickett, H. M., Poynter, R. L., Cohen, E. A., et al. 1998, J. Quant. Spectr. Rad. Transf., 60, 883 [NASA ADS] [CrossRef] [Google Scholar]
- Pilbratt, G. L., Riedinger, J. R., Passvogel, T., et al. 2010, A&A, 518, L1 [CrossRef] [EDP Sciences] [Google Scholar]
- Poglitsch, A., Waelkens, C., Geis, N., et al. 2010, A&A, 518, L2 [NASA ADS] [CrossRef] [EDP Sciences] [Google Scholar]
- Sakamoto, K., Wang, J., Wiedner, M. C., et al. 2008, ApJ, 684, 957 [NASA ADS] [CrossRef] [Google Scholar]
- van Dishoeck, E. F., Herbst, E., & Neufeld, D. A. 2013, Chem. Rev., 113, 9043 [NASA ADS] [CrossRef] [PubMed] [Google Scholar]
- Wiggins, B. K., Migenes, V., & Smidt, J. M. 2016, ApJ, 816, 55 [NASA ADS] [CrossRef] [Google Scholar]
- Yates, J. A., Field, D., & Gray, M. D. 1997, MNRAS, 285, 303 [NASA ADS] [Google Scholar]
All Figures
|
Fig. 1 Partial energy level diagram of ortho-H2O. The 423 − 330 448 GHz transition is indicated in red. The 78.7 and 132.4 μm transitions, which populate the 423 level radiatively through the absorption of far-IR photons (see Sect. 4), are marked in blue. |
| In the text | |
|
Fig. 2 Map of the 448 GHz (rest frequency) continuum (top panel) and zeroth moment of the H2O 423 − 330 emission (bottom panel) of ESO 320-G030. The dashed line contour marks the 3σ level (7 mJy beam-1 and 2.5 Jy km s-1 beam-1, respectively). The solid contour lines indicate the peak × (0.5, 0.9) levels. The red hatched ellipses indicate the beam size (0.̋26 × 0.̋24, PA = 58°). The coordinates are relative to 11 53 11.7192 +39 07 49.105 (J2000). |
| In the text | |
|
Fig. 3 Continuum subtracted profile of the H2O 423 − 330 448 GHz emission in ESO 320-G030 extracted using a circular aperture with |
| In the text | |
|
Fig. 4 Velocity field of the H2O 423 − 330 emission. The black cross marks the position of the water emission peak (see Fig. 2). The dashed line is the minor kinematic axis derived from the kinematic analysis of the CO(2−1) emission (see PS16). |
| In the text | |
|
Fig. 5 a) Model predictions showing the luminosity of the H2O 448 GHz line as a function of the continuum optical depth at 448 GHz (τ448, lower axis) and at 100 μm (τ100, upper axis), for uniform Tdust = 50, 65, and 80 K. The models assume spherical symmetry with a radius R = 35 pc. The assumed H2O abundance is X(H2O) = 1.5 × 10⁻⁶ (solid lines) and X(H2O) = 6 × 10⁻⁶ (dashed red line). The shadowed regions mark the favored ranges inferred from the ESO 320-G030 observations. b) Comparison between the predicted continua at 448 GHz (squares) and 244 GHz (starred symbols) and the observed values (after subtracting the free-free emission; horizontal stripes). c) Comparison between the predicted absorbing flux of the pumping H2O 423 − 312 line at 79 μm and the observed value (− 920 Jy km s-1 within ± 150 km s-1; horizontal stripe). The insert compares the observed H2O 423 − 312 absorption at 78.7 μm with the predictions of the three models encircled in the three panels. The widths of the horizontal stripes assume uncertainties of ± 10% for LH2O 448, and ± 20% for the continuum flux densities and for the flux of the H2O 79 μm line. |
| In the text | |
Current usage metrics show cumulative count of Article Views (full-text article views including HTML views, PDF and ePub downloads, according to the available data) and Abstracts Views on Vision4Press platform.
Data correspond to usage on the plateform after 2015. The current usage metrics is available 48-96 hours after online publication and is updated daily on week days.
Initial download of the metrics may take a while.