Fig. 3
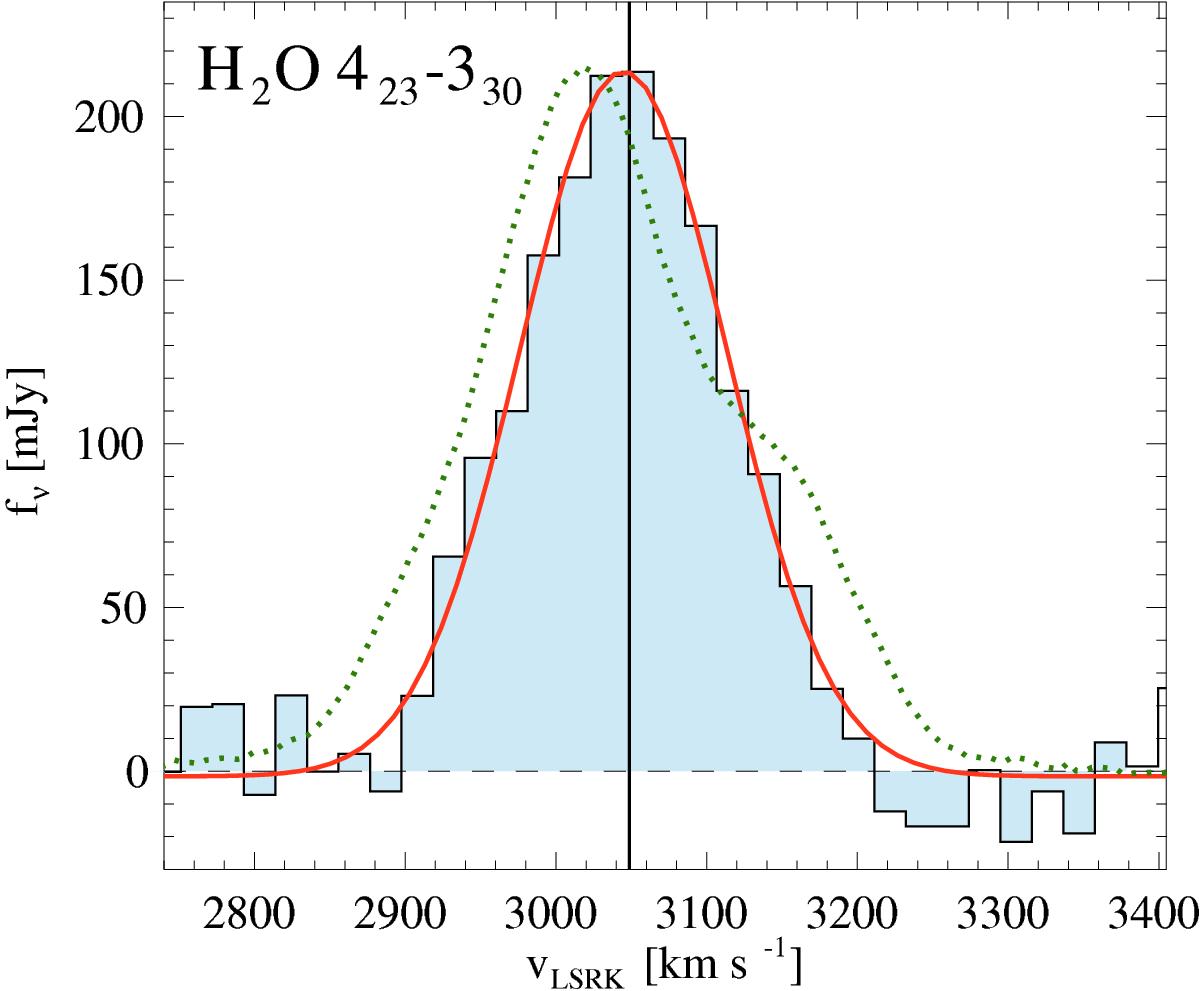
Continuum subtracted profile of the H2O 423 − 330 448 GHz emission in ESO 320-G030 extracted using a circular aperture with ![]() centered at the nucleus (see Fig. 2). The dotted green line is the normalized CO(2−1) profile extracted from the same region. The black vertical line indicates the systemic velocity derived from the CO(2−1) global kinematic model (PS16). The red solid line is the best Gaussian fit to the water profile (see Sect. 3).
centered at the nucleus (see Fig. 2). The dotted green line is the normalized CO(2−1) profile extracted from the same region. The black vertical line indicates the systemic velocity derived from the CO(2−1) global kinematic model (PS16). The red solid line is the best Gaussian fit to the water profile (see Sect. 3).
Current usage metrics show cumulative count of Article Views (full-text article views including HTML views, PDF and ePub downloads, according to the available data) and Abstracts Views on Vision4Press platform.
Data correspond to usage on the plateform after 2015. The current usage metrics is available 48-96 hours after online publication and is updated daily on week days.
Initial download of the metrics may take a while.