Fig. 5
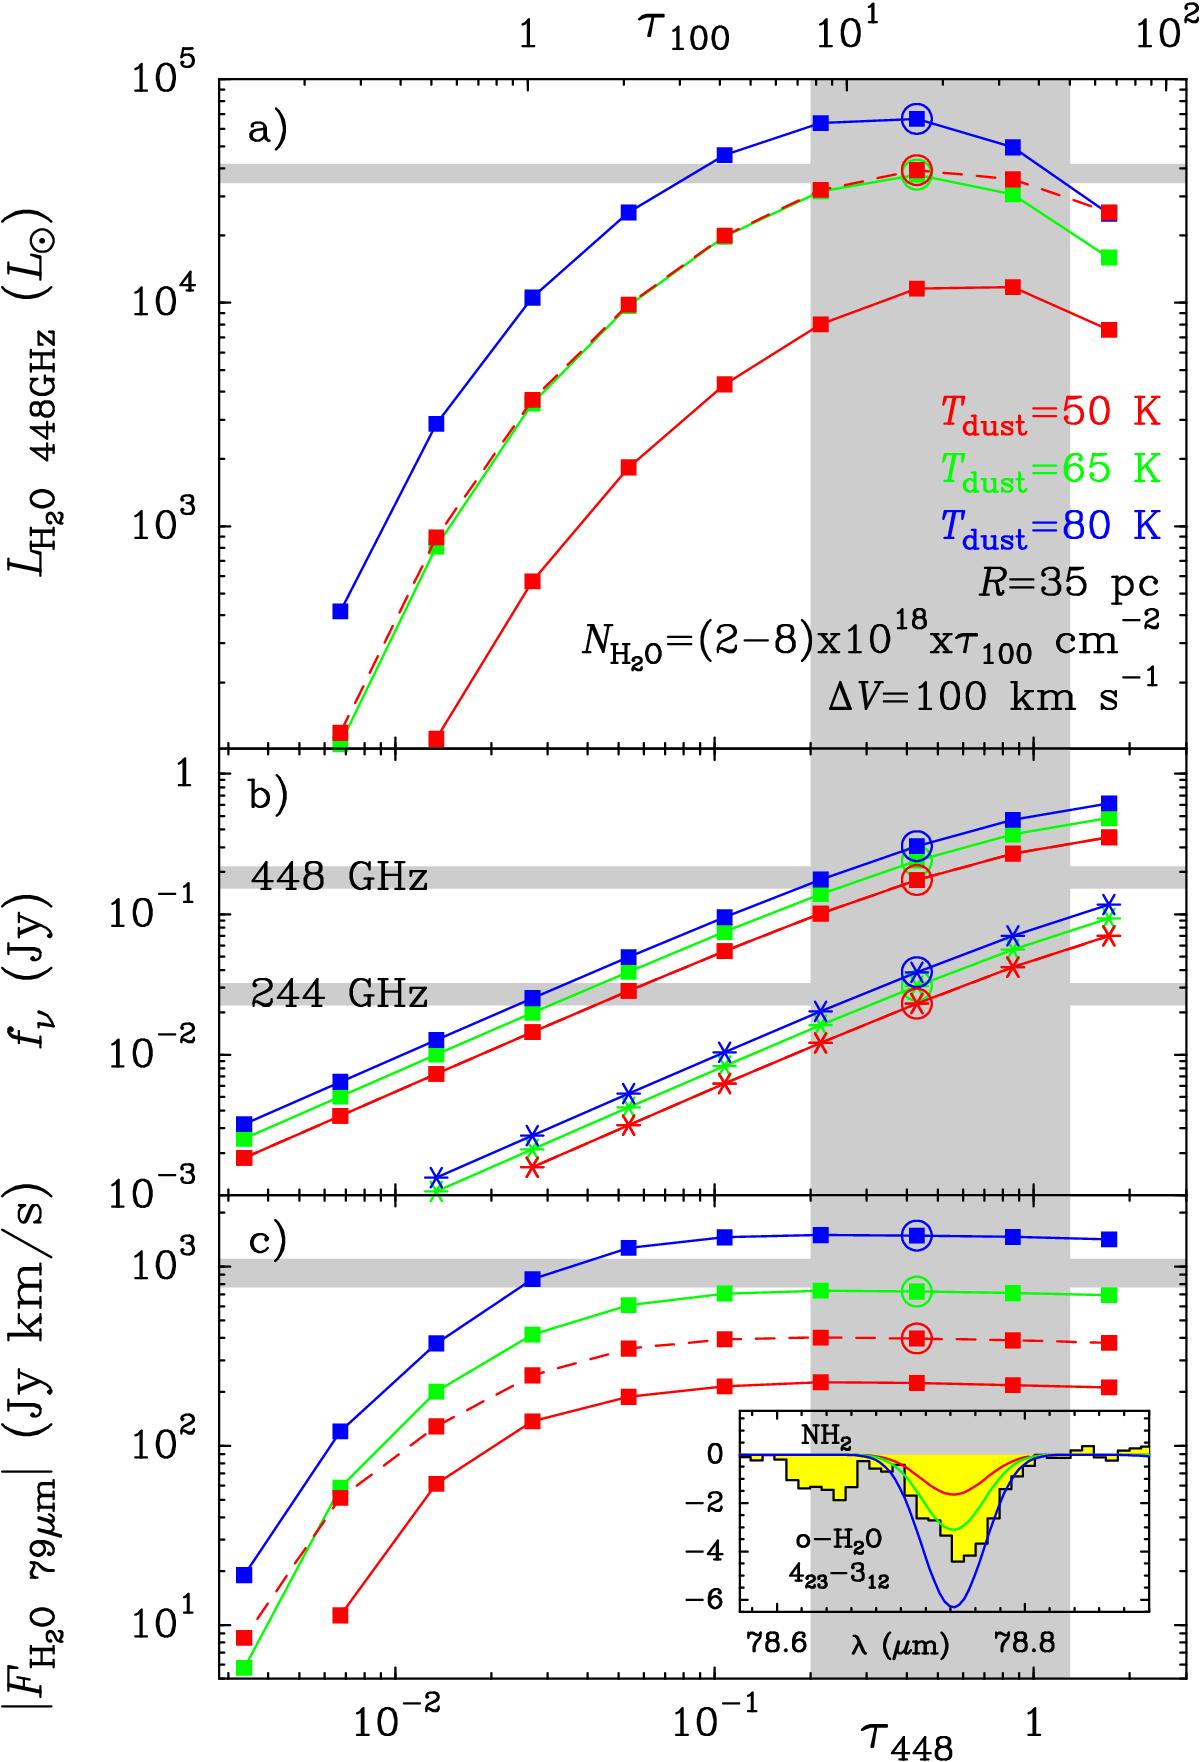
a) Model predictions showing the luminosity of the H2O 448 GHz line as a function of the continuum optical depth at 448 GHz (τ448, lower axis) and at 100 μm (τ100, upper axis), for uniform Tdust = 50, 65, and 80 K. The models assume spherical symmetry with a radius R = 35 pc. The assumed H2O abundance is X(H2O) = 1.5 × 10⁻⁶ (solid lines) and X(H2O) = 6 × 10⁻⁶ (dashed red line). The shadowed regions mark the favored ranges inferred from the ESO 320-G030 observations. b) Comparison between the predicted continua at 448 GHz (squares) and 244 GHz (starred symbols) and the observed values (after subtracting the free-free emission; horizontal stripes). c) Comparison between the predicted absorbing flux of the pumping H2O 423 − 312 line at 79 μm and the observed value (− 920 Jy km s-1 within ± 150 km s-1; horizontal stripe). The insert compares the observed H2O 423 − 312 absorption at 78.7 μm with the predictions of the three models encircled in the three panels. The widths of the horizontal stripes assume uncertainties of ± 10% for LH2O 448, and ± 20% for the continuum flux densities and for the flux of the H2O 79 μm line.
Current usage metrics show cumulative count of Article Views (full-text article views including HTML views, PDF and ePub downloads, according to the available data) and Abstracts Views on Vision4Press platform.
Data correspond to usage on the plateform after 2015. The current usage metrics is available 48-96 hours after online publication and is updated daily on week days.
Initial download of the metrics may take a while.