Fig. 2
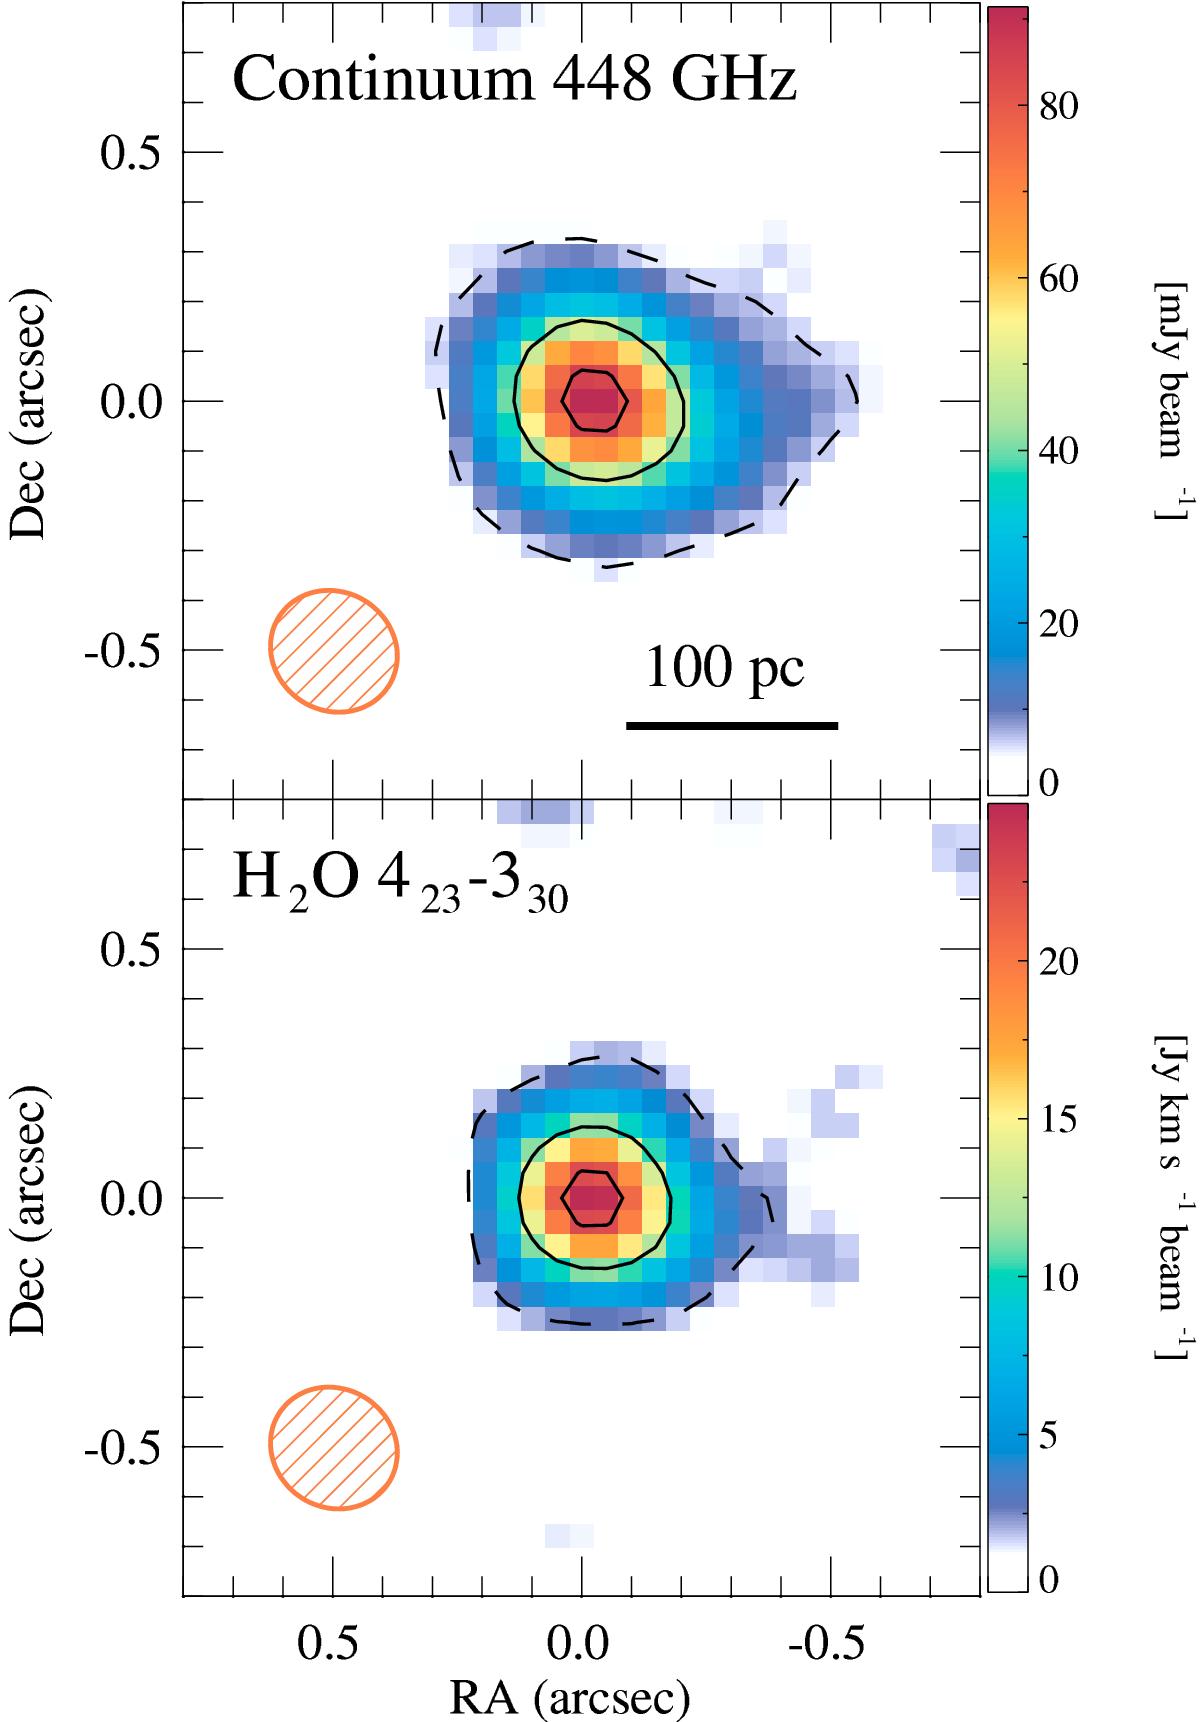
Map of the 448 GHz (rest frequency) continuum (top panel) and zeroth moment of the H2O 423 − 330 emission (bottom panel) of ESO 320-G030. The dashed line contour marks the 3σ level (7 mJy beam-1 and 2.5 Jy km s-1 beam-1, respectively). The solid contour lines indicate the peak × (0.5, 0.9) levels. The red hatched ellipses indicate the beam size (0.̋26 × 0.̋24, PA = 58°). The coordinates are relative to 11 53 11.7192 +39 07 49.105 (J2000).
Current usage metrics show cumulative count of Article Views (full-text article views including HTML views, PDF and ePub downloads, according to the available data) and Abstracts Views on Vision4Press platform.
Data correspond to usage on the plateform after 2015. The current usage metrics is available 48-96 hours after online publication and is updated daily on week days.
Initial download of the metrics may take a while.