| Issue |
A&A
Volume 535, November 2011
|
|
|---|---|---|
| Article Number | A113 | |
| Number of page(s) | 14 | |
| Section | Extragalactic astronomy | |
| DOI | https://doi.org/10.1051/0004-6361/201116444 | |
| Published online | 21 November 2011 | |
Suzaku broad-band observations of the Seyfert 1 galaxies Mrk 509 and Mrk 841
1
LUTH, Observatoire de Paris, CNRS, Université Paris Diderot, 5 place Jules Janssen, 92190 Meudon, France
e-mail: matteo.cerruti@obspm.fr
2
School of Physics and Astronomy, University of Southampton, Highfield, Southampton SO17 1BJ, UK
3
SRON, Netherlands Institute for Space Research, Sorbonnelaan 2, 3584 CA Utrecht, The Netherlands
4
MIT, Kavli Institute for Astrophysics and Space Research, 77 Massachusetts Avenue, NE80-6011, Cambridge, MA, 02139, USA
5
Dipartimento di Fisica, Università degli Studi Roma Tre, via della Vasca Navale 84, 00146 Roma, Italy
6
APC, Université de Paris 7 Denis Diderot, 75205 Paris Cedex, France
7
UJF-Grenoble 1/CNRS-INSU, Institut de Planétologie et d’Astrophysique de Grenoble (IPAG), UMR 5274, 38041 Grenoble, France
Received: 5 January 2011
Accepted: 22 August 2011
Context. Markarian 509 and Markarian 841 are two bright Seyfert 1 galaxies with X-ray spectra characterised by a strong soft excess and a variable Fe Kα line, as shown by several X-ray observatories in the past.
Aims. We report an analysis and modelling of new Suzaku observations of these sources, taken between April and November, 2006, for Mrk 509, and between January and July, 2007, for Mrk 841, for a total exposure time of ≈ 100 ks each. Data from XIS and HXD/PIN instruments, going from 0.5 to 60 keV, represent the highest spectral resolution simultaneous broad-band X-ray spectrum for these objects, and provide the strongest constraints yet on the origin of the soft excess emission.
Methods. We fitted the broad-band spectrum of both sources with a double Comptonisation model, adding neutral reflection from distant material and a two-phase warm absorber. We then studied the two competing models developed to explain the soft excess in terms of atomic processes: a blurred ionised disc reflection and an ionised absorption by a high velocity material.
Results. When fitting the data in the 3–10 keV range with a power law spectrum, and extrapolating this result to low energies, a soft excess is clearly observed below 2 keV, although its strength is weak compared to previous observations of both sources. A moderate hard excess is seen at energies higher than 10 keV, together with a neutral Fe Kα narrow emission line at E0 ≈ 6.4 keV and a broad Fe emission line. For Mrk 509, the broad Fe emission line is required in all the three physical models to ensure a good fit to the data: this finding suggests that the blurred reflection model correctly describes the soft excess, but that it underestimates the broad Fe emission line. For the smeared absorption model, this suggests instead that the continuum spectrum absorbed by the outflowing gas should indeed contain a reflected component. For Mrk 841, all three models that we tested provide a good fit to the data, and we cannot rule out any of them. A broad emission line is required in the double Comptonisation and smeared absorption models, while the blurred reflection model consistently fits the broad-band spectrum, without adding any extra emission-line component.
Key words: galaxies: Seyfert / X-rays: galaxies / galaxies: individuals: Mrk 509 / galaxies: individuals: Mrk 841 / galaxies: individuals: PKS1502+106
© ESO, 2011
1. Introduction
The origin of the soft X-ray excess emission is still nowadays, about three decades after the discovery (Pravdo et al. 1981; Arnaud et al. 1985), one of the major open questions in AGN (active galactic nuclei) research (e.g. Turner & Miller 2009). This component appears as a featureless excess of emission above the low energy extrapolation of the 2–10 keV best-fit power law. Historically associated with the high energy tail of the accretion-disc black-body radiation, many authors (Czerny et al. 2003; Gierliński & Done 2004, hereafter GD04; Piconcelli et al. 2005; Crummy et al. 2006, hereafter C06) have shown that modelling with a thermal continuum infers a characteristic “temperature” higher than expectations (Shakura & Sunyaev 1976) that remains remarkably constant across a range of AGN despite a wide spread in black hole mass and AGN luminosity. Moreover, in bright and variable AGN the soft excess does not follow the expected black-body luminosity-temperature relation (Ponti et al. 2006). Various studies have shown that the ratio of the soft excess, at 0.5 keV, to the extrapolation of the high-energy power-law emission has a very small scatter (Piconcelli et al. 2005; Miniutti et al. 2009), which is very different from what is observed in galactic black holes in the bright soft state, dominated by the disc black-body emission (e.g. Done et al. 2007). These findings triggered the search for a different origin of the soft excess. The first idea investigated was the Comptonisation that might occur in the upper layer of the accretion disc (Czerny et al. 2003; GD04; Sobolewska & Done 2007). This model may explain the featureless shape of the soft excess and its high temperature; the feedback between the coronal disc irradiation and the disc skin may provide a mechanism to stabilize both the soft excess temperature and the ratio relative to the power-law emission. On the other hand, the observed constancy of the soft excess temperature seems to suggest a nature tied to atomic processes. Two possible alternatives are reflection and absorption. If the upper layer of the accretion disc is ionized, the disc Compton reflection component will contain many X-ray lines (Ross & Fabian 2005) that will be broadened by the relativistic motion of the material on the surface of the accretion disc, forming a featureless continuum (C06). Ionized absorption processes can also imprint their main features in the soft X-ray band. If these absorbers are moving relativistically (for example, in the form of a disc wind) they may, as well, produce a featureless curved continuum and reproduce the soft excess. Nevertheless, numerical simulations indicate that, to reproduce the excess, the velocities of such a wind have to be extremely high (Schurch & Done 2008), suggesting that the flow has to be clumpy and/or only partially covering the source, or associated with a magnetically driven jet.
These different models are degenerate in the 0.5–10 keV band but still predict different amounts of hard X-ray emission. In addition, they predict different variability behaviours in the soft and hard energy band and, thus, the measurement of the high energy flux may help us to determine the physical origin of the soft excess. To this aim, with Suzaku we observed Markarian 509 (Mrk 509), the brightest Seyfert 1 galaxy in the hard X-ray sky (17–60 keV) with an important soft excess but no strong warm absorber component (Sazonov et al. 2007), and Markarian 841 (Mrk 841), one of the first AGN in which a soft excess has been discovered (Arnaud et al. 1985). Information about the four Mrk 509 observations and the two observations of Mrk 841 are given in Table 1.
Suzaku observation log.
Located at a redshift of z = 0.0344 (Fisher et al. 1995), Mrk 509 was first observed at X-ray energies by Ariel V (Cooke et al. 1978), and then studied by several X-rays telescopes. Using HEAO-1, Singh et al. (1985) detected its soft excess for the first time, a detection that was later confirmed by EXOSAT (Morini et al. 1987), in addition to the detection of a Fe Kα emission line. Using Ginga, Singh et al. (1990) revealed a hardening of the power law at energies greater than 10 keV. BeppoSAX observations (Perola et al. 2000) showed a power-law cut-off at 70 keV and revealed information about the warm absorber (Dadina et al. 2005), which since has been studied in depth by Smith et al. (2007) and Detmers et al. (2010), with XMM-Newton/RGS data. Ponti et al. (2009) presented the most complete study to date of the Fe K complex, using XMM-Newton data and the same Suzaku observations we present here. For this reason, we focus on the broad-band spectrum only, and no further analysis of emission lines will be done. Recently, Kaastra et al. (2011) carried out a multi-wavelength campaign of this source, using data from seven different satellites and observatories (from infra-red to hard X-rays, see Kaastra et al. 2011, and references therein).
The soft excess of the bright Seyfert 1 galaxy Mrk 841 (z = 0.0365) was first detected by EXOSAT (Arnaud et al. 1985). As for Mrk 509, Mrk 841 has been extensively studied. George et al. (1993) provided the first evidence of Fe Kα emission-line detection and broad-band variability. In a sample of 24 type 1 AGN observed by ASCA (Reynolds 1997), Mrk 841 belongs to sources for which a ”statistically significant soft excess” is observed. More recent observations have been performed by BeppoSAX (Bianchi et al. 2001) and XMM-Newton (Petrucci et al. 2007, hereafter P07; Longinotti et al. 2010): P07 studied in detail the Fe K complex variability, while Longinotti et al., using XMM-Newton/RGS data, investigated the warm absorber structure. Even though the goal of this paper is to investigate the broad-band X-ray spectrum of this object, in Sect. 3.4 we also discuss the Fe Kα narrow emission-line detection.
The paper is organised as follows. In Sect. 2, we detail the Suzaku data reduction and present the serendipitous detection of the blazar PKS 1502+106. In Sect. 3.1, we study the light curves of Mrk 509 and Mrk 841; in Sect. 3.2, we analyse the soft X-ray excess in both sources and in Sect. 3.3 we discuss their hard excess; in Sect. 3.4, we concentrate on the Fe Kα narrow emission line detection in Mrk 841; Sect. 3.5 is dedicated to the modelling of the broad-band (XIS and PIN) Suzaku summed spectra in a double Comptonisation scenario, discussing the detection of a warm absorber in both sources; in Sects. 3.6 and 3.7, we fit the broad-band summed spectra with a blurred ionised reflection model and a smeared ionised absorption one. The discussion and the conclusions are given in Sect. 4.
2. Data reduction
Suzaku X-ray telescope carries two main instruments: the XIS (Koyama et al. 2007), a soft (0.2–12 keV) X-ray imaging spectrometer, and the HXD (Takahashi et al. 2007), a hard X-ray detector that covers the higher energy domain (10–500 keV).
The XIS instrument is composed of four CCD cameras: three of them (XIS0,2,3) are front-illuminated (FI), while one (XIS1) is back-illuminated (BI). Owing to an instrumental failure, XIS2 is unavailable for observations performed after November 9, 2006: for uniformity between observations, we did not consider data from this instrument. Event files from version 2.0.6.13 of the Suzaku pipeline processing were used, with standard screening criteria, and data were then reduced using version 6.7 of HEASoft1. Spectra and light curves were extracted using XSelect, version 2.4a. The chosen extracting region is large enough (r > 150 arcsec) to avoid calibration problems (as suggested in the Suzaku ABC Guide2). The background was extracted from a region (circular or annular, according to the aim point) in the same image, respecting the same geometrical constraints as for the source. Response matrices and ancillary response files were generated for each XIS using xisrmfgen (version 2009-02-28) and xissimarfgen (version 2009-01-08) tools. The two XIS/FI spectra were added using mathpha (version 4.1.0.) with the “POISS-3” error propagation method, which represents a mean value between the two extreme error values “POISS-1” and “POISS-2” (see mathpha user’s guide3 and references therein). Response files were added using addrmf, version 1.21, and addarf, version 1.2.6. A single XIS lightcurve was obtained by summing up the three XIS0,1 and 3 background-subtracted lightcurves, using XRonos, version 5.22.
The HXD instrument is composed of two detectors: PIN (positive intrinsic negative diodes; 10–60 keV) and GSO/BGO (gadolinium silicate/bismuth germanate crystals; 50–500 keV). In this paper, we present data from PIN only, since no significant signal was detected from GSO. For HXD/PIN, non-X-ray instrumental background (NXB) and response matrices provided by the HXD instrument team were used. An additional component for the CXB (cosmic X-ray background) (Boldt & Leiter 1987) was included and added to the NXB using mathpha. Spectra were corrected for the dead time, using hxddtcor, version 1.50, and the background exposure time was increased by a factor of ten, following the Suzaku ABC Guide. For Mrk 841 observations, PKS 1502+106 (see Sect. 2.1) is in the PIN field of view, and its flux, as extrapolated from XIS observations, was added with mathpha to the background.
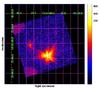 |
Fig. 1 Suzaku/XIS0 image of Mrk 841 (first observation): the brightest source is Mrk 841 and the fainter one is consistent with PKS 1502+106; the two calibration spots are visible in the top and bottom left corners. |
Each spectrum was rebinned according to the following procedure: for XIS, we checked the true energy resolution of each instrument, extracting the spectrum of the calibration spots in the CCD camera (see Fig. 1), and measuring the energy and the FWHM (full width at half maximum) of the Mn Kα line; with these values, and using Eq. (1) given in Koyama et al. (2007), we get the true XIS energy resolution as a function of energy; for PIN, we used energy resolution values given in Takahashi et al. (2007); we then rebinned the data to have five bins for each energy resolution element. To use a χ2 minimization algorithm, we imposed a minimum number of counts per bin: this second rebinning does affect the first and the last bins of the spectra only, while in the other channels the condition of five bins per resolution element is always dominant. We chose a minimum of 30 (for Mrk 841) and 50 (for Mrk 509) counts per bin, leading to a similar number of bins for both sources. We considered XIS/FI data in the energy band 0.6–10 keV, and XIS1 data in the range 0.5–8.5 keV; XIS data comprised between 1.62 and 1.82 keV were ignored owing to a known calibration problem around the Si K edge4; PIN data below 15 keV were ignored, and the last PIN significant bin is at ≈33 keV for Mrk 841 and ≈38 keV for Mrk 509.
We also studied the summed spectra of the sources, adding XIS and PIN data from different observations. For Mrk 509, the first observation was not included in the summed spectrum, because it had been performed using the HXD aim point, instead of the XIS aim point used for the three other observations (see Table 1). Source and background spectral files from different observations were added using the same procedure described above for the sum of XIS/FI spectra.
To take into account the relative normalization between different instruments during the fitting, models for each instrument data were multiplied by a constant, as indicated by Maeda et al. (2008)5. Spectral fitting was performed with XSpec, version 12.5.1. Parameter errors in both text and tables are given at the 90% confidence level.
We assume a flat cosmology with H0 = 70 km s-1 Mpc-1 and ΩΛ = 0.73.
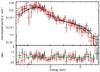 |
Fig. 2 PKS 1502+106 spectrum (observer frame) as seen by Suzaku/XIS/FI (black) and XIS1 (red). Data were fitted with a power-law model absorbed by galactic material (see Sect. 2.1): data-to-model ratio is shown in the bottom plot. |
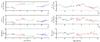 |
Fig. 3 Mrk 509 (left) and Mrk 841 (right) light curves. Different observations are shown in different colours (one-black, two-red, three-green, and four-blue). From top to bottom: 0.5–3 keV light curve (in units of counts per second); 3–10 keV light curve and hardness ratio (3–10/0.5–3). Gap between observations is arbitrary. |
2.1. Contaminating source: PKS 1502+106
Figure 1 shows the Suzaku/XIS0 image of the first observation of Mrk 841. The brightest source at the HXD aim point position is Mrk 841, while a second bright source appears in the field of view (at a distance of about 7′ from Mrk 841), that is coincident with PKS 1502+106. This source, situated at z = 1.839 (Smith et al. 1977), was classified as a blazar by Abdo et al. (2010). We extracted the spectrum of this source following the same procedure discussed in the previous section: Fig. 2 shows the XIS spectrum of PKS 1502+106. We fitted the spectrum with a simple power law absorbed by Galactic material (model wabs*powerlaw in Xspec, with NH = 2.36 × 1020 cm-2, Dickey & Lockman 1990). The best-fit photon index is Γ = 1.32 ± 0.08 ( ). The source flux in the 0.5–2 keV and 2–10 keV bands is
  and
and  , respectively. The 2–10 keV luminosity is
  . In the past, PKS 1502+106 was observed to have a photon index Γ varying between 1.4 and 1.9 and a 2–10 keV flux in the range 4.9 − 6.54 × 10⁻¹³ erg cm-2 s-1 (George et al. 1994; Akiyama et al. 2003; Watanabe et al. 2004). An outburst was observed by Fermi and Swift (Abdo et al. 2010), with F0.3 − 10 keV = 2.18 × 10⁻¹² erg cm-2 s-1, and Γ = 1.54. Our best-fit model parameters suggest that Suzaku detected PKS 1502+106 during quite a high state, but not during an outburst (its light curve does not show any significant variability). However, the power-law index is consistent with a low state of the source. This source falls within the PIN field of view, thus it has a contribution to the PIN data. The extrapolated flux in the 12–60 keV band is 2.5 × 10⁻¹² erg cm-2 s-1. This component was included in the PIN background.
During the second observation, PKS 1502+106 falls off the CCD image of Mrk 841, but it remains in the PIN field of view: we subtracted from PIN data the same spectrum evaluated for the first observation.
No bright X-ray sources are observed in the XIS field of view of Mrk 509.
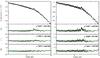 |
Fig. 4 XIS data between 3 and 10 keV of the sum of Mrk 509 (left) and Mrk 841 (right) observations: data are first fitted with a power law (ignoring the 6–7 keV energy band, upper panel and first ratio plot); then two narrow Gaussian lines (for the Fe Kα and Kβ emission lines, see Sect. 3.2) are added to the fit (second ratio plot); a broad (σ > 0) Fe emission line is finally considered (third and last ratio plot). Only FI data are shown, as they have the highest resolution around the Fe Kα emission line, but the fit was performed using both FI and XIS1 data. The energy on the abscissa is in the observer frame. The data were rebinned for clarity purposes. |
3. Data analysis
3.1. Light curves
XIS light curves of Mrk 509 and Mrk 841 are shown in Fig. 3. Owing to the orbit of Suzaku, the targets, periodically occulted by Earth, cannot be observed continuously and light curves are composed by several blocks of a few kiloseconds each. As no significant variability appears on this timescale, we decided to rebin the data to one bin per observation window. Light curves were extracted for two energy bands, a soft (0.5–3 keV) one and a hard (3–10 keV) one, and a count-rate hardness ratio (h = hard/soft) was evaluated. The PIN light curves are always compatible with a constant flux.
During the first observation of Mrk 509, the source was in the HXD aim point, which provides a smaller (≈10%) effective area and a lower number of counts per second than for the XIS aim point (which was used for the three other observations). For this reason, the lightcurve of observation (obs.) 1 had to be corrected for this systematic error when compared to the other observations. Taking into account this effect, Mrk 509 displays a variability of ≈25% between the four observations in the soft energy band, but within a single observation the flux variation is only 11–14%, reaching 20% only during the last observation. In the hard energy domain, the variability is ≈ 16% between observations and ≈ 15% (but 20% during the fourth observation) on a 105 s timescale.
The value of the hardness ratio during obs. 1, 2, and 4 is compatible with a constant (the mean values are  ,
,  and
and  , respectively). During the third observation h has instead a lower value (
 ). Miyazawa et al. (2009) analysed the temporal and spectral variability of a sample of 36 AGN observed by Suzaku: the four observations of Mrk 509 we present here, were studied by these authors, and a correlation plot between the 0.5–2 keV and the 2–10 keV light curves is shown (see Fig. 3 in their paper). They found a correlation between the fluxes in the soft and the hard energy band, consistent with the nearly constancy of the hardness ratio, though the lower value of h during the third observation increases the dispersion in the correlation plot.
The two Mrk 841 observations have an almost equal mean flux value, but the source shows variability on timescales of 105 s (26% and 46% in the soft X-ray domain, and 32% and 42% in the hard X-ray domain, for the two observations respectively). For this source, too, the hardness ratio is nearly constant, and we measure a mean value of  .
.
Given the low variability observed in Mrk 509 and Mrk 841 light curves, and to improve the signal-to-noise ratio, we study in the following the summed spectra as well as individual observations for phenomenological models.
3.2. Soft excess
We start the analysis considering the XIS 3–10 keV energy band. We model the data using a power law plus two narrow Gaussian functions (model zgauss in XSpec, assuming σ = 0) for the Fe Kα and Kβ narrow emission lines (assuming EKβ = 7.06 keV and imposing its normalization factor CKβ equal to 0.15 CKα, Palmeri et al. 2003). An excess of emission is clearly observed around 6.4 keV (see Fig. 4) and adding a broad emission line significantly improves the fit (F-test probability equal to 4 × 10-21 and 7 × 10⁻⁷ for the summed Mrk 509 and Mrk 841 data set, respectively). Table 2 shows the best-fit results. The detection of a Fe broad emission line in Suzaku observations is consistent with the results showed in the FERO (Finding Extreme Relativistic Objects) survey (de La Calle Pérez et al. 2010), which studied, using XMM-Newton data, the relativistic Fe Kα emission lines in Seyfert 1 galaxies, including Mrk 509.
Ponti et al. (2009) studied in detail the Fe K complex in Mrk 509, using the same Suzaku observations presented here: in particular, they showed that a broad Fe line (with parameters consistent with our values given in Table 2) represents the best-fitting model, compared to a possible blend of narrow Fe lines.
For Mrk 841, we performed the same analysis as Ponti et al. (2009), testing the possibility that a blending of H-like and He-like lines of Fe might be responsible for the broad line observed: however, this model (two narrow Gaussian lines, with energies fixed to 6.67 and 6.97 keV, plus the 6.4 and 7.06 Fe lines, as described above) does not significantly improve the goodness of the fit (F-test probability equal to 0.1 for the summed data-set).
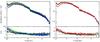 |
Fig. 5 Mrk 509 (left) and Mrk 841 (right) soft excess: data from 3 to 10 keV are fitted with a power law plus three Gaussian emission lines (see Table 2), and the model is then extrapolated to lower energies. Galactic absorption is taken into account. Only XIS1 data are shown, as they extend to 0.5 keV, but the analysis was performed using both FI and XIS1 data; the colour code for the different observations is as in Fig. 3. The energy on the abscissa is in the observer frame. The data were rebinned for clarity purposes. |
Best-fit parameter values for the model powerlaw + zgauss + zgauss + zgauss, considering XIS data between 3 and 10 keV.
For Mrk 509, we observe variability in the 3–10 keV flux (comprised between 3.39 and 3.78 × 10⁻¹¹ erg cm-2 s-1), while the slope is consistent, within the errors, with a constant (the two extreme values are  and
and  for the second and the third observation, respectively). The best-fit results of the two Mrk 841 observations are quite similar (Γ = 1.75–1.77 and F = 1.10–1.11 × 10⁻¹¹ erg cm-2 s-1), as discussed in the previous section.
It is useful to compare these results to past observations. Using BeppoSAX, De Rosa et al. (2004) detected Mrk 509 in two quite different states, at F2 − 10 keV = 2.7 and 5.7 × 10⁻¹¹ erg cm-2 s-1 with Γ = 1.80–1.59 (for comparison the 2–10 keV flux of Mrk 509 during the four Suzaku observations varies between 4.3 and 4.8 × 10⁻¹¹ erg cm-2 s-1, setting these observations in an intermediate state). XMM-Newton (Smith et al. 2007) observed the source in a even lower state at F0.5 − 10 keV = 2.6 × 10⁻¹¹ erg cm-2 s-1.
Mrk 841 was observed by XMM-Newton (see P07) at F3 − 10 keV = 0.8–1.3 × 10⁻¹¹erg cm-2 s-1 with Γ = 1.30–1.95. Compared to these values, the source was in an intermediate state during Suzaku observations; in the past, Mrk 841 was seen in a quite low state by Pounds et al. (1994) (simultaneous Ginga and ROSAT observations) with F2 − 10 keV = 7.9 × 10⁻¹² erg cm-2 s-1.
Extrapolating the power-law fit between 3 and 10 keV to low energies, an excess of photons is observed: in Fig. 5, we report XIS1 spectra for Mrk 509 and Mrk 841, and for each observation; the bottom panel shows the data-to-model ratio. The Galactic absorption has been taken into account following Dickey & Lockman (1990), using NH = 4.11 × 1020 cm-2 for Mrk 509 and NH = 2.34 × 1020 cm-2 for Mrk 841. The soft excess shape is remarkably similar for the two Seyfert galaxies, and for Mrk 509 spectral variability is observed at low energies.
As a first qualitative study, we model the 0.5–10 keV spectrum with a broken power law (plus three Gaussian emission lines, with parameters fixed as in Table 2, and Galactic absorption, fixed at values given above) to evaluate the soft excess slope (Γs) and energy break Eb. As shown in Table 3, this model does not provide a good fit to our data: the soft spectrum between 0.5 and 3 keV clearly displays some curvature and cannot be described by a power law.
3.3. Hard excess
Extrapolating the 3–10 keV best-fit power law to high energies, using PIN data, a hard excess can also be seen. This feature is well-explained by introducing a distant reflection by cold material, which accounts at the same time for the Fe Kα narrow emission line and the high energy bump. To quantify the amount of reflected emission required, we fitted the summed PIN and XIS (above 3 keV) data with a power law (plus three Gaussian lines, as described in the previous section) plus pexrav (Magdziarz & Zdziarski 1995), a model that describes reflection from neutral material. The pexrav free parameters are the reflection scaling factor Rpexrav (which is equal to 1 for a source isotropically illuminating the disc); the illuminating power-law high-energy cut-off Ec (fixed at 100 keV); the abundances (fixed to equal solar values) and the disc inclination angle θ (fixed at 30 degrees). For the summed spectra, we obtain  and
and  for Mrk 509 and Mrk 841, respectively. Adding the neutral reflection component slightly modifies the best-fit parameters of the broad Fe emission line, in particular its equivalent width. Best-fit parameters are given in Table 2. Pexrav has the advantage that gives directly the information about the reflected fraction Rpexrav, but does not evaluate the narrow Fe Kα emission line produced. We then decided to use reflext, a modified (and not public) version of reflion model (an older version of reflionx, Ross et al. 1999; Ross & Fabian 2005; see Sect. 3.6). Unlike reflion, in which the ionisation parameter ξ is comprised between 10 and 104 erg cm s-1, in reflext the ξ parameter space was extended as low as 1 erg cm s-1. Using reflext, the evaluation of the reflected fraction is less accessible, but the Fe Kα narrow emission line and the high energy bump are intrinsically tied.
In the following, we add reflext with parameters Fe/Fe⊙ = 1, Γreflext = Γ, and ξ = 1 erg cm s-1. Its normalization parameter Creflext was fixed to ensure that the flux of the model in the narrow Fe Kα emission line reproduced the observed line flux. As the intensity of the reflected emission depends on the slope of the illuminating continuum, we evaluated the value of Creflext that reproduces the observed line flux as a function of Γ; we fitted the result with a polynomial function, and we fixed the reflext normalization as a function of Γ.
3.4. Fe Kα narrow emission line in Mrk 841
We present here the analysis of the Fe Kα emission line in Mrk 841. Ponti et al. (2009) already presented a thorough study of the iron K complex in Mrk 509, using the same Suzaku observations we analysed.
A narrow (σ = 0) Fe Kα emission line was observed in previous Mrk 841 observations. In particular, P07 claimed that this narrow component is roughly constant in time, in agreement with a remote reflection scenario. We tested this hypothesis fitting the 3–10 keV XIS data with a power law plus a narrow Gaussian emission line, with σ fixed to zero, as done by P07. In Fig. 6, we report the contour plots of line flux versus line energy, for the two Suzaku observations, and we compare them to the results of P07 (XMM/Newton, observations from 2001 to 2005). The line flux agrees with the findings of P07, and no variability is observed. Line energy, in the source frame, is consistent with iron Kα for both observations.
Best-fit parameter values for the broken power-law model
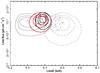 |
Fig. 6 Contour plots (in black for obs. 1, and in red for obs. 2) of line flux versus line energy (source frame) for the narrow emission Gaussian line in Mrk 841. The three confidence levels are for 68, 90, and 99%, respectively. In grey, we superimpose the contour plots of 2001–2005 XMM/Newton observations (see P07, Fig. 9). |
Best-fit parameter values for the double Comptonisation model, with (second row) or without (first row) a two-phase warm absorber.
In the following, we concentrate on the broad-band spectral fitting of Mrk 509 and Mrk 841 data with three different physical models: a double Comptonisation, a blurred reflection, and a smeared absorption. As only weak flux variability is observed between individual Mrk 509 observations, and as no significant variability is observed between individual Mrk 841 observations, we perform and discuss the broad-band spectral analysis for the summed spectra only (unless explicitly mentioned).
3.5. Double Comptonisation model
In the standard disc-corona scenario (Haardt & Maraschi 1993), the power-law high-energy emission is explained as a Comptonisation of thermal photons emitted by the black hole accretion disc. Electrons producing this inverse Compton effect have a temperature kTe ≈ 100 keV and a low optical depth, τ ≈ 1. One possible way of easily explaining the soft excess is that there is a second warm Comptonisation region, of lower temperature and higher optical depth, that modifies the black-body emission from the accretion disc, scattering UV photons up to soft X-ray energies. A physical interpretation of this “second corona” might be a warm skin on the disc surface (Janiuk et al. 2001), or a transition region between an outer disc and an optically thin inner flow (Magdziarz et al. 1998). We used NTHComp (Życki et al. 1999), which is one of the XSpec models, to simulate Comptonised spectra: this model solves the Kompaneets equation, and the output spectrum is parametrised by the electron temperature kTe and the spectral index Γ; seed photons come from an accretion disc spectrum, parametrised by kTdisc, the temperature at the inner radius. The electron temperature of the corona producing the high energy emission (subscript h), kTh, can be constrained only via the high energy cut-off: since we do not observe this cut-off in our data, we fixed it at 100 keV. For the soft Comptonisation region (subscript s), we cannot fit at the same time Γs and kTs, and, following GD04, we set Γs = 2.
The exact value of kTdisc does not affect the fit as long as it is lower than our energy domain, thus we chose kTdisc = 45 eV. We added reflext to our model to describe the reflection from distant material, with a normalization parameter fixed as described above, plus two Gaussian functions for the Fe Kβ and the Fe Kbroad emission lines, as in Table 2 (for the XIS + PIN fit). Our best-fit model results are given in Table 4.
The double Comptonisation model was studied in detail by GD04, who fitted a sample of 26 AGN showing that the cold Comptonisation region has a remarkably constant temperature ⟨kTs⟩ = 0.12 keV with σ = 0.02 keV, despite large variations in black hole mass and AGN luminosity. They also used the model NTHComp. The values we found for Mrk 509 and Mrk 841 during Suzaku observations agree with their statistics. We recall that the exact value of kTs depends on the assumption made for Γs: the only physical parameter that can be constrained (when the high energy cut-off is not observed) is the Comptonisation parameter y, defined as 4kT/(mc2) Max(τ,τ2), where τ is the plasma optical depth. The Γ parameter represents the asymptotic power-law function that describes the Comptonised spectrum, and can be expressed as (2.25 + 4/y)0.5 − 0.5, which is equal to 2 for y = 1. The most important result obtained by GD04 is not the exact value of kTs, but its constancy in AGN samples.
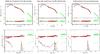 |
Fig. 7 Top: Mrk 509 data (sum of Suzaku observations) and, in the subplot, data-to-model ratio. Bottom: unfolded data. Colour code for the different Suzaku instruments: XIS/FI-black, XIS1-red, and HXD/PIN-green. Three different models are shown, from left to right: double Comptonisation, blurred reflection and smeared absorption. Solid lines correspond to the best-fit model, and thin dashed lines to the model different components. For the three models a broad emission-line component is required. The energy on the abscissa is in the observer frame. The data were rebinned for clarity purposes. |
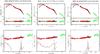 |
Fig. 8 Top: Mrk 841 data (sum of Suzak observations) and, in the subplot, data-to-model ratio. Bottom: unfolded data. Colour code for the different Suzaku instruments: XIS/FI-black, XIS1-red, and HXD/PIN-green. Three different models are shown, from left to right: double Comptonisation, blurred reflection and smeared absorption. Solid lines correspond to the best-fit model, and thin dashed lines to the model different components. A broad emission-line component is added for the double Comptonisation and the smeared absorption model only. The energy on the abscissa is in the observer frame. The data were rebinned for clarity purposes. |
Following GD04, we evaluated the soft-excess strength, RGD, defined as the ratio of the unabsorbed 0.3–2 keV flux in the cool to that in the hot Comptonised components: it is equal to  for Mrk 509 and
  for Mrk 841, placing our sources in the lowest part of the GD04 sample in terms of soft-excess strength.
3.5.1. Additional contribution of the warm absorber
In terms of the χ2 values, the double Comptonisation model does not provide a good fit to the data. For both sources, the presence of a warm absorber was confirmed, and its features could explain the residuals of the fit. The most complete studies of the warm absorber of these two objects were done using XMM/RGS data by Smith et al. (2007) and Detmers et al. (2010) for Mrk 509, and by Longinotti et al. (2010) for Mrk 841.
Smith et al. detected a three-phase warm absorber in Mrk 509, consisting of a low ionisation component (log ξ ≈ 0.89 and column density NH ≈ 7.9 × 1020 cm-2), an intermediate ionisation phase (log ξ ≈ 2.14, NH ≈ 7.5 × 1020 cm-2), and a high ionisation one (log ξ ≈ 3.26, NH ≈ 55 × 1020 cm-2). Detmers et al. confirmed the presence of three different components in the warm absorber: they found a low ionisation phase (log ξ ≈ 0.6, NH ≈ 1.0 × 1020 cm-2), an intermediate ionisation phase (log ξ ≈ 1.95, NH ≈ 10.5 × 1020 cm-2), and a high ionisation phase (log ξ ≈ 3.2, NH ≈ 80.0 × 1020 cm-2).
A multi-phase warm absorber was also found in Mrk 841, by Longinotti et al., with an intermediate ionisation component (log ξ ≈ 1.5–2.2, NH ≈ 12–39 × 1020 cm-2) and a higher ionisation phase (log ξ = 2.8–3.3 and NH ≈ 76–300 × 1020 cm-2).
We tested the presence of the warm absorber using the model zxipcf (Reeves et al. 2008), which is another of the XSpec models, which has as free parameters the ionisation parameter log ξ, the column density NH, the covering factor f, and the redshift z. We started our study by multiplying the double Comptonisation model by one zxipcf component, with f = 1 and z = zobject. For Mrk 509, we found that log  and
and  , values that are consistent with the intermediate ionisation phase found by Smith et al. and Detmers et al. For Mrk 841, we found that log
  and
and  , which is consistent with the intermediate ionisation phase in Longinotti et al. Adding zxipcf always improves the goodness of the fit, as is confirmed by a F-test: the null hypothesis probabilities were found to be 7 × 10-44 (for Mrk 509) and 1 × 10-13 (for Mrk 841).
We then tried to add a second absorber (subscript 2). For Mrk 509, we found that a two-phase warm absorber is statistically preferred (the associated F-test probability is 5 × 10⁻⁵) and we measured log  ,
,  , log
, log  , and
, and  . For the high ionisation phase, XMM/RGS data also showed a warm-absorber flow velocity blueshifted relative to the galaxy: we then fixed zWA,2 to the value found by Detmers et al. (zWA,2 = 0.0334, corresponding to v = − 290 km s-1). For Mrk 841, adding a second absorber does not improve the goodness of the fit and the absorber parameters are poorly constrained: we then fixed log ξWA,2 = 3.3, which is equal to the value measured by Longinotti et al. during the 2001 XMM observation of Mrk 841.
Our best-fit results are given in Table 4 and plotted in Figs. 7 and 8 (left panel). We considered whether there is a three-phase warm absorber in Mrk 509, but the goodness of the fit worsens, even fixing the warm absorbers parameters at the values measured by XMM/RGS.
Best-fit parameter values for the blurred reflection model.
The Zxipcf model can describe partial covering absorbers, with f < 1. We tested the effect of this parameter on a one-phase warm absorber. For Mrk 509, leaving f free to vary, it decreases to 0.3, while NH,WA increases, reaching 3 × 1022 cm-2; the new fit is statistically better than the one with f = 1 (the null hypothesis probability is equal to 1 × 10⁻⁷). For Mrk 841, the best-fit result is always consistent with f = 1 (we measure f > 0.7). Despite the better fit obtained with f < 1 for Mrk 509, we decided to use and study the f = 1 case in order to compare our results to those obtained with the XMM/RGS data (and for consistency between the analysis of our two sources). In any case, there is a degeneracy between f and NH, and leaving f free affects the values of ξ and Ts and, consequently, the physical interpretation of our results. In the next sections, we always use f = 1, with a reminder that, for Mrk 509, allowing f free to vary always leads to a better fit.
In both sources, XMM/RGS data revealed an OVII emission line at E ≈ 0.56 keV. We tested for the presence of this emission by adding a narrow (σ = 0) Gaussian line to the model (the fit was performed using data below 10 keV, without reflext, which produces an OVII emission line as well (see below)).
For Mrk 509, we obtained a significantly better fit (F-test probability = 4 × 10⁻⁹) for the fourth observation, while for the other observations and the summed spectra the goodness of the fit did not improve. However, at 0.56 keV we do not have the XIS/FI detectors (which start at 0.6 keV), and we are at the energy edge of XIS1: the energy resolution is quite low (the emission line is defined by one bin only) and we cannot confirm whether this statistically significant improvement to the fit corresponds to a true emission-line detection.
For Mrk 841, adding a Gaussian OVII emission line does not improve the goodness of the fit in either any individual observation or the summed spectrum.
The origin of this emission line is thought to be the warm gas itself but we do also expect OVII emission from colder reflection. In particular, Ebrero et al. (2010) showed, for the Seyfert 1 Mrk 279, that the reflext code (for log ξ < 1.43) produces an OVII line emission flux that exceeds the observed OVII line flux by a factor of 10 or more. For Mrk 509 and Mrk 841, this excess does not exist: the line flux produced by reflext (with log ξ = 0) is equal to 2.1 × 10⁻⁴ cm-2 s-1 for Mrk 509 (compared to 2.7 × 10⁻⁴ cm-2 s-1 found by Detmers et al.), and to 7.2 × 10⁻⁵ cm-2 s-1 for Mrk 841 (compared to (6.4 ± 5.3) × 10-5 cm-2 s-1 found by Longinotti et al. in the January 2005 XMM/RGS observation).
GD04 performed their fits without testing for the presence of a warm absorber in their data. Looking at Table 4, we can see that, after including zxipcf, kTs increases from 0.13–0.14 keV to 0.19–0.21 keV, becoming only marginally consistent with GD04 results.
3.6. Blurred reflection model
The constancy and universality of the soft excess temperature is difficult to explain in a double Comptonisation scenario, for objects with different black hole masses (GD04). It is instead expected if the soft excess origin is linked to atomic processes. If the reflection from the accretion disc is ionised, and if the emission lines are broadened by a relativistic velocity near the black hole, this component might also explain the soft excess. We used the reflionx model (Ross et al. 1999; Ross & Fabian 2005), convolved with the kdblur model (Laor 1991), to describe the disc ionised reflection. For the relativistic blurring, we assumed that Rin = 1.235 RG (the last stable orbit for a near extremal Kerr black hole with parameter a = 0.998, Thorne 1974), Rout = 100 RG, θ = 30 degrees, and disc emissivity index β = 3 (Laor 1991); for reflionx, we fixed the iron abundance to equal the solar value, leaving ξ and the normalization free. Following what we did in the previous section, we added a neutral reflection from distant material (reflext, with normalization parameter fixed as a function of Γ, as described in Sect. 3.3), a narrow Gaussian line (for the Fe Kβ emission line), and a two-phase warm absorber totally covering the source (zxipcf), with an ionisation parameter and column density left free to vary within the error bars of the values found using a double Comptonisation continuum (see Sect. 3.5.1). A broad emission feature around 6.4 keV is expected from the blurred reflection on the accretion disc, so no broad emission line was included in the model. Best-fit model results are given in Table 5.
Best-fit parameter values for the smeared absorption model.
The R parameter, which gives information about the reflected flux fraction, as defined by C06, is the ratio of the unabsorbed reflected component (reflionx) flux to the total (excluding reflext) unabsorbed flux in the 0.3–12 keV energy band. For a flat disc illuminated by an isotropic source, we evaluated a value of R ≈ 0.5 for a high ionisation state (log ξ > 3.5), while for lower ionisations the reflection fraction decreases, reaching 0.4 for log ξ = 3, 0.2 for log ξ = 2, and 0.1 for log ξ = 1.5.
This model is widely used in the literature: C06 analysed a sample of 34 type 1 AGN, fitting their XMM-Newton observations with the reflion model (an older version of reflionx). For the R parameter, they found that one third of the sources have no power-law component (R = 1), while in the rest of the sample R is almost constantly distributed between 0.25 and 0.8. Our values, which range between 0.15 and 0.18, are quite low compared to this result. In particular, Mrk 841 is included in their sample, and they found that R = 0.67 ± 0.17. This value differs from what was found by P07, in a dedicated paper on XMM-Newton observations, including the one studied by C06, for which they found that R = 0.3 (in their paper, P07 evaluated that R′ = 0.3, where R′ is the reflected fraction evaluated in the energy band 0.1–1000 keV, when including warm absorption; we reevaluated R using their best-fit model parameters). In our model, we froze all kdblur parameters. We tried to allow β to vary, but its best-fit value is always consistent with 3. C06 performed their fits leaving all, apart from Rout, of the kdblur parameters free to vary: with such a large number of parameters, best-fit model values become less well-constrained, with several parameters pegged at either lower or higher limits (as can be seen in C06, Table 3) and a physical interpretation of these results can be misleading. The results of P07 for their XMM-Newton observations of Mrk 841 were 1.59 ≤ Γ ≤ 2.45, 2 ≤ log ξ ≤ 2.5, and β ≈ 4 (but in one observation they found that β > 8.6), with a reflection fraction R′ varying between 0.30 and 0.43.
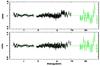 |
Fig. 9 Ratio of the Mrk 509 data to the blurred reflection model either with (bottom) or without (top) a broad emission Kα line (see Sect. 3.6). XIS/FI data are in black, while HXD/PIN data are in green. For clarity, the data were rebinned, and XIS1 data are not shown in this plot. |
The best-fit model result for Mrk 509 is not good ( ) and some residuals are clearly observed between 6 and 7 keV (see Fig. 9). We first tried to vary the inner radius and the inclination angle of the accretion disc, significantly improving the fit (F-test probability = 1 × 10⁻⁴) and measuring Rin < 1.7 RG and
  degrees. However, this cannot take into account all the residuals observed near the Fe Kα line. An excess of emission in the Fe Kα complex might be caused by an iron abundance higher than the solar value: we tried to vary this parameter but the best-fit model results are always consistent with Fe/Fe⊙ = 1. Adding a broad Gaussian line, the fit is significantly improved (the null hypothesis probability is 10-29). We measured
  keV,
keV,  , and
, and  keV, with an equivalent width of
  eV (see Table 5 and Fig. 7, middle panel).
For Mrk 841, a good fit to the data was achieved using the first model (all kdblur parameters were kept fixed at the values described above, and there was assumed to be no broad emission line), but the fit improved when θ was allowed free to vary, and we found that  degrees (with a F-test probability equal to 4 × 10⁻⁴). Adding a broad emission line at the Fe K complex energy does not improve the goodness of the fit (F-test probability = 0.1 compared to the fit where θ is allowed to vary) (see Table 5 and Fig. 8, middle panel).
3.7. Smeared absorption model
An alternative model to explain the soft excess is a relativistically smeared absorption, where high velocities can broaden all atomic features, producing a curved continuum spectrum. This absorption might correspond to an outflowing disc wind, as shown by Murray & Chiang (1997). We used swind (GD04), one of the XSpec models, to describe this component: a XSTAR (Bautista & Kallman 2001) grid (calculated assuming Γ = 2.4 and a microturbulent velocity of 100 km s-1) is convolved with a Gaussian function of width σ = v/c. Free parameters of swind model are the column density NH, the ionisation parameter ξ and the velocity dispersion σ. As for the ionised reflection model, we added a neutral reflection (reflext), a narrow Gaussian line for the Fe Kβ emission line and a two-phase warm absorber (zxipcf model). As no broad Fe emission line is included in the model, we also added a broad emission line with parameters fixed as in Table 2 (for the XIS + PIN fit). Best-fit model results are shown in Table 6 and Figs. 7 and 8, right panel.
For both sources, the values of σ are always pegged at the highest authorized value (v = 0.5c), and we can only give lower limits. It is interesting to cite the results of a fitting without zxipcf: σ decreases to ≈ 0.3 (it is equal to  and
and  for Mrk 509 and Mrk 841, respectively). We can compare our results for Mrk 841 with P07, who tested the same model for XMM-Newton observations: their best-fit values for swind model are 2.4 ≤ log ξ ≤ 3.5, 0.9 ≤ NH ≤ 4.4 × 1023cm-2, and σ consistent with 0.3 (but > 0.4 in two cases). The values of NH and ξ that we found agree with these results. This model was studied by Middleton et al. (2007, hereafter M07), who analysed the same AGN sample used by C06. They found that, in half of their sample, σ is pegged at 0.5, and that, in general, it has a typical value > 0.3. Their ξ and NH best-fit values do not have large dispersion: log ξ varies between 2.5 and 3.7, with lower values (log ξ < 3) for their narrow-line Seyfert 1 (NLS1) galaxy sample; the values of NH are between 5 × 10²² and 5 × 1024, with, once again, values lower than 1.5 × 10²³ restricted to NLS1 galaxies. The intrinsic power-law spectral index varies between 2.0 and 3.4, with a clear difference between the softer NLS1s and the harder broad-line AGN. The values that we found agree with these global results, but Γ is only marginally compatible with M07’s results. The evaluation of Γ is important since it affects the soft excess strength and shape, and therefore the swind parameters. To examine whether PIN data have an effect on the evaluation of Γ, we tried to fit XIS data alone, but the best-fit values of Γ are compatible with the broad-band fit.
4. Discussion and conclusions
Both Mrk 509 and Mrk 841 are bright Seyfert 1 galaxies that are well-known for their soft X-ray excess, their iron Kα emission line, and their spectral variability. We have presented our analysis of new Suzaku observations: four of Mrk 509 (from April, 2006 to November, 2006), and two of Mrk 841 (January and July, 2007). The soft excess has been found to be clearly present in both sources, with a flux ≈ 2 times higher than the 3–10 keV power-law extrapolation at 0.5 keV. Pounds & Reeves (2002) analysed a sample of six Seyfert 1 galaxies, showing that a variety of soft excess shapes exists, correlated with AGN luminosity: our sources during Suzaku observations can be described as “gradual soft excess” galaxies, according to Pounds and Reeves terminology. We can compare our results to past observations (Pounds et al. 2001; Pounds & Reeves 2002; De Rosa et al. 2004; P07): a soft excess two times higher than the power-law extrapolation at 0.5 keV is common for both sources, even though Mrk 841 during XMM-Newton observations showed a stronger soft excess, 2.5–3 times higher than the power law, and the soft excess of Mrk 509 during obs.1 is quite low, similar to what was observed during the highest state in BeppoSAX observations (De Rosa et al. 2004).
Comparing our observations to statistical studies of the soft excess (GD04, C06, M07), we have confirmed that both sources were detected during a weak soft-excess state, setting them always in the lower part of the sample: for the double Comptonisation model, the “soft excess strength” (RGD, as defined by GD04) of Mrk 509 and Mrk 841 during our observations is between 0.23 and 0.28, while the GD04 sample has a typical value of 0.4–0.6; in the reflection model, we found a R parameter between 0.15 and 0.18, which is quite low relative to the reflected flux fractions of C06.
Both sources exhibit a hard excess at energies greater than 10 keV. This excess is weak compared to what was observed by Suzaku in three other Seyfert 1 galaxies (Walton et al. 2010), though they are rather extreme exemples of hard excesses.
A narrow Fe Kα emission line is detected in both sources, consistent with a reflection by remote and cold material (i.e. the dust torus or the furthest regions of the accretion disc). For Mrk 841, we compared our results to previous XMM-Newton observations, showing that the line flux is constant in time. For an analysis of the Fe K complex emission of Mrk 509, we refer to Ponti et al. (2009). A broad Fe K emission line is observed as well, with equivalent width ≈150 eV in both sources.
We detected a two-phase warm absorber in Mrk 509 data, with log ξWA,1 ≈ 1.7 and log ξWA,2 ≈ 2.7, values that are lower than those found by Smith et al. and Detmers et al. In the Suzaku data, we did not detect the low ionisation phase (log ξ = 0.6−0.9) of the absorber observed by XMM/RGS. For Mrk 841, we found a low-ionisation warm absorber with log ξWA,1 ≈ 2.2, consistent with the lower ionisation phase in the two-phase absorber described by Longinotti et al. (2010), and we fixed the high ionisation parameter to be log ξWA,2 = 3.3. For Mrk 509, considering a warm absorber covering factor lower than 1, always improves the fit.
We started the analysis of the broad-band spectra of the two sources by considering the double Comptonisation model, which correctly fits the data ( for Mrk 509, and
  for Mrk 841), but the constancy of the temperature of the cold Comptonisation region in statistical studies of Seyfert 1 galaxies is not explained by current physical models of accretion disc atmospheres, and thus disfavours this model.
We then fitted the broad-band spectrum with the two competitive models developed to explain the soft excess with atomic processes: a blurred reflection and a smeared ionised absorption.
For Mrk 509, we need to add a broad emission line to correctly fit the data, and we obtain  –1.02 for the blurred reflection and the smeared absorption model, respectively.
The physical origin of this emission is unclear: for the reflection model, a broadened emission line is already included in the code we used, and it is difficult to explain why we do need some more reflection at E ≈ 6.4 keV. Interestingly, this result suggests that the reflection model correctly describes the soft excess shape and strength, but underestimates the broad emission at Fe K complex energies.
For the smeared absorption model, we did not include any reflection from the accretion disc, and the fact that we need to add a broad emission line is less critical: the swind code assumes a simple power-law emission as input for the smeared absorption, and the presence of residuals in the Fe K complex region means that the continuum spectrum absorbed by the wind does include, indeed, some reflected component.
For Mrk 841, no extra emission in the reflection model is required, while a broad Gaussian emission line is needed in the absorption model. Each model gives a good fit to the data, and none of them can be invalidated ( for the two models).
Suzaku data, characterised by a good energy resolution in a large energy domain (0.5–60 keV), seemed to be able to constrain the intrinsic power-law photon index at high energies, and then to favor one model over another. The best-fit models show that, while in the soft X-ray domain the models are degenerate, in the hard energy band they do not superpose any more and we could, in principle, distinguish between them, but the PIN signal-to-noise ratio is still too low to constrain the fit. For the sum of Mrk 509 observations, we can estimate from the best-fit model in the hard X-ray domain a flux F17−60 keV = 4.47, 4.81, and 4.27 × 10⁻¹¹ erg cm-2 s-1 and F14−150 keV = 7.64, 8.07, and 7.66 × 10⁻¹¹ erg cm-2 s-1 for the double Comptonisation, the blurred reflection, and the smeared absorption model, respectively; for the sum of Mrk 841 observations we obtain F17−60 keV = 1.94, 2.15, and 1.67 × 10⁻¹¹ erg cm-2 s-1 and F14−150 keV = 3.47, 3.72, and 3.06 × 10⁻¹¹ erg cm-2 s-1 for the three models, respectively. These values can be compared with the INTEGRAL (Krivonos et al. 2010) and Swift/BAT (Cusumano et al. 2010) detections of our sources: INTEGRAL detected Mrk 509 at F17−60 keV = 5.90 × 10⁻¹¹ erg cm-2 s-1 and Mrk 841 at F17−60 keV = 3.07 × 10⁻¹¹ erg cm-2 s-1; Swift/BAT observed a flux in the 14–150 keV energy band equal to 8.5 × 10⁻¹¹ erg cm-2 s-1 for Mrk 509 and 2.9 × 10⁻¹¹ erg cm-2 s-1 for Mrk 841. The differences between the predicted high-energy fluxes demonstrate that a simultaneous broad-band observation with adequate signal-to-noise ratio would be able to distinguish between the different models.
Statistical studies of AGN can help us to solve the problem of the origin of the soft excess. The discovery of the remarkably constant temperature of the cold Comptonisation region, despite the AGN luminosity and black hole mass spanning several decades, is hardly explained in a double Comptonisation scenario. Our kTs values agree with GD04 results, but we note that adding a warm absorber (which was not included in the GD04 analysis) affects the kTs best-fit values.
Reflection and absorption models, that are tied to atomic processes, can easily explain the small spread in the soft-excess temperature. However, the smeared absorption model has the weakness that the velocity dispersion required to fit the soft excess is very large, reaching c/2, which corresponds to extremely relativistic terminal velocities of the wind. Numerical simulations (Schurch & Done 2008) show that disc winds have σ < 0.1c, which is very low compared to swind model results. An outlet could be a magnetically driven wind, partially covering the source. We underline that swind takes into account only the absorption by the wind, but if we also consider its emission, (Chevallier et al. 2006; Schurch & Done 2006) the fit requires a lower smearing velocity and a lower column density. A possible concern of the swind model is that the absorption is evaluated assuming an incident power-law spectrum with Γ = 2.4, which is inconsistent with the Γ best-fit values of our observations.
The Fe broad-line excess we observe in both sources suggests that, even in an absorption scenario, we need some reflected emission from the inner regions of the accretion disc. A broad Fe K emission line can also be reproduced by disk wind models (Sim et al. 2010), with lower outflow velocities (0.1c).
The blurred reflection model fits the Suzaku data well for Mrk 841, while for Mrk 509 we need to include an additional emission at Fe K energies, which is difficult to explain. The model does not need a high reflection fraction R, which is seen in several other cases, and is explained by a huge light bending effect (Miniutti & Fabian 2004) close to the black hole.
It is of course possible that different processes are at work at the same time. In this scenario (which is difficult to test in a stationary framework owing to the high number of free parameters involved), the broad emission observed in Mrk 509 could be due to standard ionised reflection from the accretion disc, while Comptonisation or smeared absorption should be responsible for the soft excess below 1 keV (see Patrick et al. 2011).
Alternatively, the continuum X-ray emission from the hot corona might deviate from a power law when measured over a broad energy band, showing an intrinsic curvature that has not been taken into account in our modeling.
Variability studies can help us ascertain the physical origin of the soft excess. In the blurred reflection scenario, variability can be explained by changes in the height of the corona above the disc, but this picture implies a strong continuum-reflected component correlation that has not been observed. In the smeared absorption model, spectral variability is more easily explained by a variation in the absorber physical parameters, or its covering factor. Unluckily, neither of our sources displayed significant variability during Suzaku observations, and we could not use temporal information to more tightly constrain our models.
Future X-ray observatories, and in particular Astro-H (Takahashi et al. 2010) and NuSTAR (Harrison et al. 2010), wich have higher sensitivities and energy resolutions in the hard X-ray domain, will be able to more tightly constrain the spectrum, casting light on the physical origin of the soft excess in Seyfert 1 galaxies.
Acknowledgments
This research has made use of data obtained from the Suzaku satellite, a collaborative mission between the space agencies of Japan (JAXA) and the USA (NASA). This work was financially supported by the GdR PCHE in France. M.C. thanks Matteo Guainazzi for useful discussions and for his help in rebinning the data. G.P. acknowledges support via an EU Marie Curie Intra-European Fellowship under contract No. FP7-PEOPLE-2009-IEF-254279. P.O.P. acknowledges financial support from the CNES agency. We also thank the anonymous referee for providing constructive remarks that improved the quality of the paper.
References
- Abdo, A. A., Ackermann, M., Ajello, M., et al. 2010, ApJ, 710, 810 [NASA ADS] [CrossRef] [Google Scholar]
- Akiyama, M., Ueda, Y., Ohta, K., Takahashi, T., & Yamada, T. 2003, ApJS, 148, 275 [NASA ADS] [CrossRef] [Google Scholar]
- Arnaud, K. A., Branduardi-Raymont, G., Culhane, J. L., et al. 1985, MNRAS, 217, 105 [NASA ADS] [CrossRef] [Google Scholar]
- Bautista, M. A., & Kallman, T. R. 2001, ApJS, 134, 139 [NASA ADS] [CrossRef] [Google Scholar]
- Bianchi, S., Matt, G., Haardt, F., et al. 2001, A&A, 376, 77 [NASA ADS] [CrossRef] [EDP Sciences] [Google Scholar]
- Boldt, E., & Leiter, D. 1987, ApJ, 322, L1 [NASA ADS] [CrossRef] [Google Scholar]
- Chevallier, L., Collin, S., Dumont, A., et al. 2006, A&A, 449, 493 [NASA ADS] [CrossRef] [EDP Sciences] [Google Scholar]
- Cooke, B. A., Ricketts, M. J., Maccacaro, T., et al. 1978, MNRAS, 182, 489 [NASA ADS] [CrossRef] [Google Scholar]
- Crummy, J., Fabian, A. C., Gallo, L., & Ross, R. R. 2006, MNRAS, 365, 1067 [NASA ADS] [CrossRef] [Google Scholar]
- Cusumano, G., La Parola, V., Segreto, A., et al. 2010, A&A, 524, A64 [NASA ADS] [CrossRef] [EDP Sciences] [Google Scholar]
- Czerny, B., Nikołajuk, M., Różańska, A., et al. 2003, A&A, 412, 317 [NASA ADS] [CrossRef] [EDP Sciences] [Google Scholar]
- Dadina, M., Cappi, M., Malaguti, G., Ponti, G., & de Rosa, A. 2005, A&A, 442, 461 [NASA ADS] [CrossRef] [EDP Sciences] [Google Scholar]
- de La Calle Pérez, I., Longinotti, A. L., Guainazzi, M., et al. 2010, A&A, 524, A50 [NASA ADS] [CrossRef] [EDP Sciences] [Google Scholar]
- De Rosa, A., Piro, L., Matt, G., & Perola, G. C. 2004, A&A, 413, 895 [NASA ADS] [CrossRef] [EDP Sciences] [Google Scholar]
- Detmers, R. G., Kaastra, J. S., Costantini, E., et al. 2010, A&A, 516, A61 [NASA ADS] [CrossRef] [EDP Sciences] [Google Scholar]
- Dickey, J. M., & Lockman, F. J. 1990, ARA&A, 28, 215 [NASA ADS] [CrossRef] [MathSciNet] [Google Scholar]
- Done, C., Gierliński, M., & Kubota, A. 2007, A&AR, 15, 1 [Google Scholar]
- Ebrero, J., Costantini, E., Kaastra, J. S., et al. 2010, A&A, 520, A36 [NASA ADS] [CrossRef] [EDP Sciences] [Google Scholar]
- Fisher, K. B., Huchra, J. P., Strauss, M. A., et al. 1995, ApJS, 100, 69 [NASA ADS] [CrossRef] [Google Scholar]
- George, I. M., Nandra, K., Fabian, A. C., et al. 1993, MNRAS, 260, 111 [NASA ADS] [Google Scholar]
- George, I. M., Nandra, K., Turner, T. J., & Celotti, A. 1994, ApJ, 436, L59 [NASA ADS] [CrossRef] [Google Scholar]
- Gierliński, M., & Done, C. 2004, MNRAS, 349, L7 [NASA ADS] [CrossRef] [Google Scholar]
- Haardt, F., & Maraschi, L. 1993, ApJ, 413, 507 [NASA ADS] [CrossRef] [MathSciNet] [Google Scholar]
- Harrison, F. A., Boggs, S., Christensen, F., et al. 2010, in SPIE Conf. Ser., 7732 [Google Scholar]
- Janiuk, A., Czerny, B., & Madejski, G. M. 2001, ApJ, 557, 408 [NASA ADS] [CrossRef] [Google Scholar]
- Kaastra, J. S., Petrucci, P., Cappi, M., et al. 2011, A&A, 534, A36 [NASA ADS] [CrossRef] [EDP Sciences] [Google Scholar]
- Koyama, K., Tsunemi, H., Dotani, T., et al. 2007, PASJ, 59, 23 [Google Scholar]
- Krivonos, R., Tsygankov, S., Revnivtsev, M., et al. 2010, A&A, 523, A61 [NASA ADS] [CrossRef] [EDP Sciences] [Google Scholar]
- Laor, A. 1991, ApJ, 376, 90 [NASA ADS] [CrossRef] [Google Scholar]
- Longinotti, A. L., Costantini, E., Petrucci, P. O., et al. 2010, A&A, 510, A92 [NASA ADS] [CrossRef] [EDP Sciences] [Google Scholar]
- Magdziarz, P., & Zdziarski, A. A. 1995, MNRAS, 273, 837 [NASA ADS] [CrossRef] [Google Scholar]
- Magdziarz, P., Blaes, O. M., Zdziarski, A. A., Johnson, W. N., & Smith, D. A. 1998, MNRAS, 301, 179 [NASA ADS] [CrossRef] [Google Scholar]
- Middleton, M., Done, C., & Gierliński, M. 2007, MNRAS, 381, 1426 [NASA ADS] [CrossRef] [Google Scholar]
- Miniutti, G., & Fabian, A. C. 2004, MNRAS, 349, 1435 [NASA ADS] [CrossRef] [Google Scholar]
- Miniutti, G., Ponti, G., Greene, J. E., et al. 2009, MNRAS, 394, 443 [NASA ADS] [CrossRef] [Google Scholar]
- Miyazawa, T., Haba, Y., & Kunieda, H. 2009, PASJ, 61, 1331 [NASA ADS] [CrossRef] [Google Scholar]
- Morini, M., Lipani, N. A., & Molteni, D. 1987, ApJ, 317, 145 [NASA ADS] [CrossRef] [Google Scholar]
- Murray, N., & Chiang, J. 1997, ApJ, 474, 91 [NASA ADS] [CrossRef] [Google Scholar]
- Palmeri, P., Mendoza, C., Kallman, T. R., Bautista, M. A., & Meléndez, M. 2003, A&A, 410, 359 [NASA ADS] [CrossRef] [EDP Sciences] [Google Scholar]
- Patrick, A. R., Reeves, J. N., Porquet, D., et al. 2011, MNRAS, 411, 2353 [NASA ADS] [CrossRef] [Google Scholar]
- Perola, G. C., Matt, G., Fiore, F., et al. 2000, A&A, 358, 117 [NASA ADS] [Google Scholar]
- Petrucci, P. O., Ponti, G., Matt, G., et al. 2007, A&A, 470, 889 [NASA ADS] [CrossRef] [EDP Sciences] [Google Scholar]
- Piconcelli, E., Jimenez-Bailón, E., Guainazzi, M., et al. 2005, A&A, 432, 15 [NASA ADS] [CrossRef] [EDP Sciences] [Google Scholar]
- Ponti, G., Miniutti, G., Cappi, M., et al. 2006, MNRAS, 368, 903 [NASA ADS] [CrossRef] [Google Scholar]
- Ponti, G., Cappi, M., Vignali, C., et al. 2009, MNRAS, 394, 1487 [NASA ADS] [CrossRef] [Google Scholar]
- Pounds, K., & Reeves, J. 2002, Proc. Symposium on New Visions of the X-ray Universe in the XMM-Newton and Chandra Era, 26–30 November 2001, ESTEC, The Netherlands [arXiv:astro-ph/0201436] [Google Scholar]
- Pounds, K. A., Nandra, K., Fink, H. H., & Makino, F. 1994, MNRAS, 267, 193 [NASA ADS] [CrossRef] [Google Scholar]
- Pounds, K., Reeves, J., O’Brien, P., et al. 2001, ApJ, 559, 181 [NASA ADS] [CrossRef] [Google Scholar]
- Pravdo, S., Nugent, J., Nousek, J., et al. 1981, ApJ, 251, 501 [NASA ADS] [CrossRef] [Google Scholar]
- Reeves, J., Done, C., Pounds, K., et al. 2008, MNRAS, 385, L108 [NASA ADS] [CrossRef] [Google Scholar]
- Reynolds, C. S. 1997, MNRAS, 286, 513 [NASA ADS] [CrossRef] [Google Scholar]
- Ross, R. R., & Fabian, A. C. 2005, MNRAS, 358, 211 [Google Scholar]
- Ross, R. R., Fabian, A. C., & Young, A. J. 1999, MNRAS, 306, 461 [NASA ADS] [CrossRef] [Google Scholar]
- Sazonov, S., Revnivtsev, M., Krivonos, R., Churazov, E., & Sunyaev, R. 2007, A&A, 462, 57 [NASA ADS] [CrossRef] [EDP Sciences] [Google Scholar]
- Schurch, N. J., & Done, C. 2006, MNRAS, 371, 81 [NASA ADS] [CrossRef] [Google Scholar]
- Schurch, N. J., & Done, C. 2008, MNRAS, 386, L1 [NASA ADS] [CrossRef] [Google Scholar]
- Shakura, N. I., & Sunyaev, R. A. 1976, MNRAS, 175, 613 [NASA ADS] [CrossRef] [Google Scholar]
- Sim, S. A., Miller, L., Long, K. S., Turner, T. J., & Reeves, J. N. 2010, MNRAS, 404, 1369 [NASA ADS] [Google Scholar]
- Singh, K. P., Garmire, G. P., & Nousek, J. 1985, ApJ, 297, 633 [NASA ADS] [CrossRef] [Google Scholar]
- Singh, K. P., Westergaard, N. J., Schnopper, H. W., Awaki, H., & Tawara, Y. 1990, ApJ, 363, 131 [NASA ADS] [CrossRef] [Google Scholar]
- Smith, H. E., Burbidge, E. M., Baldwin, J. A., et al. 1977, ApJ, 215, 427 [NASA ADS] [CrossRef] [Google Scholar]
- Smith, R. A. N., Page, M. J., & Branduardi-Raymont, G. 2007, A&A, 461, 135 [NASA ADS] [CrossRef] [EDP Sciences] [Google Scholar]
- Sobolewska, M. A., & Done, C. 2007, MNRAS, 374, 150 [NASA ADS] [CrossRef] [Google Scholar]
- Takahashi, T., Abe, K., Endo, M., et al. 2007, PASJ, 59, 35 [NASA ADS] [CrossRef] [EDP Sciences] [Google Scholar]
- Takahashi, T., Mitsuda, K., Kelley, R., et al. 2010, in SPIE Conf. Ser., 7732 [Google Scholar]
- Thorne, K. S. 1974, ApJ, 191, 507 [Google Scholar]
- Turner, T. J., & Miller, L. 2009, A&A Rev., 17, 47 [NASA ADS] [CrossRef] [Google Scholar]
- Walton, D. J., Reis, R. C., & Fabian, A. C. 2010, MNRAS, 1054 [Google Scholar]
- Watanabe, C., Ohta, K., Akiyama, M., & Ueda, Y. 2004, ApJ, 610, 128 [NASA ADS] [CrossRef] [Google Scholar]
- Życki, P. T., Done, C., & Smith, D. A. 1999, MNRAS, 309, 561 [NASA ADS] [CrossRef] [Google Scholar]
All Tables
Best-fit parameter values for the model powerlaw + zgauss + zgauss + zgauss, considering XIS data between 3 and 10 keV.
Best-fit parameter values for the double Comptonisation model, with (second row) or without (first row) a two-phase warm absorber.
All Figures
|
Fig. 1 Suzaku/XIS0 image of Mrk 841 (first observation): the brightest source is Mrk 841 and the fainter one is consistent with PKS 1502+106; the two calibration spots are visible in the top and bottom left corners. |
| In the text | |
|
Fig. 2 PKS 1502+106 spectrum (observer frame) as seen by Suzaku/XIS/FI (black) and XIS1 (red). Data were fitted with a power-law model absorbed by galactic material (see Sect. 2.1): data-to-model ratio is shown in the bottom plot. |
| In the text | |
|
Fig. 3 Mrk 509 (left) and Mrk 841 (right) light curves. Different observations are shown in different colours (one-black, two-red, three-green, and four-blue). From top to bottom: 0.5–3 keV light curve (in units of counts per second); 3–10 keV light curve and hardness ratio (3–10/0.5–3). Gap between observations is arbitrary. |
| In the text | |
|
Fig. 4 XIS data between 3 and 10 keV of the sum of Mrk 509 (left) and Mrk 841 (right) observations: data are first fitted with a power law (ignoring the 6–7 keV energy band, upper panel and first ratio plot); then two narrow Gaussian lines (for the Fe Kα and Kβ emission lines, see Sect. 3.2) are added to the fit (second ratio plot); a broad (σ > 0) Fe emission line is finally considered (third and last ratio plot). Only FI data are shown, as they have the highest resolution around the Fe Kα emission line, but the fit was performed using both FI and XIS1 data. The energy on the abscissa is in the observer frame. The data were rebinned for clarity purposes. |
| In the text | |
|
Fig. 5 Mrk 509 (left) and Mrk 841 (right) soft excess: data from 3 to 10 keV are fitted with a power law plus three Gaussian emission lines (see Table 2), and the model is then extrapolated to lower energies. Galactic absorption is taken into account. Only XIS1 data are shown, as they extend to 0.5 keV, but the analysis was performed using both FI and XIS1 data; the colour code for the different observations is as in Fig. 3. The energy on the abscissa is in the observer frame. The data were rebinned for clarity purposes. |
| In the text | |
|
Fig. 6 Contour plots (in black for obs. 1, and in red for obs. 2) of line flux versus line energy (source frame) for the narrow emission Gaussian line in Mrk 841. The three confidence levels are for 68, 90, and 99%, respectively. In grey, we superimpose the contour plots of 2001–2005 XMM/Newton observations (see P07, Fig. 9). |
| In the text | |
|
Fig. 7 Top: Mrk 509 data (sum of Suzaku observations) and, in the subplot, data-to-model ratio. Bottom: unfolded data. Colour code for the different Suzaku instruments: XIS/FI-black, XIS1-red, and HXD/PIN-green. Three different models are shown, from left to right: double Comptonisation, blurred reflection and smeared absorption. Solid lines correspond to the best-fit model, and thin dashed lines to the model different components. For the three models a broad emission-line component is required. The energy on the abscissa is in the observer frame. The data were rebinned for clarity purposes. |
| In the text | |
|
Fig. 8 Top: Mrk 841 data (sum of Suzak observations) and, in the subplot, data-to-model ratio. Bottom: unfolded data. Colour code for the different Suzaku instruments: XIS/FI-black, XIS1-red, and HXD/PIN-green. Three different models are shown, from left to right: double Comptonisation, blurred reflection and smeared absorption. Solid lines correspond to the best-fit model, and thin dashed lines to the model different components. A broad emission-line component is added for the double Comptonisation and the smeared absorption model only. The energy on the abscissa is in the observer frame. The data were rebinned for clarity purposes. |
| In the text | |
|
Fig. 9 Ratio of the Mrk 509 data to the blurred reflection model either with (bottom) or without (top) a broad emission Kα line (see Sect. 3.6). XIS/FI data are in black, while HXD/PIN data are in green. For clarity, the data were rebinned, and XIS1 data are not shown in this plot. |
| In the text | |
Current usage metrics show cumulative count of Article Views (full-text article views including HTML views, PDF and ePub downloads, according to the available data) and Abstracts Views on Vision4Press platform.
Data correspond to usage on the plateform after 2015. The current usage metrics is available 48-96 hours after online publication and is updated daily on week days.
Initial download of the metrics may take a while.