Free Access
Fig. 6
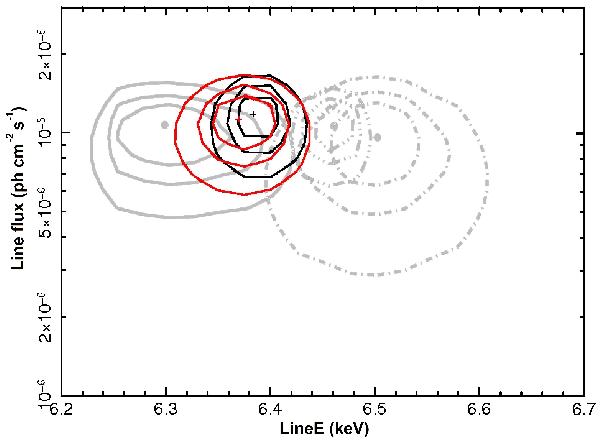
Contour plots (in black for obs. 1, and in red for obs. 2) of line flux versus line energy (source frame) for the narrow emission Gaussian line in Mrk 841. The three confidence levels are for 68, 90, and 99%, respectively. In grey, we superimpose the contour plots of 2001–2005 XMM/Newton observations (see P07, Fig. 9).
Current usage metrics show cumulative count of Article Views (full-text article views including HTML views, PDF and ePub downloads, according to the available data) and Abstracts Views on Vision4Press platform.
Data correspond to usage on the plateform after 2015. The current usage metrics is available 48-96 hours after online publication and is updated daily on week days.
Initial download of the metrics may take a while.