Fig. 4
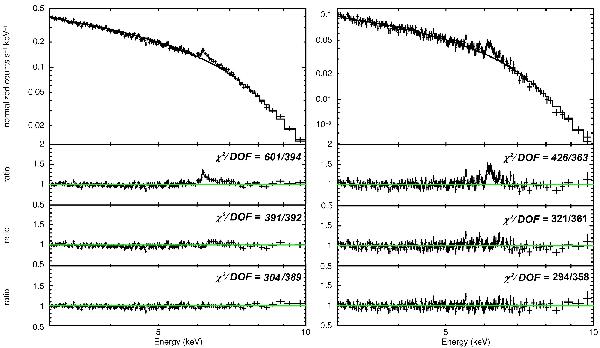
XIS data between 3 and 10 keV of the sum of Mrk 509 (left) and Mrk 841 (right) observations: data are first fitted with a power law (ignoring the 6–7 keV energy band, upper panel and first ratio plot); then two narrow Gaussian lines (for the Fe Kα and Kβ emission lines, see Sect. 3.2) are added to the fit (second ratio plot); a broad (σ > 0) Fe emission line is finally considered (third and last ratio plot). Only FI data are shown, as they have the highest resolution around the Fe Kα emission line, but the fit was performed using both FI and XIS1 data. The energy on the abscissa is in the observer frame. The data were rebinned for clarity purposes.
Current usage metrics show cumulative count of Article Views (full-text article views including HTML views, PDF and ePub downloads, according to the available data) and Abstracts Views on Vision4Press platform.
Data correspond to usage on the plateform after 2015. The current usage metrics is available 48-96 hours after online publication and is updated daily on week days.
Initial download of the metrics may take a while.