| Issue |
A&A
Volume 689, September 2024
|
|
|---|---|---|
| Article Number | A306 | |
| Number of page(s) | 17 | |
| Section | Extragalactic astronomy | |
| DOI | https://doi.org/10.1051/0004-6361/202451346 | |
| Published online | 20 September 2024 | |
Galaxy populations in the Hydra I cluster from the VEGAS survey
III. The realm of low surface brightness features and intra-cluster light
1
INAF – Astronomical Observatory of Capodimonte, Salita Moiariello 16, I-80131 Naples, Italy
2
European Southern Observatory, Karl-Schwarzschild-Strasse 2, 85748 Garching bei München, Germany
3
Kapteyn Institute, University of Groningen, Landleven 12, 9747 AD Groningen, The Netherlands
4
INAF – Astronomical Observatory of Abruzzo, Via Maggini, 64100 Teramo, Italy
5
Dipartimento di Fisica e Astronomia “G. Galilei”, Università di Padova, Vicolo dell’Osservatorio 3, I-35122 Padova, Italy
6
Institute of Astronomy, University of Cambridge, Madingley Road, Cambridge CB3 0HA, UK
7
Centre for Astrophysics and Supercomputing, Swinburne University of Technology, Hawthorn, VIC 3122, Australia
8
Gran Sasso Science Institute, Viale Francesco Crispi 7, I-67100 L’Aquila, Italy
9
SRON Netherlands Institute for Space Research, Landleven 12, 9747 AD Groningen, The Netherlands
Received:
2
July
2024
Accepted:
26
July
2024
In this paper, we analyse the light distribution in the Hydra I cluster of galaxies to explore their low surface brightness features, measure the intra-cluster light, and address the assembly history of the cluster. For this purpose, we used deep wide-field g- and r-band images obtained with the VLT Survey Telescope (VST) as part of the VEGAS project. The VST mosaic covers ∼0.4 times the virial radius (Rvir) around the core of the cluster, which enabled us to map the light distribution down to faint surface brightness levels of μg ∼ 28 mag/arcsec2. In this region of the cluster, 44 cluster members are brighter than mB ≤ 16 mag, and the region includes more than 300 dwarf galaxies. Similar to the projected distribution of all cluster members (bright galaxies and dwarfs), we find that the bulk of the galaxy light is concentrated in the cluster core, which also emits in the X-rays, and there are two overdensities: in the north (N) and south-east (SE) with respect to the cluster core. We present the analysis of the light distribution of all the bright cluster members. After removing foreground stars and other objects, we measured the diffuse intra-cluster light and compared its distribution with that of the globular clusters and dwarf galaxies in the cluster. We find that most of the diffuse light low surface brightness features, and signs of possible gravitational interaction between galaxies reside in the core and in the group in the N, while ram-pressure stripping is frequently found to affect galaxies within the SE group. All these features confirm that the mass assembly in this cluster is still ongoing. By combining the projected phase-space with these observed properties, we trace the different stages of the assembly history. We also address the main formation channels for the intra-cluster light detected in the cluster, which has a total luminosity of LICL ∼ 2.2 × 10¹¹ L⊙ and contributes ∼12% to the total luminosity of the cluster.
Key words: galaxies: clusters: intracluster medium / galaxies: evolution / galaxies: clusters: individual: Hydra I / galaxies: photometry
© The Authors 2024
 Open Access article, published by EDP Sciences, under the terms of the Creative Commons Attribution License (https://creativecommons.org/licenses/by/4.0), which permits unrestricted use, distribution, and reproduction in any medium, provided the original work is properly cited.
This article is published in open access under the Subscribe to Open model. Subscribe to A&A to support open access publication.
1. Introduction
According to the Λ cold dark matter (ΛCDM) scenario, clusters of galaxies are expected to grow over time by accreting smaller groups along filaments, driven by the effect of gravity that is generated by the total matter content (e.g. White & Rees 1978; Bullock et al. 2001). In the deep potential well at the cluster centre, the galaxies continue to undergo active mass assembly. In this process, gravitational interactions and merging between systems of comparable mass and/or smaller objects play a fundamental role in defining their morphology and kinematics (Toomre & Toomre 1972). In particular, as a result of these events, a significant amount of debris is deposited at larger radii from the galaxy centre and is retained by the DM halo (e.g. Bullock & Johnston 2005). This debris can be traced by loosely bound stars and globular clusters (GCs), stellar streams, and tidal tails, which contribute to the build-up of the stellar haloes and the intra-cluster light (ICL). All these structures are fainter by more than 4 mag than the central regions of galaxies (μg ≥ 26 mag/arcsec2), they have multiple stellar populations and complex kinematics, and they are still growing at the present epoch. At larger distances from the galaxy centre, the dynamical timescales are longer, and all these structures can therefore survive for several billion years. As it encodes the physical processes, the ICL is considered a highly valuable diagnostic of the mass assembly in all environments (Montes & Trujillo 2019; Contini & Gu 2021; Pillepich et al. 2018; Jiménez-Teja et al. 2019; Kluge et al. 2020).
From the theoretical side, semi-analytic models and hydrodynamic simulations give detailed predictions about the structure and stellar populations of stellar haloes, the ICL formation, and the amount of substructure in various types of environment (see Cooper et al. 2015; Cook et al. 2016; Pillepich et al. 2018; Monachesi et al. 2019; Merritt et al. 2020; Contini & Gu 2021; Contini et al. 2023; Tang et al. 2023, and references therein). In particular, simulations predict that the brightest and most massive galaxies are made by the in situ component that formed at an early epoch and dominates at the central radii, as well as by the accreted ex situ component, which is assembled as a result of the gravitational interaction events (Cooper et al. 2013; Remus et al. 2017; Pillepich et al. 2018; Pulsoni et al. 2020, 2021; Remus & Forbes 2022). The ex situ component, which is identified as the stellar halo, extends over several kiloparsec from the galaxy centre. It appears in a diffuse form, but can also host stellar streams, shells, or tidal tails that result from repeated accretion events (Cooper et al. 2015). The existence, the morphology, and the stability with time of these structures depend on the mass ratio of the involved satellites, as studied by Mancillas et al. (2019).
In the simulated groups and clusters of galaxies, the ICL appears as a diffuse component at large cluster-centric distances (≥150 kpc). It is made of unbound stars that float in the intra-cluster space and grows with time during the mass-assembly process. The bulk of the ICL is assembled in the redshift range 0 ≤ z ≤ 1, and the ICL fraction (LICL, g/Ltot, g) reaches ∼20−40% at z = 0 (see Contini 2021; Montes 2022, as reviews). The ICL might form from several channels, but mostly arises from the gravitational interactions and merging between the galaxies (Murante et al. 2007), which includes the tidal stripping of satellites, the disruption of dwarf galaxies (see e.g., Rudick et al. 2009; Contini et al. 2014, 2019), and the pre-processing in groups (Mihos et al. 2005; Rudick et al. 2006; Joo & Jee 2023; Contini et al. 2024a); for stellar population differences between the extended BCG haloes and the ICL, see the review by Arnaboldi & Gerhard (2022). As a consequence, a larger amount of ICL is expected in more evolved environments, that is, when galaxies have experienced many interactions.
On the observational side, the detection and analysis of these structures are the most challenging tasks because stellar haloes and the ICL are diffuse and extremely faint. With their the long integration times and incrementally larger covered areas, the focused deep multi-band imaging and spectroscopic surveys in the past two decades have delivered data with a depth (μg ≃ 28 − 31 mag/arcsec2) and resolution that enabled the detection of galaxy outskirts and ICL. The extensive analyses of the light and colour distributions, kinematics, and stellar populations in different environments have been presented in many studies (see e.g. Duc et al. 2015; Iodice et al. 2016; Mihos et al. 2017; Spavone et al. 2020; Danieli et al. 2020; Trujillo et al. 2021; Miller et al. 2021; Spavone et al. 2022; Gilhuly et al. 2022, and references therein). The comparison of the observations with theoretical predictions provides new ways to study the mass assembly in these different environments.
Differently from simulated images, the ex-situ component cannot be unambiguously separated from the in-situ component based on deep observations alone. At the transition radius, both contribute equally to the light. In addition, at larger galactocentric distances, the ICL may also contribute to the stellar halo light, and the two may have indistinguishable surface brightness and colours.
To overcome this limitation, the widely adopted method for setting the size scales of the main components that dominate the light distribution as a function of radius is the multi-component fit of the azimuthally averaged surface brightness profiles (see e.g. Trujillo & Fliri 2016; Spavone et al. 2017; Zhang et al. 2019; Kluge et al. 2020; Gonzalez et al. 2021; Montes et al. 2021, and references therein). Using this approach, a lower limit to the amount of the accreted mass in a galaxy is derived by reproducing the light distribution out to the faintest levels. This value was derived for a statistically significant sample of galaxies in groups and clusters and was found to be consistent with the theoretical predictions, where a higher accreted mass (i.e. the ex-situ component), which reaches 80%−90% of the total light, is found in massive galaxies, that is, galaxies with a stellar mass of ∼1012 M⊙ (see Spavone et al. 2020).
The measured radial velocities of the discrete tracers such as GCs and planetary nebulae (PNe) are a powerful tool for estimating the transition radius between the bound stellar haloes to the unbound envelope and, eventually, the ICL (e.g. Coccato et al. 2013; Longobardi et al. 2013; Forbes 2017; Spiniello et al. 2018; Hartke et al. 2018, 2020). In particular, the number density distribution of the GCs and PNe at larger distances from the galaxy centre was found to follow the shape of the light profile of the stellar envelope, which is shallower than the light profile in the central regions of the parent galaxy (see e.g., Longobardi et al. 2015; Iodice et al. 2016). In addition, the spatial projected distribution of the blue GCs correlates with the detected ICL in clusters of galaxies (Durrell et al. 2014; D’Abrusco et al. 2016; Iodice et al. 2017a; Madrid et al. 2018; Cantiello et al. 2020).
The most challenging task is the detection of the ICL in deep images. This requires an ad hoc observing strategy to determine the best estimate of the background and the modelling of the light from the brightest cluster members. To date, several methods have been efficiently used to detect the ICL in groups and clusters using ground- and space-based telescopes (see Montes 2022; Montes & Trujillo 2022; Brough et al. 2024). Based on this, several observational properties of the ICL were derived, such as the 2D projected distribution, colour, and metallicity, which are used to distinguish between the main formation channels of this component (see Iodice et al. 2017b; Mihos et al. 2017; DeMaio et al. 2018; Montes et al. 2021; Ragusa et al. 2021). Montes & Trujillo (2019) showed that the ICL can be used as the luminous tracer of the DM.
However, one of the most debated issues is the correlation between the fraction of ICL and the virial mass of the host environments and the scatter around it, which can provide useful information on the dynamical state of the host (e.g. Contini et al. 2024b). According to several theoretical works, the fraction of ICL (fICL) does not show any trend. It ranges from 20% to 40% in the halo mass range Mvir ≃ 1013 − 1015 M⊙ (see Rudick et al. 2011; Contini et al. 2014, and references therein). Conversely, increasing values of fICL from 20% up to 40% have been predicted with increasing Mvir (Pillepich et al. 2018), but the opposite trend was also predicted, where a decreasing fICL from ∼50% to ∼40% with increasing Mvir was found (Cui et al. 2013). Based on the increased statistics in the ICL detection over a wide range of virial masses (∼1012.5 ≤ Mvir ≤ 1015.5 M⊙), observational evidence emerges that fICL and Mvir of the host environment are not significantly correlated (Ragusa et al. 2023).
We focus on a nearby galaxy cluster, Hydra I (see Sect. 2), for which we map the light distribution down to the LSB regime in order to detect and study the stellar haloes, including any remnant feature resulting from the gravitational interactions, and the ICL. The main goal of this work is to address the assembly history of this cluster by studying the structure of the galaxy outskirts, constraining the accreted mass fraction of the brightest cluster member (BCG), and estimating the ICL fraction. In the following section, we provide a short review on the main properties of the Hydra I cluster. In Sects. 3 and 4 we present the data and the analysis we performed, respectively. Our results are described in Sect. 5 and discussed in Sect. 6.
2. Hydra I cluster of galaxies
Hydra I is a rich and massive (Mdyn ∼ 1014 M⊙, Girardi et al. 1998) cluster of galaxies located at 51 ± 4 Mpc (Christlein & Zabludoff 2003). According to Richter et al. (1982) and Richter (1987), Hydra I is quite isolated in redshift space for a range of 40 − 50 Mpc in front and behind the cluster along the line of sight. The X-ray emission detected out to ∼200 kpc from the cluster core is centred on the brightest cluster galaxy (BCG) NGC 3311, but is slightly displaced north-west (NW, Hayakawa et al. 2004, 2006).
The region of the cluster core was widely studied in the past ten years. It is dominated by the light of the BCG, NGC 3311, and the other early-type bright member NGC 3309, which lies close in projection to NGC 3311 on the NW side. Previous studies of the light distribution of these two galaxies suggested that they are both embedded in a diffuse and extended stellar envelope that is off-centred in the NE direction (Arnaboldi et al. 2012). By combining the light distribution and stellar kinematics of the Hydra I cluster core, several works revealed (i) stellar debris in the stellar envelope, which might result from the disruption of infalling dwarf galaxies, (ii) multiple components in the line-of-sight velocity dispersion of the PNe, suggesting the existence of several different dynamical structures, and of (iii) higher velocity dispersion than the central galaxy regions, indicating that stars are gravitationally driven by the cluster potential (Arnaboldi et al. 2012; Ventimiglia et al. 2011; Richtler et al. 2011; Hilker et al. 2018; Barbosa et al. 2021). All these features are signs of an active mass assembly around NGC 3311. In particular, the velocity displacement measured between NGC 3311 and the barycentre suggests that the central part of NGC 3311 sloshes with respect to its outskirt. This is a clear sign of sub-cluster merging (Barbosa et al. 2018).
Using the Widefield ASKAP L-band Legacy All-sky Blind surveY (WALLABY) pilot survey with the Australian Square Kilometre Array Pathfinder (ASKAP), which covers the Hydra I cluster out to ∼4 Mpc (∼2.5 Rvir), Wang et al. (2021) found that nearly two-thirds of the galaxies within 1.25 Rvir show signs of ram pressure stripping (RPS) in the early stages. Two of these galaxies, NGC 3312 and NGC 3314A, are located SE of the core, in a foreground group of galaxies, and the RPS was also studied in detail using MeerKat data by Hess et al. (2022).
The Hydra I cluster hosts a large population of dwarf galaxies. There are 317 candidates in the magnitude range −18.5 < Mr < −11.5 mag. The first sample of dwarf galaxies was provided by Misgeld et al. (2008) and was detected in a small area around the cluster core. Using a larger and deep-imaging mosaic, La Marca et al. (2022a) found more than 200 new candidates, 32 of which are LSB galaxies, including ultra-diffuse galaxies (UDGs; Iodice et al. 2020a; La Marca et al. 2022b). Integral-field spectroscopic data for all the LSB galaxies have recently been obtained with MUSE at the ESO-VLT (Iodice et al. 2023).
According to the 2D projected distribution of all cluster members, that is, bright and dwarf galaxies, three main overdensities were identified inside 0.4 Rvir in the Hydra I cluster. These are the core, a wider group toward the N, and a structure SE of the cluster core, while the western side of the cluster shows a lower density than the eastern side (La Marca et al. 2022a). The study by La Marca et al. (2022a) also revealed that the fraction of dwarf galaxies decreases toward the cluster centre. This is consistent with the tidal disruption process of the dwarfs in the strong potential well of the cluster core (see Popesso et al. 2006, and references therein). The presence of several sub-groups of galaxies in the Hydra I cluster further supports the scenario that this environment is still in an active assembly phase, where these structures merge into the cluster potential.
3. Observations: Deep optical mosaics for the Hydra I cluster
The deep g- and r-band images of the Hydra I cluster presented in this work were acquired with the VLT Survey Telescope (VST, Schipani et al. 2012) as part of the VST Early-Type Galaxy Survey (VEGAS, Iodice et al. 2021a). VST is now a hosted telescope of the Italian National Institute for Astrophysics1, located at La Silla-Paranal European Southern Observatory (ESO) in Chile. The VST is equipped with the wide-field imager OmegaCAM (Kuijken 2011), which covers a field of view of 1 × 1 deg2 and has a resolution of 0.21 arcsec/pixel.
Observations and data reduction have been described in Iodice et al. (2020b, 2021b) and La Marca et al. (2022a,b). We report the main information for this data set here. The total integration times are 2.8 h in the g band and 3.22 h in the r band, respectively. Images were acquired in dark time using the step-dither observing strategy, which guarantees an accurate estimate of the sky background (see also Iodice et al. 2016; Venhola et al. 2018). The sky field was acquired west (W) of the cluster. This field overlaps by ∼0.3 deg with the 1 deg field centred on the core of the cluster. During the data acquisition, the bright (magnitude 7) foreground star NE of the cluster core was always placed in one of the two wide OmegaCAM gaps in order to reduce the scattered light.
Pre-reduction, calibration, sky-subtraction, and stacking were provided by using the VST-Tube, which is one of the dedicated pipelines for processing OmegaCAM images (Capaccioli et al. 2015). The final sky-subtracted reduced mosaic for the Hydra I cluster extends over 1 deg × 2 deg, corresponding to ∼0.9 × 1.8 Mpc, assuming a distance of 51 Mpc (Christlein & Zabludoff 2003). Therefore, the VST mosaic covers ∼0.4 virial radius around the core of the cluster. The final stacked images reach surface brightness depths of μg = 28.6 ± 0.2 mag/arcsec2 and μr = 28.1 ± 0.2 mag/arcsec2 in the g and r bands, respectively. The median FWHM of the point spread function is 0.85 arcsec in the g band and 0.81 arcsec in the r band.
We focus on an area of 56.7 × 46.6 arcmin2 around the cluster core (Fig. 1), which corresponds to ∼0.4 Rvir. Based on the Christlein & Zabludoff (2003) catalogue, this area includes 44 brightest (mR ≤ 15 mag) cluster members. They are listed in Table 1 and marked in Fig. 1.
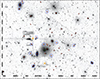 |
Fig. 1. Extracted region of the g-band VST mosaic (0.945 × 0.776 deg ∼0.84 × 0.69 Mpc) of the Hydra I cluster, which corresponds to ∼0.4 Rvir. The brightest galaxy members (mR ≤ 15 mag) from the Christlein & Zabludoff (2003) catalogue are marked as red diamonds. The BCG, NGC 3311, is marked with the green cross. The large blue circles indicate the galaxies whose heliocentric velocity is comparable to or larger than the escape velocity of the cluster in phase-space (see Sect. 6). The orange symbols mark the position of the two brightest foreground stars in the field, which were subtracted from the original mosaic (see Sect. 4.3). As expected, some artefacts are still present close to the subtracted stars, which are caused by non-symmetric scattered light and the haloes of those two brightest stars. N is up, and east (E) is on the left. |
Photometric properties and redshift of the brightest cluster members inside 0.4 Rvir of the Hydra I cluster.
4. Data analysis: Surface photometry
The main goal of this work is to study the outskirts of the brightest cluster members down to the LSB regime and to constrain the ICL fraction in this region of the cluster. To do this, we studied the light distribution in the g and r bands for all galaxies in our sample (see Table 1). We adopted the same methods and tools as previously developed within the VEGAS project for studies of the LSB regime and detection of ICL (see Iodice et al. 2016, 2017a, 2019; Spavone et al. 2018; Cattapan et al. 2019; Raj et al. 2019, and references therein). A detailed description was provided by Ragusa et al. (2021). In short, the main steps of the surface photometry for the Hydra I sky-subtracted mosaic are the following:
-
remove the contamination of the light from the foreground brightest stars in the field and background galaxies by modelling and subtracting it from the parent image;
-
estimate the limiting radius of the photometry (Rlim) and the residual background fluctuations;
-
fit the isophote out to Rlim for all the brightest galaxy members to obtain the azimuthally averaged surface brightness profiles and shape parameters;
-
build the 2D model based on the isophote fit for each galaxy in our sample to be subtracted from the parent image in order to estimate the diffuse light in the residual image.
The tools and methods adopted in each step are briefly described below.
4.1. Contamination of the scattered light from stars
Close to the core of the Hydra I cluster lie two bright stars: HD 92036 (RA = 10:37:13.72 Dec = −27:24:45.49, mB = 6.51 mag), located NE of NGC 3311, and HD 91964 (RA = 10:36:42.57 Dec = −27:39:22.86, mB = 8.17 mag), located south (S) of the core. During the observations, the centre of the brightest star HD 92036 was always placed in one of the two wide OmegaCAM gaps in order to reduce its scattered light. For both objects, we fitted the light distribution out the edge of the field (∼0.5 deg; Fig. 1), assuming circular isophotes. The centre, position angle (PA), and ellipticity were fixed during the run. As a preliminary step, we identified all the background and foreground objects (stars and galaxies) that are brighter than the 2σ background level (see also La Marca et al. 2022b), which were then masked and excluded from the isophote fit. In particular, the core of the group was masked with a circular aperture out to ∼7.7 arcmin (∼13 Reff) from the BCG NGC 3311 (Arnaboldi et al. 2012). Based on the isophote fit, the 2D models of the two stars were built up and then subtracted from the g and r parent images. The resulting image is shown in Fig. 1.
4.2. Estimate of the residual background fluctuations
We overplotted on the star-subtracted residual image in each band the light distribution from the core of the cluster (identified as the centre of NGC 3311) out to the edge of the field (∼0.5 deg) in order to estimate the average value of the residual background level and the limiting radius Rlim for the photometry in this field. The residual background in the sky-subtracted images is the deviation from the background with respect to the average sky frame obtained from the empty fields observed close to the target. Therefore, since the reduced mosaics are sky-subtracted, the residual background level is close to zero in both bands. As explained in Ragusa et al. (2021), light is fitted in circular annuli (i.e. the ellipticity and PA are fixed to zero), with a constant step, where all the foreground and background sources, including the second BCG of Hydra I, NGC 3309, which is close to NGC 3311, were masked accurately. Rlim corresponds to the outermost semi-major axis derived in the isophote fitting, where the light from NGC 3311 blends into the average residual background level. The residual background fluctuations are almost constant for R ≥ Rlim. We found that for NGC 3311, Rlim ∼ 15 arcmin in the g and r bands. For R ≥ Rlim, the residual background levels are Ig = −0.056 ± 0.11 ADU and Ir = −0.6 ± 0.2 ADU in the g and r band, respectively. The residual background value and Rlim were derived for all galaxies in our sample in the g and r bands.
4.3. Isophote fitting
For all galaxies in our sample, we fitted the isophotes with all parameters left free (i.e. centre, ellipticity, and PA). The light distribution was mapped over elliptical annuli by applying a median sampling and k-sigma clipping algorithm. This iterative process was performed as follows. Firstly, we made the isophote fit for NGC 3311 and built a 2D model of the light distribution. This was subtracted from the parent image. The isophote fit of the other bright cluster member in the core, NGC 3309, was performed on the residual image obtained before, and the 2D model for this galaxy was derived and subtracted. In turn, all the galaxies in our sample were studied with the same approach, that is, the isophote fit was performed on the residual image obtained by subtracting the 2D model of the other galaxies studied in the sample.
The main outcome of the isophote fit is the azimuthally averaged surface brightness profile, which was corrected for the residual value of the background estimated for R ≥ Rlim. The total uncertainty on the surface brightness profile (errμ)2 took the uncertainties on the photometric calibration (errzp ∼ 0.3%) and the RMS in the background fluctuations into account (errsky ∼ 10% and errsky ∼ 20% in the g and r bands, respectively). In addition, we derived the g − r colour profiles, the total integrated magnitudes, and the g − r integrated colours. The surface brightness and colour profiles for NGC 3311 are shown in Fig. 2. Those obtained for all the other galaxies in our sample are shown in Appendix A. The total integrated magnitudes and the g − r integrated colours are listed in Table 1.
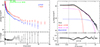 |
Fig. 2. Azimuthally averaged surface brightness of NGC 3311. Left panel: Surface brightness profiles (top panel) in the g (blue points) and r (red points) bands, and g − r colour profile (bottom panel). The dashed green line marks the limit of the surface brightness profiles obtained for NGC 3311 by Arnaboldi et al. (2012). Right panel: g-band surface brightness profile in logarithmic radius (top panel), with the best 1D multi-component fit (see text for details). In the lower panel, we show the Δrms residual of the data minus the model (see text for details). |
4.4. Globular cluster number density
For the Hydra I cluster, we collected a sample of ∼5300 GC candidates obtained from deep U-, V- and I-band photometry observed with VLT/FORS (Mieske et al. 2005; Hilker et al. 2015) extending out to ∼20 arcmin N and E of NGC 3311.
The GCs were selected based on the morphology (point sources) and their location in the V − (V − I) colour-magnitude diagram, guided by radial-velocity-confirmed member GCs (Misgeld et al. 2011). The details of the data reduction and sample selection will be described in a future paper (Lohmann et al., in prep.). We used the spatial distribution of GCs to obtain their average radial number density profile. The profile was constructed considering radial annuli centred on NGC 3311 such that each bin contained a fixed number of GCs. We masked out the GCs associated to NGC 3309 using a circular mask around the galaxy, as well as those forming an overdensity to the east (E), which are associated with the lenticular galaxy NGC 3316. The mask radius was arbitrarily chosen to be 0.9 arcmin, which corresponds to ∼2.3 Re for NGC 3309 and ∼3.5 Re for NGC 3316. By adopting 20 bins for our profile, we obtained ∼250 GCs in each bin, and the uncertainty on the number density was taken to be Poissonian. After correcting for background contaminants, the surface density of the globular clusters in units of arcsec−2 was then shifted arbitrarily to match the surface brightness profile of NGC 3311. The results are shown in Fig. 3.
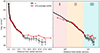 |
Fig. 3. Surface brightness profile of NGC 3311 in the r band (black line) and the radially averaged globular cluster number density profile (red line), arbitrarily shifted to match the surface brightness. The left panel shows the cluster-centric distance on a linear scale, and the right panel uses a log scale. The shaded areas indicate the three regimes observed in the GC number density profile: (I) where incompleteness effects are significant, (II) where the GCs follow the galaxy light, and (III) where the GCs trace the ICL. Region I is also shaded in the left panel for reference. At distances larger than ∼6 arcmin from the centre, the shallower profiles indicate the contribution of the ICL baryons, i.e. diffuse light plus intra-cluster GCs. |
The same sample selection steps included the analysis of a background region located ∼1.5 deg E of Hydra I to select GC-like objects that contaminate our sample. We calculated the number density of these objects and subtracted it from the GC number density profile. The GC sample was also corrected for incompleteness by examining the GC luminosity function in the V band, to which we fitted a Gaussian distribution and determined an absolute peak magnitude of MV = −7.4 mag and σ = 1.1 mag. We then calculated a completeness factor by which the GC counts were to be multiplied, which was ∼2.53. At small radii (≤1.2 arcmin), the detection algorithm failed to identify sources due to the high background light from NGC 3311, leading to an incompleteness in the central regions.
5. Results: Galaxy outskirts, diffuse light, and low surface brightness features
5.1. Cluster core
The core of the cluster is dominated by the extended diffuse envelope around the two brightest cluster galaxies, NGC 3311 and NGC 3309 (Fig. 4). The light distribution was mapped out to 15 arcmin from the centre of NGC 3311, which corresponds to ∼223 kpc (∼0.14 Rvir), and down to μg ∼ 28.5 mag/arcsec2 in the g band (Fig. 2, left panel). This distance coincides with the extension of the detected X-ray emission, centred on the cluster core (Fig. 4). Our new surface brightness profiles are about six times more extended than those obtained in the optical V band by Arnaboldi et al. (2012).
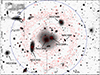 |
Fig. 4. Enlarged region of the Hydra I cluster centred on the core. N is up, and E is left. NGC 3311 and NGC 3309 dominate the cluster centre, while NGC 3312 is visible in the SE. This is member of the SE group. Another two bright galaxies in the core, NGC 3308 and NGC 3307, are also marked in the image. The dashed red contours indicate the X-ray emission from XMM (Hayakawa et al. 2004, 2006). The dashed blue circle marks the outermost radius of 14 arcmin ∼220 kpc, where the surface brightness profiles are mapped, down to μg ∼ 28.5 mag/arcsec2, in the g band. The image is 30.5 × 23.0 arcmin2 wide. |
In Fig. 5 we show a portion of the residual image obtained by subtracting the 2D model of the light distribution of NGC 3311 and NGC 3309, derived from the isophote fit (see Sect. 4.3). This region of the cluster is located NW of the core. Several bright galaxies in this area show distorted isophotes in the outskirts. In detail, HCC009, which is a barred S0 galaxy, has a prominent S-shape in the west-east (WE) direction. A similar morphology is observed for HCC012, which lies close in projection to HCC009 on the W side, where LSB tails are detected N and S. The giant galaxy NGC 3308, located north of the cluster core, which has a similar total magnitude as NGC 3309 (see Table 1), has an extended stellar envelope that is elongated toward the SW. We also confirm the tidal debris associated with the disrupted dwarf HCC026 inside the stellar envelope of NGC 3311, which was discovered by Arnaboldi et al. (2012).
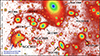 |
Fig. 5. Enlarged region of the Hydra I cluster on the NW side of the core. This is the residual image obtained by subtracting the 2D model of the light distribution of NGC 3311 and NGC 3309 from the isophote fit (see text for details). The image is 14.06 × 7.81 arcmin2 wide. The brightest galaxies in the field are marked. In addition, the dashed black lines indicate the distorted isophotes in the outskirts of HCC092 and HCC012, which might suggest possible ongoing interaction. The dashed blue lines mark the stellar streams of the disrupted dwarf HCC026 identified by (Arnaboldi et al. 2012). The several ripples and arcs are artefacts from the residuals of the overlapping outskirts of NGC 3311 and NGC 3309 with the numerous nearby galaxies, in particular, the bright member NGC 3308. |
5.2. Extended envelope around NGC 3311
Previous studies of imaging data for NGC 3311 revealed that this galaxy is composed of a central and bright component that is well fitted by a Sersic law, and an extended stellar envelope (Arnaboldi et al. 2012). As stated in the previous section, the surface brightness profiles obtained from the VEGAS data are about six times more extended than previous profiles. It shows a change in the slope at ∼4 arcmin, where a shallower decline is observed (Fig. 2, left panel), suggesting an additional outer component. Therefore, we performed a new multi-component 1D fit of the surface brightness profile for NGC 3311 in the g band. We adopted the same approach as proposed in many studies that is also well tested for VST data to fit the surface brightness profiles of BGCs in the cluster of galaxies (see e.g. Spavone et al. 2020, and references therein). In detail, the best fit was obtained with three components: two Sersic laws, which reproduce the brightest and inner regions of the profile, and an outer exponential profile that maps the galaxy outskirts. The results are shown in the right panel of Fig. 2. The best-fit parameters are listed in Table 2.
Best-fit parameters of the multi-component 1D fit of the surface brightness profiles of NGC 3311 in the g band.
The transition radius between the inner two Sersic components is Rtr ≥ 0.2 arcmin (∼3 kpc). The outer exponential component starts to dominate at Rtr ≥ 4.3 arcmin (∼60 kpc). It has a scale length of ∼74 kpc and a total luminosity of ∼1.6 × 10¹¹ L⊙. This corresponds to ∼70% of the total luminosity integrated over the whole profile, which is ∼2.3 × 10¹¹ L⊙. This component traces the stellar envelope around the core of the cluster. We assume that it also includes the ICL in this region because based on the photometry alone, we cannot separate the bound stars in the galaxy stellar halo from those that are gravitationally unbound in the ICL. Based on the total luminosity of the two outer components, that is, the Sersic plus the exponential components, we estimated the accreted mass fraction around NGC 3311, which is fac ∼ 94%. As argued by Remus & Forbes (2022), because cosmological simulations only consider the stars that were already formed at the time of infall as accreted, the accreted fractions derived following the prescriptions of these simulations should be considered as lower limits. As explained in Spavone et al. (2017), fac includes the total luminosity of the second Sersic component plus the outer exponential, which corresponds to the bound and unbound ex situ components, respectively (see also Cooper et al. 2015).
In correspondence with the outer edge of the stellar envelope, that is, Rlim ∼ 15 arcmin ∼223 kpc, we found that the number density of the dwarf galaxy population (La Marca et al. 2022a) as a function of the cluster-centric distance decreases by about 10% with respect to the values at larger radii (Fig. 6). A similar result was found for the Fornax cluster (Venhola et al. 2018).
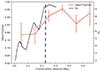 |
Fig. 6. Number density of the compact sources as function of the cluster-centric distance. The number density (left axis) of the dwarf galaxy population (red line) is taken from (La Marca et al. 2022a). The GC-specific frequency (black line, right axis) was derived in this work and is described in Sect. 5.3. The vertical dashed blue line marks the outer edge of the stellar envelope around the core, i.e. Rlim ∼ 15 arcmin ∼223 kpc (see Fig. 2). |
5.3. Diffuse light versus distribution of the globular clusters
Figure 3 shows the radial average number density profile of GCs around NGC 3311 (red line) along with the r-band surface brightness profile (black line). The right panel clearly reveals three different regimes of the number density of GCs, as indicated by the shaded regions. Region I corresponds to the small-radius regime where the incompleteness effects in the GC counts are substantial. As discussed in Sect. 4.4, this is caused by the source detection algorithm, which underestimates the GC numbers. This is mostly caused by the GC number density profile, which traces the galaxy light at distances below ∼1.2 arcmin (∼17.8 kpc) only poorly. Region II spans distances between 1.2 ≤ d ≤ 6.5 arcmin (17.8 ≤ d ≤ 96.4 kpc), where the number density of GCs closely follows the light from NGC 3311. The stellar envelope also starts to dominate in this region (see Barbosa et al. 2018, and Sect. 5.2).
Region III (d ≥ 6.5 arcmin) shows a striking difference between the light distribution and GC profile. At R ≃ 6 arcmin, the GC profile shows a shallower decrease than the surface brightness profile. At this radius, the extended exponential surface brightness profile starts to dominate (Fig. 3). Therefore, region III not only marks a change in the surface brightness behaviour, but also in the mixture of stars and GC systems. The left panel of Fig. 3 shows that for R ≥ 6 arcmin, there are more GCs by factor of ∼2.5 than what is expected from the stars that contribute to the surface brightness profile. Therefore, at large distances, there are 2.5 times more GCs per unit galaxy light than in the inner region. This is a strong indication of the transition between the galaxy stellar halo and the ICL-dominated regime. The connection between the flattening in the GC number density and this change in regime was also reported in previous works. Durrell et al. (2014) studied the GC population in the Virgo galaxies M87 and M49 and found that their GC number density also flattens at large distances due to the shallow profile of blue GCs, which are connected to the ICL of Virgo. Moreover, studying planetary nebulae (PNe) in M87, Longobardi et al. (2015) found that intracluster PNe have a shallower profile than those belonging to the M87 halo. Similar results were obtained for the blue GCs around the central Fornax cluster galaxy NGC 1399 (Schuberth et al. 2010; Cantiello et al. 2018).
Finally, we derived the specific frequency SN profile using the GC number density and the surface brightness profiles by integrating them in each annulus. This is not the classical definition of SN, which typically considers the total galaxy luminosity in the calculation, while we only considered the light inside each respective annulus here. The SN profile as a function of cluster-centric distance is plotted in Fig. 6, which shows that at larger distances from NGC 3311, an excess of GCs is observed, with a specific frequency that is about four times higher than in the central regions. A similar trend is observed for the number density of the dwarf galaxies, as discussed in Sect. 5.1.
5.4. Disrupting dwarf in the outskirt of NGC 3316
On the SE side of the cluster core lies the fifth brightest member, NGC 3316 (Fig. 4), which has a systemic velocity comparable to that of NGC 3311 (see Table 1). The new deep VEGAS data show that this galaxy, classified as a barred S0, has an extended boxy outskirt, where we found a prominent arc-like stellar stream on the SW side (Fig. 7, left panel). From the isophote fit, we built the 2D model of the light distribution, which was subtracted from the parent image to obtain the residual map (see the middle and right panels in Fig. 7). The stellar SW stream clearly stands out from the residuals and, in addition, it seems to be connected to a bright knot on the N side. This feature might result from a disrupted dwarf galaxy that interacted with NGC 3316.
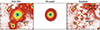 |
Fig. 7. Outskirts of the early-type galaxy NGC 3316, located E of the core. The g-band region centred on NGC 3316 is shown in the left panel. We mark the prominent stellar stream on the SW side of the galaxy. The 2D model obtained from the isophote fit is shown in the middle panel. The right panel shows the residual image, where the 2D model (middle panel) is subtracted from the parent image (left panel). The stellar stream seems to be connected with a bright knot on top of it. Both features might be the remnant of dwarf galaxy, disrupted in the potential well of NGC 3316. |
To further support this hypothesis, we derived the integrated magnitudes and colours for the bright knot and the stream, which are mg = 19.6 ± 0.2 mag and g − r = 0.5 ± 0.3 mag, and mg = 21.8 ± 0.2 mag and g − r = 0.7 ± 0.3 mag, respectively. The g − r colours for both structures are consistent with the range of colours found for the dwarf galaxies in the Hydra I cluster, which is 0.2 ≤ g − r ≤ 1 mag (La Marca et al. 2022a).
5.5. North group and HCG048 group
The over-density of galaxies located in the north with respect to the cluster core is mainly distributed along a filament-like structure that extends in projection in the north-south (NS) direction (Fig. 8). In this region of the cluster, we found several LSB features that we describe below.
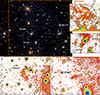 |
Fig. 8. Structure and LSB feature in the group north of the core of the Hydra I cluster. Top left panel: Colour-composite image of the group, where the brightest members are marked. The image size is 15 × 15 arcmin2. N is up, and E is left. The dashed orange box indicates the region where diffuse light is detected after all bright sources (stars and galaxies) were modelled and subtracted from the image. The residual is shown in the top right panel. On the NE side, the red circle marks the S-shape LSB feature detected on this side of the group, which is also shown in the lower left panel. The dashed blue box marks the region where the peculiar galaxy HCC 005 and the disrupted dwarf galaxy HCC 087 are located, which is shown in the lower right panel. |
In the outskirts of the S0 galaxy HCC005, we discovered a thick and extended tail in the SE-NW direction that is about twice longer than the inner bright regions of the galaxy (see the middle right panel of Fig. 8). This structure has a total integrated magnitude in the g band of mg = 18.08 mag and an average colour of g − r = 0.73 mag. The latter value is consistent with the integrated g − r colour of the galaxy, which is 0.78 mag (see Table 1), as well as with the g − r colour measured in the outskirts (see colour profile in Fig. A.1). The similar colours might suggest that this structure is connected with HCC005 as the result of a recent gravitational interaction. Alternatively, given the quite regular shape of the outer galaxy isophotes, we cannot exclude that this structure is in projection behind HCC005.
SE of HCC005, we also detect the faint (μ0 ∼ 26.2 mag/arcsec2, in the g band) tidally disrupted dwarf galaxy HCC087, which was previously discovered by Misgeld et al. (2008) and was studied in detail by Koch et al. (2012). It has a peculiar S-shape, which is a classic signature of an interaction (see the lower right panel of Fig. 8).
After we modelled and subtracted all the brightest sources (i.e. galaxies and stars) in this region of the cluster from the parent image, the residual shows an extended patch of diffuse light (see the top right panel of Fig. 8). Its total luminosity integrated over the whole area is L ∼ 6 × 10⁹ L⊙ and the integrated colour is g − r = 0.64 ± 0.5 mag. This value is comparable with the average g − r colour of the stellar envelope around NGC 3311 in the core, which also includes the ICL, where 0.5 ≤ g − r ≤ 1 mag for R ≥ Rtr = 4.4 arcmin.
In the same region where ICL is found, we detected a peculiar S-shape LSB feature, located NE (see the lower left panel of Fig. 8). It has a total extension of ∼2 arcmin ∼29 kpc. The average surface brightness in the g band is μg ∼ 27 mag/arcsec2, and the average colour is g − r ∼ 0.68 mag. The total luminosity is Lg ∼ 7 × 10⁷ L⊙. This structure seems to contain many star-like objects that resemble GCs. We verified that it is not a high-redshift cluster of galaxies. Because it is so extended, it seems unlikely that it originated from a disrupted dwarf galaxy. It might be connected with the ICL in this region of the cluster because the colours are quite similar. This intruding structure will be the subject of future follow-up studies, in which we focus on the selection and study of the GC population in the Hydra I cluster (Mirabile et al., in prep.).
In the north-east (NE) region of the cluster, at about 0.45 Mpc from the core, lies the compact group of galaxies HCG 048, which is also associated with the Hydra I cluster. This system consists of four galaxies: the brightest member, HCG 048A (IC 2597), an elliptical galaxy, and three further galaxies that are dimmer and extended, which are the spiral galaxy HCG 048B in the SE and two ETGs, HCG 048C and HCG 048D in the NW (Fig. 9). Based on the heliocentric velocity, HCG 048B is a foreground galaxy with respect to the other group members (see also Table 1). According to Jones et al. (2023), HCG 048 is likely a false group, and HCG 048C and HCG 048D are a background pair. The extended stellar envelope associated with the brightest group member, HCG 048A, dominates the light distribution of the whole group. The surface brightness profile extends out to 3 arcmin ∼44 kpc from the centre of HCG 048A and down to μg ∼ 28 mag/arcsec2 (Fig. A.1). Using the method described in Sect. 5.1, we performed a multi-component fit to reproduce these profiles in the g band. The results are shown in Fig. 10, and the best-fit structural parameters are listed in Table 3. We found that the extended outer stellar envelope is well fitted by an exponential law, with a scale length of rh = 42.29 ± 0.14 arcsec, which dominates the light distribution for Rtr ≥ 28.3 arcmin (∼7 kpc). This component, which includes the stellar halo and the intra-group light, has a total luminosity of L = 5.3 × 10¹⁰ L⊙, which corresponds to ∼49% of the total luminosity of HCG 048A.
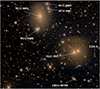 |
Fig. 9. Colour-composite picture of the NE side of the Hydra I cluster. N is up, and E is left. The size of the picture is 18.37 × 16.21 arcmin2. In the upper left corner lies the HCG048 group, where the group members are labelled. In the lower right corner the other two bright cluster members, NGC 3315 and LEDA 087328 (see also Table 1) are marked. In addition, one of the UDGs detected in the cluster by Iodice et al. (2020a), UDG 4, is also marked in the figure. |
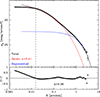 |
Fig. 10. Azimuthally averaged surface brightness profile of HCG48A in the g band. The best 1D multi-component fit is shown in the top panel. In the lower panel, we show the Δrms residual of the data minus the model (see text for details). |
Best-fit parameters of the multi-component 1D fit of the surface brightness profiles of HCG 048A in the g band.
5.6. South-west group
According to the systemic velocities derived by Christlein & Zabludoff (2003), a group of foreground galaxies lies in the SE region with respect to the core. The brightest galaxies of this group are NGC 3312 and NGC 3314A (see Fig. 11). This group is dominated by late-type galaxies.
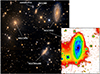 |
Fig. 11. Colour-composite picture of the SE group. N is up, and E is left. The size of the image is 12.50 × 13.77 arcmin2. In the bottom part lie the two overlapping spirals, NGC 3314A\B (see Iodice et al. 2021b), while in the upper right corner lies NGC 3312. In NE, a bright lenticular galaxy is visible, NGC 3316, which is in the background of the group at a similar redshift as the galaxies in the core. The lower right box shows an enlarged region around NGC 3312 to enhance the extended stellar filaments on the SW side of the galaxy, due to RPS. They are marked with the two dashed lines. |
NGC 3312 is a spiral galaxy, the third brightest galaxy inside 0.4 Rvir of the cluster. The deep images presented in this work show stellar filaments extending in the SW direction (see the right panel of Fig. 11). This structure, together with the sharp edge on the NE side of the galaxy, is consistent with the ongoing RPS process detected in this galaxy based on the HI data from the WALLABY survey (Wang et al. 2021, and confirmed by the MeerKAT data Hess et al. 2022). In particular, the stellar filaments found in the VST images are spatially coherent with those detected from the HI gas (Fig. 12). The surface brightness profiles for NGC 3312 in the g and r bands and the g − r colour profile from the VST images are shown in Fig. A.1.
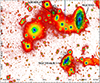 |
Fig. 12. SE group of the Hydra I cluster of galaxies. The black contours mark the emission of the neutral HI gas from the WALLABY survey (Wang et al. 2021). |
South of NGC 3312 lies the system of two spiral galaxies NGC 3314A\B, seen in projection on top of each other along the line of sight. NGC 3314A is the foreground galaxy, with a heliocentric velocity of cz = 2795 km s−1 (Christlein & Zabludoff 2003), and NGC 3314B lies in the background with cz = 4665 km s−1 (Keel & White 2001). As a result, the surface brightness and the g − r color profiles, shown in Fig. A.1, are the contribution to the light of both galaxies, which are indistinguishable along the line of sight. Iodice et al. (2021b) recently studied NGC 3314A in detail using the deep VST images presented in this work. They found that this galaxy shows a network of stellar filaments in the SW direction that are more extended than those detected in NGC 3312. They reach a radius of ∼50 kpc from the galaxy centre. The HI data that are also available for this galaxy (Fig. 12) show that they have the HI counterpart that can be explained by RPS acting on this galaxy (Wang et al. 2021; Hess et al. 2022).
On the E side of NGC 3312 lies a peculiar dwarf galaxy called AM1035−271A (see Figs. 11 and 12), which shows an extended HI emission. Being a dwarf, this galaxy is excluded from the sample listed in Table 1. Having a systemic velocity of Vsys = 2763 km/s (Christlein & Zabludoff 2003), this is also a member of the SE foreground group. The optical images for this galaxy show a very disturbed morphology, where two luminous arm-like structures are found on each side with respect to the centre. They might be affected by dust absorption. For this galaxy, differently from the other two giants NGC 3312 and NGC 3314A, the HI emission is more extended than the optical light, where HI tails in the SW direction are found. This indicates that RPS also acts on this galaxy.
6. Discussion: Assembly history of the Hydra I cluster
We analysed deep images in the optical g and r bands of the Hydra I cluster of galaxies that were obtained with the VST during the VEGAS project. The VST mosaic covers ∼0.4 Rvir around the core of the cluster (Fig. 1), and we mapped the light distribution down to μg ∼ 28 mag/arcsec2 on average.
According to the redshift estimates by Christlein & Zabludoff (2003), this region of the cluster contains 44 cluster members that are brighter than mB ≤ 16 mag. They are listed in Table 1. In addition, more than 200 dwarf galaxies (with mB > 16 mag), including UDGs, were recently discovered, and based on the colour-magnitude relation, they also reside in this area and can be considered cluster members (La Marca et al. 2022a,b). The projected distribution of all cluster members (bright galaxies and dwarfs) suggests that the bulk of galaxy light is concentrated in the cluster core, as expected, where the X-ray emission is also found. In addition, two further galaxy overdensities are found in the north and SE with respect to the cluster core.
We analysed the light distribution of all bright cluster members in these three sub-structures of the cluster. Our results are listed below.
-
Most of the diffuse light, LSB features, and signs of gravitational interaction between galaxies reside in the core, in the north group, and in the Hickson compact group HCG048.
-
The extended stellar filaments in the SW direction in the two brightest members NGC 3312 and NGC 3314A, which coincide with the HI emission, and can be associated with the ongoing RPS process.
-
The light distribution in the core is mapped down to μg ∼ 28 mag/arcsec2 in the g band and out to ∼223 kpc. We found that the extended and diffuse stellar halo around the BGC, NGC 3311, contributes ∼70% of the total luminosity. It therefore is the dominant stellar component in the cluster core.
-
The extended stellar envelope around NGC 3311 coincides with the X-ray emission detected in this region of the cluster.
-
In the cluster core, by comparing the GCs distribution with the surface brightness distribution, we found a shallower profile in the region where the stellar envelope and ICL dominate.
-
The ICL is detected in the cluster core, north group, and HCG048, with a total luminosity of
 L⊙,
L⊙,  L⊙, and
  L⊙, respectively.
 -
The specific frequency of GCs increases in the ICL region, and there is a deficit of dwarf galaxies in the very centre.
The presence of sub-structures, the detection of the stellar debris as typical features of the gravitational interactions, and the ongoing RPS further confirm that the Hydra I cluster is still in an active assembly physe. By combining the projected phase-space (PPS) of the Hydra I cluster with the observed properties, including the new measurements and detection reported in this paper, we traced the different stages of the assembly history.
The PPS was derived by using the redshift for all cluster members published by Christlein & Zabludoff (2003) and those recently measured for the LSB galaxies by Iodice et al. (2023). The PPS is shown in Fig. 13. To derive the VLOS/σLOS for the PPS, we assumed Vsys = 3683 ± 46 km/s and σcluster ∼ 700 km/s as the mean cluster velocity and velocity dispersion, respectively (Christlein & Zabludoff 2003; Lima-Dias et al. 2021). Based on the PPS, inside 0.4 Rvir of the cluster (which is the region studied in this work) most of the cluster members are located in the early-infall region, where galaxies joined the cluster potential more than 10 Gyr ago (Rhee 2018). Therefore, they have experienced repeated interactions and merging, which contributed to the build-up of the stellar haloes and ICL. This is indeed the region where we have detected the extended stellar halo and ICL around the BGC NGC 3311 in the core and the diffuse light in the north group. In both sub-structures of the cluster, we also found many signs of past interactions between galaxies in the outskirts in the form of tidal tails or stellar streams or ripples (Fig. 5). PPS has also been used by Forbes et al. (2023) to examine a sample of UDGs in the Hydra I cluster. This analysis led to the conclusion that UDGs are among the earliest infallers in Hydra.
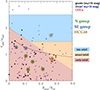 |
Fig. 13. Projected phase-space diagram of the cluster members in Hydra I inside the VST mosaic, i.e. ∼0.4 Rvir. The giants and brightest galaxies (mB < 16 mag) and the dwarf galaxy population by Christlein & Zabludoff (2003) are marked with filled black circles and blue triangles, respectively. The newly confirmed UDGs in the cluster by Iodice et al. (2023) are marked with red asterisks. The solid black line corresponds to the cluster escape velocity. The shaded regions of the diagram indicate the infall times as predicted by Rhee et al. (2017), and reported in the legend on the right. The brightest members of the sub-groups of galaxies identified in the clusters (i.e. north group, SE group, and HCG48 group) are also marked with coloured circles, as listed on the right side of the figure. |
In the PPS, the SE group and HCG048 group are found close to the escape velocity of the cluster, except for the spiral galaxy HCG48B, which is located in the late infall region. The deep images presented in this work have further confirmed that the SE group, falling into the cluster potential, interacts with the hot intra-cluster medium, inducing the RPS, as seen in the HI emission and from the optical counterparts we showed here (Fig. 12).
Based on the PPS, the ICL is detected in the virialised regions of the cluster, that is, the core and north group, where signs of tidal interactions and accretion of small satellites are still present. This might suggest that these are the main channels that contribute to the ICL formation. These processes create the population of intra-cluster GCs, which are also detected in the cluster core, having a cospatial distribution with the diffuse stellar envelope around NGC 3311. In addition, inside ∼15 arcmin from the centre of NGC 3311 (∼223 kpc), where the extended diffuse stellar halo and X-ray emissions dominate, we found a decreasing projected number density of dwarf galaxies (Fig. 6). This is an indication that these low-mass systems might have been disrupted by the strong tides in this region of the cluster, contributing to the diffuse stellar component around NGC 3311.
Based on the PPS, the small compact group of HCG048 located NE from the core will be accreted onto the cluster. The intra-group light is clearly visible around the dominant group member (Fig. 9), HCG048A, and it will contribute to the total budget of the ICL when the process is completed. As described in Sect. 1, this would further support the idea that the pre-processing in groups is one of the formation channels of the ICL.
The total amount of the ICL, estimated on the whole region of the cluster covered by the VST mosaic, is LICL ∼ 2.2 × 10¹¹ L⊙. This includes the ICL in the core, the ICL in the north, and the intra-group light in HCG048. The total luminosity of the cluster inside 0.4 Rvir that is covered by the VST mosaic is LTOT ∼ 1.8 × 10¹² L⊙, and the fraction of the ICL therefore is fICL = LICL/LTOT ∼ 12%. This value is fully consistent with values of fICL for other clusters of galaxies with a virial mass comparable to that of Hydra I, that is, Mvir ∼ 1014 M⊙. In particular, for clusters and groups in the nearby Universe (i.e. z ≤ 0.05), in the mass range 13.5 ≤ log Mvir ≤ 14.5 M⊙, the ICL fraction ranges from ∼10% up to ∼45% (see Kluge et al. 2020; Ragusa et al. 2023, and references therein).
In summary, the large covered area and the long integration time that were available for mapping the central regions of the Hydra I cluster down to the LSB regime allowed us to trace the final stage of the mass assembly inside the core of the cluster. In this region, the ICL is already in place, but many remnants of the interactions and mergers between galaxies are still present, and they also contribute to the total amount of diffuse light. We have acquired deep VST images for three additional fields around the core of the cluster, covering the E and SE regions. For future work, we aim to explore these lower-density regions to derive an extended density map of the cluster members and compare their structure and colours with those found in the core. This analysis would enrich the picture we have traced of the assembly history of the Hydra I cluster.
Finally, the region of the Hydra I cluster will be covered by the ongoing Euclid Wide Survey (Euclid Collaboration 2024) with the Euclid space telescope and the approaching Legacy Survey of Space and Time (LSST) with the Rubin Observatory (Brough et al. 2024). The data presented in this paper approach in depth and resolution those expected from the observing facilities cited above, even if in limited areas of the sky. This work (as many of the focused deep multi-band imaging surveys that were carried out in the last decade) can therefore provide a preview of the science that will soon be delivered by the new surveys, and it represents a testbed for building the knowledge required for managing the upcoming massive data sets.
As detailed in Seigar et al. (2007), Capaccioli et al. (2015), Iodice et al. (2016), the total uncertainty is derived as err , where N is the number of pixels used in the isophote fit, adu is the analog digital unit and
  .
.
The completeness factor was calculated using the Gaussian fit to the luminosity function of our GCs. We first integrate the function from −∞ to +∞ to get the total number of GCs that we expect from the LF. We then integrate the function from −∞ to our limiting absolute magnitude (around −7.7) to get the expected number of observed GCs. We then divide the two numbers and get the factor of 2.5.
Acknowledgments
The authors are very grateful to the referee, Emanuele Contini, for his comments and suggestions which helped to improve and clarify the work. This work is based on visitor mode observations collected at the European Southern Observatory (ESO) La Silla Paranal Observatory within the VST Guaranteed Time Observations, Programme ID: 099.B-0560(A). EI, MS and MC acknowledge the support by the Italian Ministry for Education University and Research (MIUR) grant PRIN 2022 2022383WFT “SUNRISE”, CUP C53D23000850006 and by VST funds. EI, MS, MC acknowledge funding from the INAF through the large grant PRIN 12-2022 “INAF-EDGE” (PI L. Hunt). ALM acknowledges financial support from the INAF-OAC funds. EMC acknowledges support by Padua University grants DOR 2020-2023, by Italian Ministry for Education University and Research (MIUR) grant PRIN 2017 20173ML3WW-001, and by Italian National Institute of Astrophysics (INAF) through grant PRIN 2022 C53D23000850006. GD acknowledges support by UKRI-STFC grants: ST/T003081/1 and ST/X001857/1. Authors acknowledge financial support from the VST INAF funds.
References
- Arnaboldi, M., & Gerhard, O. 2022, Front. Astron. Space Sci., 9, 403 [NASA ADS] [CrossRef] [Google Scholar]
- Arnaboldi, M., Ventimiglia, G., Iodice, E., Gerhard, O., & Coccato, L. 2012, A&A, 545, A37 [NASA ADS] [CrossRef] [EDP Sciences] [Google Scholar]
- Barbosa, C. E., Arnaboldi, M., Coccato, L., et al. 2018, A&A, 609, A78 [NASA ADS] [CrossRef] [EDP Sciences] [Google Scholar]
- Barbosa, C. E., Spiniello, C., Arnaboldi, M., et al. 2021, A&A, 649, A93 [NASA ADS] [CrossRef] [EDP Sciences] [Google Scholar]
- Brough, S., Ahad, S. L., Bahé, Y. M., et al. 2024, MNRAS, 528, 771 [NASA ADS] [CrossRef] [Google Scholar]
- Bullock, J. S., & Johnston, K. V. 2005, ApJ, 635, 931 [Google Scholar]
- Bullock, J. S., Kravtsov, A. V., & Weinberg, D. H. 2001, ApJ, 548, 33 [NASA ADS] [CrossRef] [Google Scholar]
- Cantiello, M., D’Abrusco, R., Spavone, M., et al. 2018, A&A, 611, A93 [NASA ADS] [CrossRef] [EDP Sciences] [Google Scholar]
- Cantiello, M., Venhola, A., Grado, A., et al. 2020, A&A, 639, A136 [NASA ADS] [CrossRef] [EDP Sciences] [Google Scholar]
- Capaccioli, M., Spavone, M., Grado, A., et al. 2015, A&A, 581, A10 [NASA ADS] [CrossRef] [EDP Sciences] [Google Scholar]
- Cattapan, A., Spavone, M., Iodice, E., et al. 2019, ApJ, 874, 130 [Google Scholar]
- Christlein, D., & Zabludoff, A. I. 2003, ApJ, 591, 764 [Google Scholar]
- Coccato, L., Arnaboldi, M., & Gerhard, O. 2013, MNRAS, 436, 1322 [Google Scholar]
- Contini, E. 2021, Galaxies, 9, 60 [NASA ADS] [CrossRef] [Google Scholar]
- Contini, E., & Gu, Q. 2021, ApJ, 915, 106 [NASA ADS] [CrossRef] [Google Scholar]
- Contini, E., De Lucia, G., Villalobos, Á., & Borgani, S. 2014, MNRAS, 437, 3787 [Google Scholar]
- Contini, E., Yi, S. K., & Kang, X. 2019, ApJ, 871, 24 [Google Scholar]
- Contini, E., Jeon, S., Rhee, J., Han, S., & Yi, S. K. 2023, ApJ, 958, 72 [NASA ADS] [CrossRef] [Google Scholar]
- Contini, E., Rhee, J., Han, S., Jeon, S., & Yi, S. K. 2024a, AJ, 167, 7 [NASA ADS] [CrossRef] [Google Scholar]
- Contini, E., Han, S., Jeon, S., Rhee, J., & Yi, S. K. 2024b, ApJ, 962, L10 [CrossRef] [Google Scholar]
- Cook, B. A., Conroy, C., Pillepich, A., Rodriguez-Gomez, V., & Hernquist, L. 2016, ApJ, 833, 158 [Google Scholar]
- Cooper, A. P., D’Souza, R., Kauffmann, G., et al. 2013, MNRAS, 434, 3348 [Google Scholar]
- Cooper, A. P., Parry, O. H., Lowing, B., Cole, S., & Frenk, C. 2015, MNRAS, 454, 3185 [Google Scholar]
- Cui, W., Murante, G., Monaco, P., et al. 2013, MNRAS, 437, 816 [Google Scholar]
- D’Abrusco, R., Cantiello, M., Paolillo, M., et al. 2016, ApJ, 819, L31 [CrossRef] [Google Scholar]
- Danieli, S., Lokhorst, D., Zhang, J., et al. 2020, ApJ, 894, 119 [Google Scholar]
- DeMaio, T., Gonzalez, A. H., Zabludoff, A., et al. 2018, MNRAS, 474, 3009 [Google Scholar]
- Duc, P.-A., Cuillandre, J.-C., Karabal, E., et al. 2015, MNRAS, 446, 120 [Google Scholar]
- Durrell, P. R., Côté, P., Peng, E. W., et al. 2014, ApJ, 794, 103 [NASA ADS] [CrossRef] [Google Scholar]
- Euclid Collaboration (Mellier, Y., et al.) 2024, A&A, submitted [arXiv:2405.13491] [Google Scholar]
- Forbes, D. A. 2017, MNRAS, 472, L104 [NASA ADS] [CrossRef] [Google Scholar]
- Forbes, D. A., Gannon, J., Iodice, E., et al. 2023, MNRAS, 525, L93 [NASA ADS] [CrossRef] [Google Scholar]
- Gilhuly, C., Merritt, A., Abraham, R., et al. 2022, ApJ, 932, 44 [NASA ADS] [CrossRef] [Google Scholar]
- Girardi, M., Borgani, S., Giuricin, G., Mardirossian, F., & Mezzetti, M. 1998, ApJ, 506, 45 [NASA ADS] [CrossRef] [Google Scholar]
- Gonzalez, A. H., George, T., Connor, T., et al. 2021, MNRAS, 507, 963 [NASA ADS] [CrossRef] [Google Scholar]
- Hartke, J., Arnaboldi, M., Gerhard, O., et al. 2018, A&A, 616, A123 [NASA ADS] [CrossRef] [EDP Sciences] [Google Scholar]
- Hartke, J., Arnaboldi, M., Gerhard, O., et al. 2020, A&A, 642, A46 [NASA ADS] [CrossRef] [EDP Sciences] [Google Scholar]
- Hayakawa, A., Furusho, T., Yamasaki, N. Y., Ishida, M., & Ohashi, T. 2004, PASJ, 56, 743 [NASA ADS] [Google Scholar]
- Hayakawa, A., Hoshino, A., Ishida, M., et al. 2006, PASJ, 58, 695 [NASA ADS] [Google Scholar]
- Hess, K. M., Kotulla, R., Chen, H., et al. 2022, A&A, 668, A184 [NASA ADS] [CrossRef] [EDP Sciences] [Google Scholar]
- Hilker, M., Barbosa, C. E., Richtler, T., et al. 2015, IAU Symp., 309, 221 [NASA ADS] [Google Scholar]
- Hilker, M., Richtler, T., Barbosa, C. E., et al. 2018, A&A, 619, A70 [NASA ADS] [CrossRef] [EDP Sciences] [Google Scholar]
- Iodice, E., Capaccioli, M., Grado, A., et al. 2016, ApJ, 820, 42 [Google Scholar]
- Iodice, E., Spavone, M., Capaccioli, M., et al. 2017a, ApJ, 839, 21 [Google Scholar]
- Iodice, E., Spavone, M., Cantiello, M., et al. 2017b, ApJ, 851, 75 [Google Scholar]
- Iodice, E., Spavone, M., Capaccioli, M., et al. 2019, A&A, 623, A1 [NASA ADS] [CrossRef] [EDP Sciences] [Google Scholar]
- Iodice, E., Spavone, M., Cattapan, A., et al. 2020a, A&A, 635, A3 [NASA ADS] [CrossRef] [EDP Sciences] [Google Scholar]
- Iodice, E., Cantiello, M., Hilker, M., et al. 2020b, A&A, 642, A48 [EDP Sciences] [Google Scholar]
- Iodice, E., Spavone, M., Raj, M. A., et al. 2021a, ArXiv e-prints [arXiv:2102.04950] [Google Scholar]
- Iodice, E., La Marca, A., Hilker, M., et al. 2021b, A&A, 652, L11 [NASA ADS] [CrossRef] [EDP Sciences] [Google Scholar]
- Iodice, E., Hilker, M., Doll, G., et al. 2023, A&A, 679, A69 [NASA ADS] [CrossRef] [EDP Sciences] [Google Scholar]
- Jiménez-Teja, Y., Dupke, R. A., Lopes de Oliveira, R., et al. 2019, A&A, 622, A183 [Google Scholar]
- Jones, M. G., Verdes-Montenegro, L., Moldon, J., et al. 2023, A&A, 670, A21 [NASA ADS] [CrossRef] [EDP Sciences] [Google Scholar]
- Joo, H., & Jee, M. J. 2023, Nature, 613, 37 [NASA ADS] [CrossRef] [Google Scholar]
- Keel, W. C., & White, R. E. 2001, AJ, 122, 1369 [NASA ADS] [CrossRef] [Google Scholar]
- Kluge, M., Neureiter, B., Riffeser, A., et al. 2020, ApJS, 247, 43 [Google Scholar]
- Koch, A., Burkert, A., Rich, R. M., et al. 2012, ApJ, 755, L13 [Google Scholar]
- Kuijken, K. 2011, The Messenger, 146, 8 [NASA ADS] [Google Scholar]
- La Marca, A., Peletier, R., Iodice, E., et al. 2022a, A&A, 659, A92 [NASA ADS] [CrossRef] [EDP Sciences] [Google Scholar]
- La Marca, A., Iodice, E., Cantiello, M., et al. 2022b, A&A, 665, A105 [NASA ADS] [CrossRef] [EDP Sciences] [Google Scholar]
- Lima-Dias, C., Monachesi, A., Torres-Flores, S., et al. 2021, MNRAS, 500, 1323 [Google Scholar]
- Longobardi, A., Arnaboldi, M., Gerhard, O., et al. 2013, A&A, 558, A42 [NASA ADS] [CrossRef] [EDP Sciences] [Google Scholar]
- Longobardi, A., Arnaboldi, M., Gerhard, O., & Mihos, J. C. 2015, A&A, 579, L3 [NASA ADS] [CrossRef] [EDP Sciences] [Google Scholar]
- Madrid, J. P., O’Neill, C. R., Gagliano, A. T., & Marvil, J. R. 2018, ApJ, 867, 144 [NASA ADS] [CrossRef] [Google Scholar]
- Mancillas, B., Duc, P.-A., Combes, F., et al. 2019, A&A, 632, A122 [NASA ADS] [CrossRef] [EDP Sciences] [Google Scholar]
- Merritt, A., Pillepich, A., van Dokkum, P., et al. 2020, MNRAS, 495, 4570 [NASA ADS] [CrossRef] [Google Scholar]
- Mieske, S., Hilker, M., & Infante, L. 2005, A&A, 438, 103 [NASA ADS] [CrossRef] [EDP Sciences] [Google Scholar]
- Mihos, J. C., Harding, P., Feldmeier, J., & Morrison, H. 2005, ApJ, 631, L41 [Google Scholar]
- Mihos, J. C., Harding, P., Feldmeier, J. J., et al. 2017, ApJ, 834, 16 [Google Scholar]
- Miller, T. B., van Dokkum, P., Danieli, S., et al. 2021, ApJ, 909, 74 [NASA ADS] [CrossRef] [Google Scholar]
- Misgeld, I., Mieske, S., & Hilker, M. 2008, A&A, 486, 697 [NASA ADS] [CrossRef] [EDP Sciences] [Google Scholar]
- Misgeld, I., Mieske, S., Hilker, M., et al. 2011, A&A, 531, A4 [NASA ADS] [CrossRef] [EDP Sciences] [Google Scholar]
- Monachesi, A., Gómez, F. A., Grand, R. J. J., et al. 2019, MNRAS, 485, 2589 [NASA ADS] [CrossRef] [Google Scholar]
- Montes, M. 2022, Nat. Astron., 6, 308 [NASA ADS] [CrossRef] [Google Scholar]
- Montes, M., & Trujillo, I. 2019, MNRAS, 482, 2838 [Google Scholar]
- Montes, M., & Trujillo, I. 2022, ApJ, 940, L51 [NASA ADS] [CrossRef] [Google Scholar]
- Montes, M., Brough, S., Owers, M. S., & Santucci, G. 2021, ApJ, 910, 45 [Google Scholar]
- Murante, G., Giovalli, M., Gerhard, O., et al. 2007, MNRAS, 377, 2 [Google Scholar]
- Pillepich, A., Nelson, D., Hernquist, L., et al. 2018, MNRAS, 475, 648 [Google Scholar]
- Popesso, P., Biviano, A., Böhringer, H., & Romaniello, M. 2006, A&A, 445, 29 [NASA ADS] [CrossRef] [EDP Sciences] [Google Scholar]
- Pulsoni, C., Gerhard, O., Arnaboldi, M., et al. 2020, A&A, 641, A60 [EDP Sciences] [Google Scholar]
- Pulsoni, C., Gerhard, O., Arnaboldi, M., et al. 2021, A&A, 647, A95 [EDP Sciences] [Google Scholar]
- Ragusa, R., Spavone, M., Iodice, E., et al. 2021, A&A, 651, A39 [NASA ADS] [CrossRef] [EDP Sciences] [Google Scholar]
- Ragusa, R., Iodice, E., Spavone, M., et al. 2023, A&A, 670, L20 [NASA ADS] [CrossRef] [EDP Sciences] [Google Scholar]
- Raj, M. A., Iodice, E., Napolitano, N. R., et al. 2019, A&A, 628, A4 [NASA ADS] [CrossRef] [EDP Sciences] [Google Scholar]
- Remus, R.-S., & Forbes, D. A. 2022, ApJ, 935, 37 [NASA ADS] [CrossRef] [Google Scholar]
- Remus, R.-S., Dolag, K., & Hoffmann, T. L. 2017, Galaxies, 5, 49 [Google Scholar]
- Rhee, J. 2018, Am. Astron. Soc. Meet. Abstr., 231, 406.01 [Google Scholar]
- Rhee, J., Smith, R., Choi, H., et al. 2017, ApJ, 843, 128 [Google Scholar]
- Richter, O. G. 1987, A&AS, 67, 237 [NASA ADS] [Google Scholar]
- Richter, O. G., Materne, J., & Huchtmeier, W. K. 1982, A&A, 111, 193 [NASA ADS] [Google Scholar]
- Richtler, T., Salinas, R., Misgeld, I., et al. 2011, A&A, 531, A119 [NASA ADS] [CrossRef] [EDP Sciences] [Google Scholar]
- Rudick, C. S., Mihos, J. C., & McBride, C. 2006, ApJ, 648, 936 [NASA ADS] [CrossRef] [Google Scholar]
- Rudick, C. S., Mihos, J. C., Frey, L. H., & McBride, C. K. 2009, ApJ, 699, 1518 [Google Scholar]
- Rudick, C. S., Mihos, J. C., & McBride, C. K. 2011, ApJ, 732, 48 [Google Scholar]
- Schipani, P., Noethe, L., Arcidiacono, C., et al. 2012, J. Opt. Soc. Am. A, 29, 1359 [Google Scholar]
- Schlegel, D. J., Finkbeiner, D. P., & Davis, M. 1998, ApJ, 500, 525 [Google Scholar]
- Schuberth, Y., Richtler, T., Hilker, M., et al. 2010, A&A, 513, A52 [NASA ADS] [CrossRef] [EDP Sciences] [Google Scholar]
- Seigar, M. S., Graham, A. W., & Jerjen, H. 2007, MNRAS, 378, 1575 [Google Scholar]
- Spavone, M., Capaccioli, M., Napolitano, N. R., et al. 2017, A&A, 603, A38 [NASA ADS] [CrossRef] [EDP Sciences] [Google Scholar]
- Spavone, M., Iodice, E., Capaccioli, M., et al. 2018, ApJ, 864, 149 [Google Scholar]
- Spavone, M., Iodice, E., van de Ven, G., et al. 2020, A&A, 639, A14 [NASA ADS] [CrossRef] [EDP Sciences] [Google Scholar]
- Spavone, M., Iodice, E., D’Ago, G., et al. 2022, A&A, 663, A135 [NASA ADS] [CrossRef] [EDP Sciences] [Google Scholar]
- Spiniello, C., Napolitano, N. R., Arnaboldi, M., et al. 2018, MNRAS, 477, 1880 [Google Scholar]
- Tang, L., Lin, W., Wang, Y., Li, J., & Lan, Y. 2023, ApJ, 959, 104 [NASA ADS] [CrossRef] [Google Scholar]
- Toomre, A., & Toomre, J. 1972, ApJ, 178, 623 [Google Scholar]
- Trujillo, I., & Fliri, J. 2016, ApJ, 823, 123 [Google Scholar]
- Trujillo, I., D’Onofrio, M., Zaritsky, D., et al. 2021, A&A, 654, A40 [NASA ADS] [CrossRef] [EDP Sciences] [Google Scholar]
- Venhola, A., Peletier, R., Laurikainen, E., et al. 2018, A&A, 620, A165 [NASA ADS] [CrossRef] [EDP Sciences] [Google Scholar]
- Ventimiglia, G., Arnaboldi, M., & Gerhard, O. 2011, A&A, 528, A24 [NASA ADS] [CrossRef] [EDP Sciences] [Google Scholar]
- Wang, J., Staveley-Smith, L., Westmeier, T., et al. 2021, ApJ, 915, 70 [Google Scholar]
- White, S. D. M., & Rees, M. J. 1978, MNRAS, 183, 341 [Google Scholar]
- Zhang, Y., Yanny, B., Palmese, A., et al. 2019, ApJ, 874, 165 [Google Scholar]
Appendix A: Surface brightness profiles
This appendix, available on Zenodo (https://zenodo.org/records/13123011), provides the azimuthally averaged surface brightness and colour profiles of the sample galaxies listed in Table 1.
All Tables
Photometric properties and redshift of the brightest cluster members inside 0.4 Rvir of the Hydra I cluster.
Best-fit parameters of the multi-component 1D fit of the surface brightness profiles of NGC 3311 in the g band.
Best-fit parameters of the multi-component 1D fit of the surface brightness profiles of HCG 048A in the g band.
All Figures
|
Fig. 1. Extracted region of the g-band VST mosaic (0.945 × 0.776 deg ∼0.84 × 0.69 Mpc) of the Hydra I cluster, which corresponds to ∼0.4 Rvir. The brightest galaxy members (mR ≤ 15 mag) from the Christlein & Zabludoff (2003) catalogue are marked as red diamonds. The BCG, NGC 3311, is marked with the green cross. The large blue circles indicate the galaxies whose heliocentric velocity is comparable to or larger than the escape velocity of the cluster in phase-space (see Sect. 6). The orange symbols mark the position of the two brightest foreground stars in the field, which were subtracted from the original mosaic (see Sect. 4.3). As expected, some artefacts are still present close to the subtracted stars, which are caused by non-symmetric scattered light and the haloes of those two brightest stars. N is up, and east (E) is on the left. |
| In the text | |
|
Fig. 2. Azimuthally averaged surface brightness of NGC 3311. Left panel: Surface brightness profiles (top panel) in the g (blue points) and r (red points) bands, and g − r colour profile (bottom panel). The dashed green line marks the limit of the surface brightness profiles obtained for NGC 3311 by Arnaboldi et al. (2012). Right panel: g-band surface brightness profile in logarithmic radius (top panel), with the best 1D multi-component fit (see text for details). In the lower panel, we show the Δrms residual of the data minus the model (see text for details). |
| In the text | |
|
Fig. 3. Surface brightness profile of NGC 3311 in the r band (black line) and the radially averaged globular cluster number density profile (red line), arbitrarily shifted to match the surface brightness. The left panel shows the cluster-centric distance on a linear scale, and the right panel uses a log scale. The shaded areas indicate the three regimes observed in the GC number density profile: (I) where incompleteness effects are significant, (II) where the GCs follow the galaxy light, and (III) where the GCs trace the ICL. Region I is also shaded in the left panel for reference. At distances larger than ∼6 arcmin from the centre, the shallower profiles indicate the contribution of the ICL baryons, i.e. diffuse light plus intra-cluster GCs. |
| In the text | |
|
Fig. 4. Enlarged region of the Hydra I cluster centred on the core. N is up, and E is left. NGC 3311 and NGC 3309 dominate the cluster centre, while NGC 3312 is visible in the SE. This is member of the SE group. Another two bright galaxies in the core, NGC 3308 and NGC 3307, are also marked in the image. The dashed red contours indicate the X-ray emission from XMM (Hayakawa et al. 2004, 2006). The dashed blue circle marks the outermost radius of 14 arcmin ∼220 kpc, where the surface brightness profiles are mapped, down to μg ∼ 28.5 mag/arcsec2, in the g band. The image is 30.5 × 23.0 arcmin2 wide. |
| In the text | |
|
Fig. 5. Enlarged region of the Hydra I cluster on the NW side of the core. This is the residual image obtained by subtracting the 2D model of the light distribution of NGC 3311 and NGC 3309 from the isophote fit (see text for details). The image is 14.06 × 7.81 arcmin2 wide. The brightest galaxies in the field are marked. In addition, the dashed black lines indicate the distorted isophotes in the outskirts of HCC092 and HCC012, which might suggest possible ongoing interaction. The dashed blue lines mark the stellar streams of the disrupted dwarf HCC026 identified by (Arnaboldi et al. 2012). The several ripples and arcs are artefacts from the residuals of the overlapping outskirts of NGC 3311 and NGC 3309 with the numerous nearby galaxies, in particular, the bright member NGC 3308. |
| In the text | |
|
Fig. 6. Number density of the compact sources as function of the cluster-centric distance. The number density (left axis) of the dwarf galaxy population (red line) is taken from (La Marca et al. 2022a). The GC-specific frequency (black line, right axis) was derived in this work and is described in Sect. 5.3. The vertical dashed blue line marks the outer edge of the stellar envelope around the core, i.e. Rlim ∼ 15 arcmin ∼223 kpc (see Fig. 2). |
| In the text | |
|
Fig. 7. Outskirts of the early-type galaxy NGC 3316, located E of the core. The g-band region centred on NGC 3316 is shown in the left panel. We mark the prominent stellar stream on the SW side of the galaxy. The 2D model obtained from the isophote fit is shown in the middle panel. The right panel shows the residual image, where the 2D model (middle panel) is subtracted from the parent image (left panel). The stellar stream seems to be connected with a bright knot on top of it. Both features might be the remnant of dwarf galaxy, disrupted in the potential well of NGC 3316. |
| In the text | |
|
Fig. 8. Structure and LSB feature in the group north of the core of the Hydra I cluster. Top left panel: Colour-composite image of the group, where the brightest members are marked. The image size is 15 × 15 arcmin2. N is up, and E is left. The dashed orange box indicates the region where diffuse light is detected after all bright sources (stars and galaxies) were modelled and subtracted from the image. The residual is shown in the top right panel. On the NE side, the red circle marks the S-shape LSB feature detected on this side of the group, which is also shown in the lower left panel. The dashed blue box marks the region where the peculiar galaxy HCC 005 and the disrupted dwarf galaxy HCC 087 are located, which is shown in the lower right panel. |
| In the text | |
|
Fig. 9. Colour-composite picture of the NE side of the Hydra I cluster. N is up, and E is left. The size of the picture is 18.37 × 16.21 arcmin2. In the upper left corner lies the HCG048 group, where the group members are labelled. In the lower right corner the other two bright cluster members, NGC 3315 and LEDA 087328 (see also Table 1) are marked. In addition, one of the UDGs detected in the cluster by Iodice et al. (2020a), UDG 4, is also marked in the figure. |
| In the text | |
|
Fig. 10. Azimuthally averaged surface brightness profile of HCG48A in the g band. The best 1D multi-component fit is shown in the top panel. In the lower panel, we show the Δrms residual of the data minus the model (see text for details). |
| In the text | |
|
Fig. 11. Colour-composite picture of the SE group. N is up, and E is left. The size of the image is 12.50 × 13.77 arcmin2. In the bottom part lie the two overlapping spirals, NGC 3314A\B (see Iodice et al. 2021b), while in the upper right corner lies NGC 3312. In NE, a bright lenticular galaxy is visible, NGC 3316, which is in the background of the group at a similar redshift as the galaxies in the core. The lower right box shows an enlarged region around NGC 3312 to enhance the extended stellar filaments on the SW side of the galaxy, due to RPS. They are marked with the two dashed lines. |
| In the text | |
|
Fig. 12. SE group of the Hydra I cluster of galaxies. The black contours mark the emission of the neutral HI gas from the WALLABY survey (Wang et al. 2021). |
| In the text | |
|
Fig. 13. Projected phase-space diagram of the cluster members in Hydra I inside the VST mosaic, i.e. ∼0.4 Rvir. The giants and brightest galaxies (mB < 16 mag) and the dwarf galaxy population by Christlein & Zabludoff (2003) are marked with filled black circles and blue triangles, respectively. The newly confirmed UDGs in the cluster by Iodice et al. (2023) are marked with red asterisks. The solid black line corresponds to the cluster escape velocity. The shaded regions of the diagram indicate the infall times as predicted by Rhee et al. (2017), and reported in the legend on the right. The brightest members of the sub-groups of galaxies identified in the clusters (i.e. north group, SE group, and HCG48 group) are also marked with coloured circles, as listed on the right side of the figure. |
| In the text | |
Current usage metrics show cumulative count of Article Views (full-text article views including HTML views, PDF and ePub downloads, according to the available data) and Abstracts Views on Vision4Press platform.
Data correspond to usage on the plateform after 2015. The current usage metrics is available 48-96 hours after online publication and is updated daily on week days.
Initial download of the metrics may take a while.