Fig. 6.
Download original image
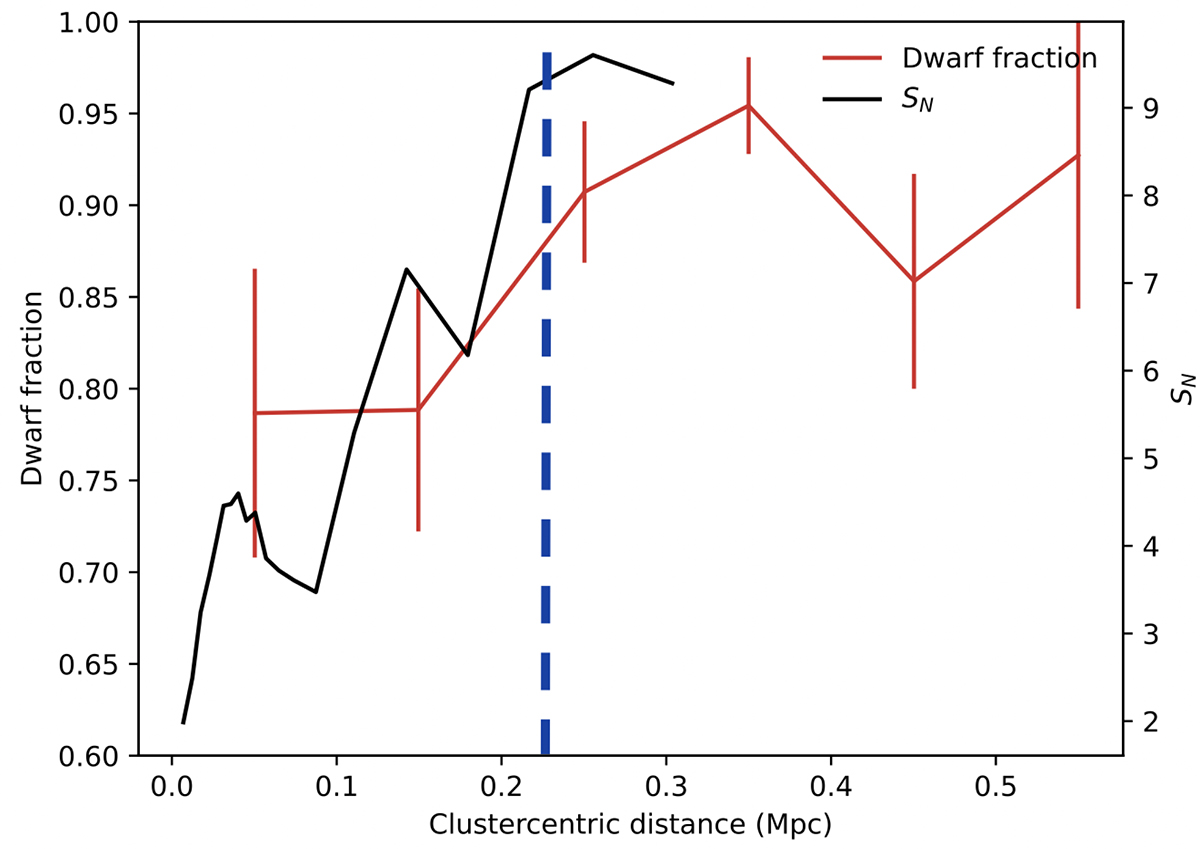
Number density of the compact sources as function of the cluster-centric distance. The number density (left axis) of the dwarf galaxy population (red line) is taken from (La Marca et al. 2022a). The GC-specific frequency (black line, right axis) was derived in this work and is described in Sect. 5.3. The vertical dashed blue line marks the outer edge of the stellar envelope around the core, i.e. Rlim ∼ 15 arcmin ∼223 kpc (see Fig. 2).
Current usage metrics show cumulative count of Article Views (full-text article views including HTML views, PDF and ePub downloads, according to the available data) and Abstracts Views on Vision4Press platform.
Data correspond to usage on the plateform after 2015. The current usage metrics is available 48-96 hours after online publication and is updated daily on week days.
Initial download of the metrics may take a while.