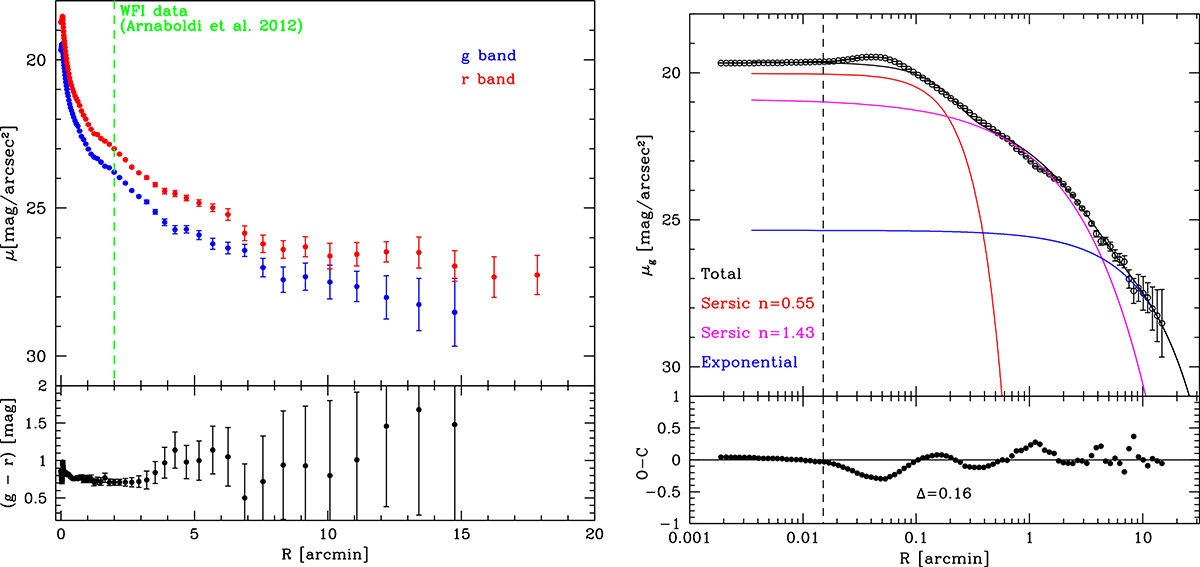
Fig. 2.
Download original image
Azimuthally averaged surface brightness of NGC 3311. Left panel: Surface brightness profiles (top panel) in the g (blue points) and r (red points) bands, and g − r colour profile (bottom panel). The dashed green line marks the limit of the surface brightness profiles obtained for NGC 3311 by Arnaboldi et al. (2012). Right panel: g-band surface brightness profile in logarithmic radius (top panel), with the best 1D multi-component fit (see text for details). In the lower panel, we show the Δrms residual of the data minus the model (see text for details).
Current usage metrics show cumulative count of Article Views (full-text article views including HTML views, PDF and ePub downloads, according to the available data) and Abstracts Views on Vision4Press platform.
Data correspond to usage on the plateform after 2015. The current usage metrics is available 48-96 hours after online publication and is updated daily on week days.
Initial download of the metrics may take a while.